. 2022 Feb 15;13(2):154.
doi: 10.1038/s41419-022-04596-0.

UBE2T-mediated Akt ubiquitination and Akt/β-catenin activation promotes hepatocellular carcinoma development by increasing pyrimidine metabolism

Affiliations

UBE2T-mediated Akt ubiquitination and Akt/β-catenin activation promotes hepatocellular carcinoma development by increasing pyrimidine metabolism

Zhenru Zhu et al. Cell Death Dis. .

Abstract

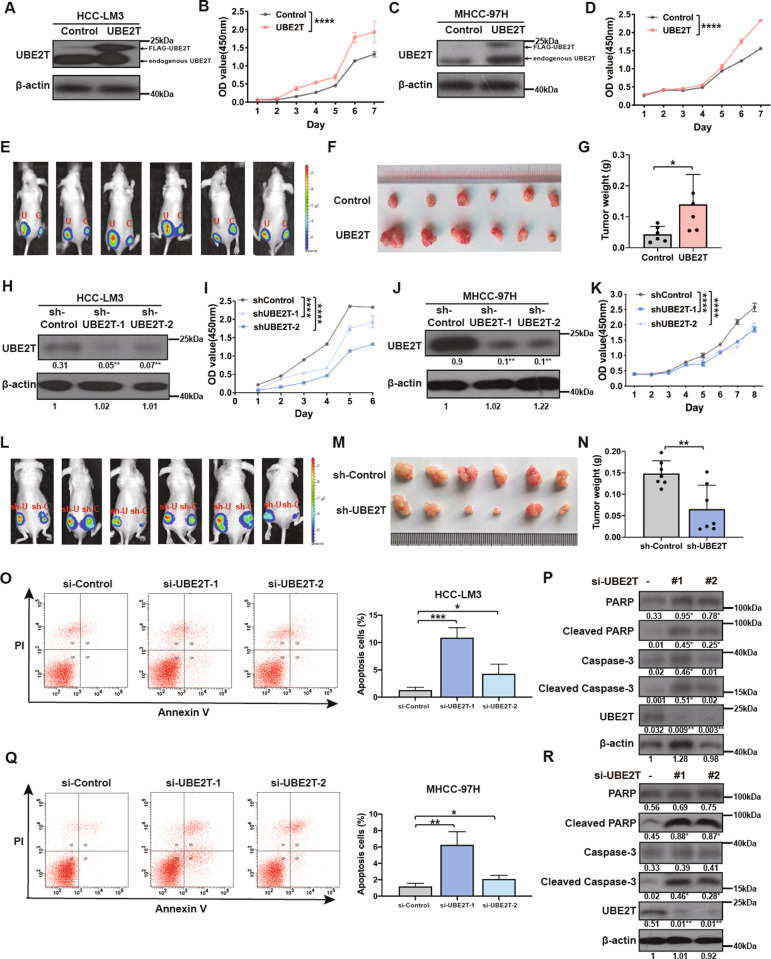
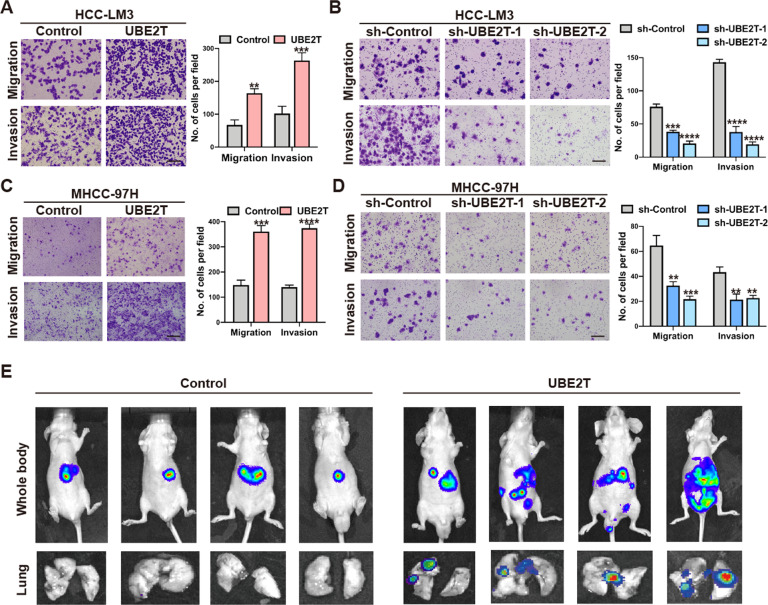
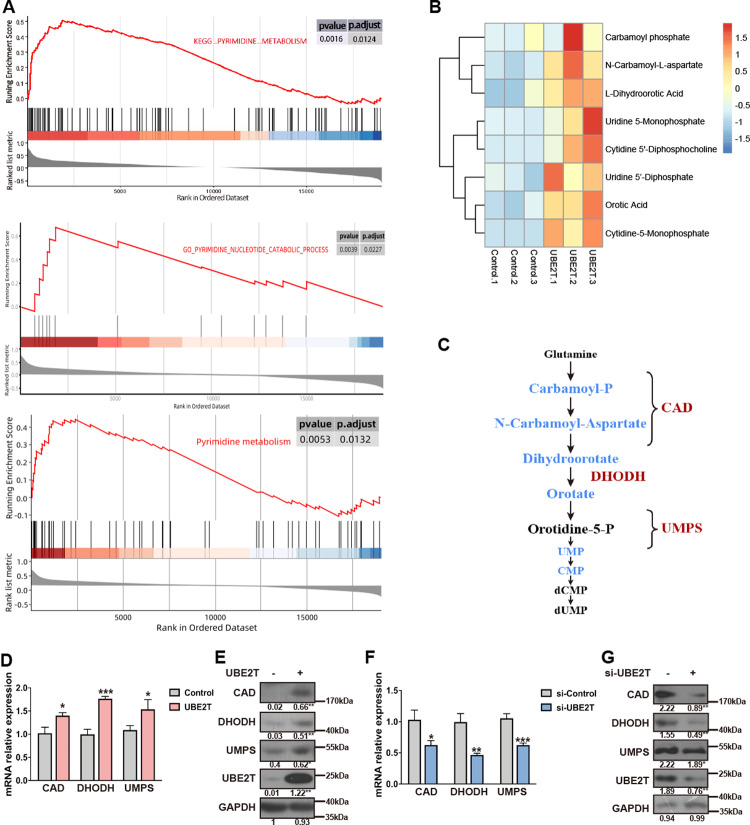
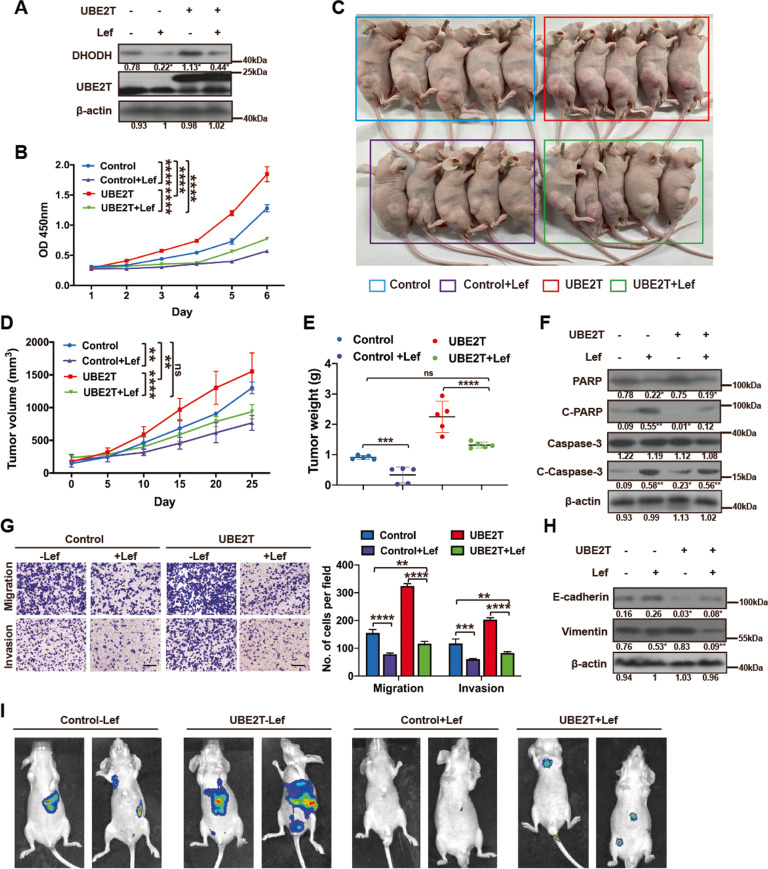
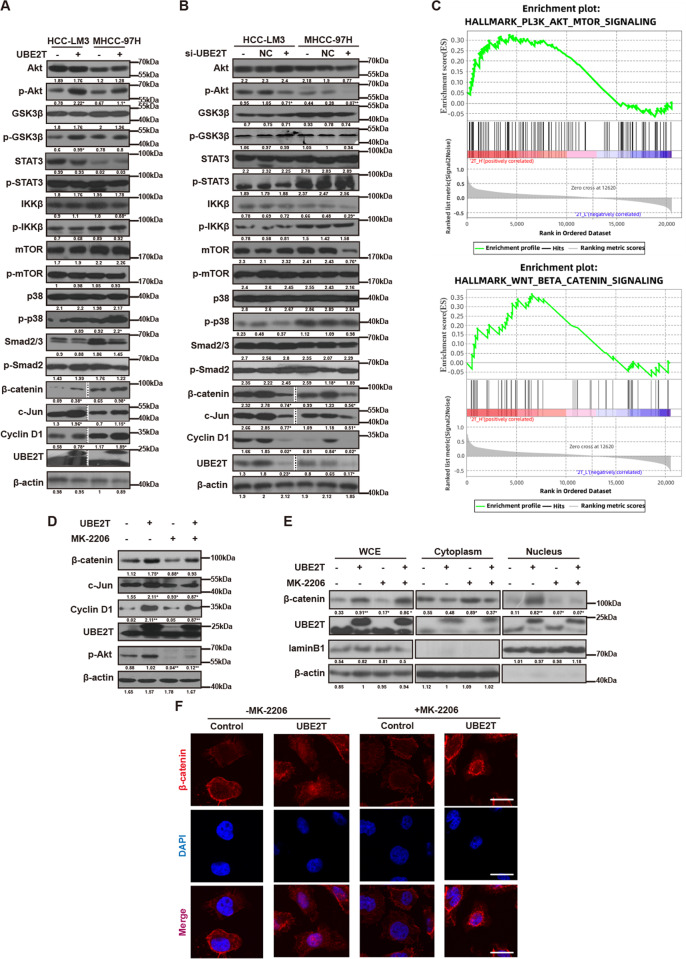
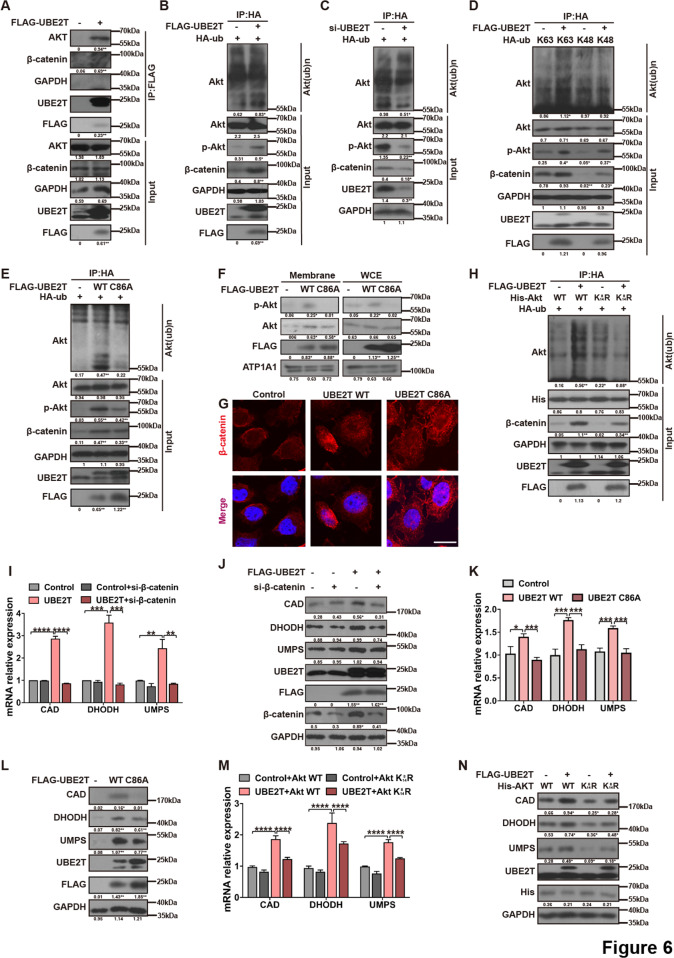
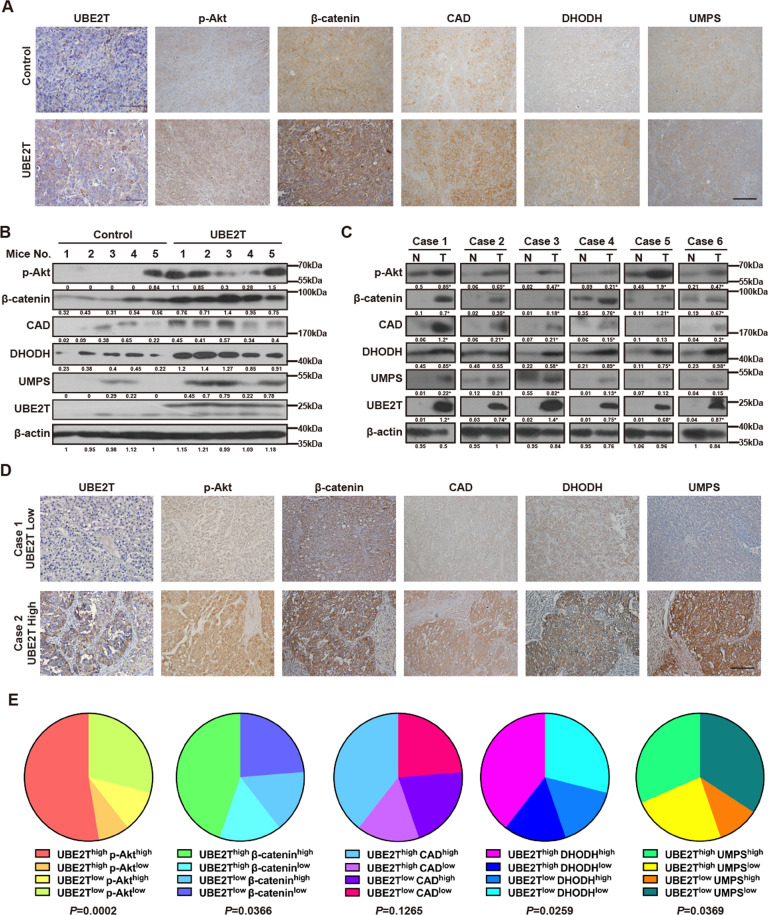
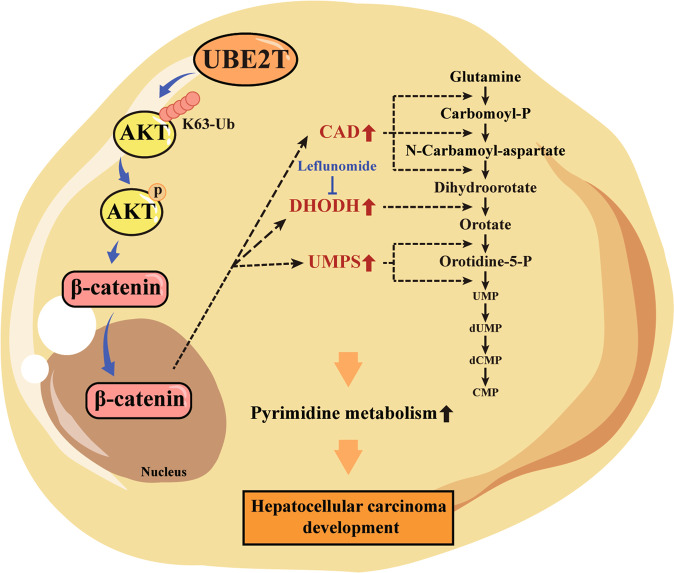
The oncogene protein ubiquitin-conjugating enzyme E2T (UBE2T) is reported to be upregulated in hepatocellular carcinoma (HCC) and correlated with poor clinical outcomes of HCC patients. However, the underlying mechanism by which UBE2T exerts its oncogenic function in HCC remains largely unexplored. In this study, in vitro and in vivo experiments suggested that UBE2T promoted HCC development including proliferation and metastasis. GSEA analysis indicated that UBE2T was positively correlated with pyrimidine metabolism, and LC/MS-MS metabolomics profiling revealed that the key products of pyrimidine metabolism were significantly increased in UBE2T-overexpressing cells. UBE2T overexpression led to the upregulation of several key enzymes catalyzing de novo pyrimidine synthesis, including CAD, DHODH, and UMPS. Moreover, the utilization of leflunomide, a clinically approved DHODH inhibitor, blocked the effect of UBE2T in promoting HCC progression. Mechanistically, UBE2T increased Akt K63-mediated ubiquitination and Akt/β-catenin signaling pathway activation. The disruption of UBE2T-mediated ubiquitination on Akt, including E2-enzyme-deficient mutation (C86A) of UBE2T and ubiquitination-site-deficient mutation (K8/14 R) of Akt impaired UBE2T's effect in upregulating CAD, DHODH, and UMPS. Importantly, we demonstrated that UBE2T was positively correlated with p-Akt, β-catenin, CAD, DHODH, and UMPS in HCC tumor tissues. In summary, our study indicates that UBE2T increases pyrimidine metabolism by promoting Akt K63-linked ubiquitination, thus contributing to HCC development. This work provides a novel insight into HCC development and a potential therapeutic strategy for HCC patients.


Conflict of interest statement

The authors declare no competing interests.

Figures

Fig. 1
Fig. 1. UBE2T promotes HCC proliferation in vitro and in vivo.
A WB for UBE2T expression in HCC-LM3 cells transduced with UBE2T-overexpressing lentivirus or control lentivirus. B The proliferation of UBE2T-overexpressing and control HCC-LM3 cells was assessed by CCK-8 assay. C WB for UBE2T expression in MHCC-97H cells transduced with UBE2T-overexpressing lentivirus or control lentivirus. D The proliferation of UBE2T-overexpressing and control MHCC-97H cells was assessed by CCK-8 assay. E Bioluminescence images of the mice injected subcutaneously with UBE2T-overexpressing and control HCC-LM3 cells. The luminescence signal is represented by an overlaid false-color image with the signal intensity indicated by the scale. F The xenografts from panel E were shown. G Tumor weights of the removed xenografts from panel E. H WB for UBE2T expression in HCC-LM3 cells transduced with a control shRNA lentiviral vector or two independent shRNA lentiviral vectors targeting UBE2T. I The proliferation of UBE2T-silencing and control HCC-LM3 cells was assessed by CCK-8 assay. J WB for UBE2T expression in MHCC-97H cells transduced with a control shRNA lentiviral vector or two independent shRNA lentiviral vectors targeting UBE2T. K The proliferation of UBE2T-silencing and control MHCC-97H cells was assessed by CCK-8 assay. L Bioluminescence images of the mice injected subcutaneously with UBE2T- silencing and control HCC-LM3 cells. M The xenografts from panel L were shown. N Tumor weights of the removed xenografts from panel L. O The % apoptotic cells of HCC-LM3 cells transfected with siRNA of UBE2T and control was detected by flow cytometry. P WB for apoptosis markers in UBE2T-silencing and control HCC-LM3 cells. Q The % apoptotic cells of MHCC-97H cells transfected with siRNA of UBE2T and control was detected by flow cytometry. R WB for apoptosis markers in UBE2T-silencing and control MHCC-97H cells. In all panels, error bar represent mean ± SD, *P < 0.05, **P < 0.01, ***P < 0.001, ****P < 0.0001. In B, D, I, and K, experiments were repeated at least three times, two-way ANOVA was used for comparison between groups. In G and N, an unpaired two-tailed Student’s t-test was used for comparing the two groups. In O and Q, one-way ANOVA was used for comparison between treatment groups, and Tukey post-hoc test was used for two-group comparisons. The average gray values and the statistical data was shown under the corresponding band. Student’s t-test was used for comparisons, *P < 0.05, **P < 0.01.
Fig. 2
Fig. 2. UBE2T promotes HCC metastasis in vitro and in vivo.
AD Transwell assays to assess the migration and invasion ability of A UBE2T-overexpressing and control HCC-LM3 cells, B UBE2T-silencing and control HCC-LM3 cells, C UBE2T-overexpressing and control MHCC-97H cells, D UBE2T-silencing and control MHCC-97H cells. Quantifications of cell number per fields are from at least three independent experiments. Error bar represent mean ± SD, *P < 0.05, **P < 0.01, ***P < 0.001, ****P < 0.0001. Scale bar = 100 μm. In A and C, a two-tailed Student’s t-test was used for comparing the two groups. In B and D, one-way ANOVA was used for comparison between treatment groups, and Tukey post hoc test was used for two-group comparisons. E UBE2T-overexpressing and control HCC-LM3 cells were injected in nude mice by tail vein. Bioluminescence images were collected at 30 days. The luminescence signal is represented by an overlaid false-color image with the signal intensity indicated by the scale.
Fig. 3
Fig. 3. UBE2T regulates pyrimidine metabolism in HCC cells.
A Results of GSEA were plotted to visualize the correlation between the expression of UBE2T and gene signatures of pyrimidine metabolism in the TCGA cohort. B LC-MS/MS-based metabolomics profiling analysis was conducted to analyze UBE2T-overexpressing and control HCC-LM3 cells, and the results of unbiased hierarchical clustering was presented. C Schematic of the de novo pyrimidine synthesis pathway. D The mRNA levels of the indicated genes were detected by qRT-PCR analysis in UBE2T-overexpressing and control HCC-LM3 cells. E The protein levels of the indicated genes were detected by WB analysis in UBE2T-overexpressing and control HCC-LM3 cells. F The mRNA levels of the indicated genes were detected by qRT-PCR analysis in UBE2T-silencing and control MHCC-97H cells. G The protein levels of the indicated genes were detected by immunoblotting analysis in UBE2T-silencing and control MHCC-97H cells. All values shown are mean ± SD of triplicate measurements and experiments, *P < 0.05, **P < 0.01, ***P < 0.001, ****P < 0.0001. In D and F, a two-tailed Student’s t-test was used for comparing the two groups. The average gray values and the statistical data were shown under the corresponding band. Student’s t-test was used for comparisons, *P < 0.05, **P < 0.01.
Fig. 4
Fig. 4. Leflunomide impairs UBE2T-induced proliferation and metastasis in HCC.
A Total cells lysate from UBE2T-overexpressing and control HCC-LM3 cells treated with or without Lef (50 μM, 48 h) were analyzed by WB. B Cells were treated as panel (A). Cell survival was assessed by CCK-8 assay. Experiments were repeated at least three times. C Transplanted xenografts were established with UBE2T-overexpressing (UBE2T) and vector transduced (Control) HCC-LM3 cells. The tumor-bearing mice were treated with or without Lef (7.5 mg/kg/d) by intraperitoneal injection. D Tumor volumes from each group were tracked for 25 days. N = 5 in each group. E Tumor weights of the removed xenografts from each group were measured. F Total cells lysate from the cells treated as panel (A) were analyzed for the apoptosis markers by WB. G Transwell assay to assess the migration and invasion ability of the cells treated as panel (A). Quantification of cell numbers per fields is from at least three independent experiments. Scale bar = 100 μm. H Total cells lysate from the cells treated as panel (A) were analyzed for the EMT markers by WB. I UBE2T-overexpressing and control HCC-LM3 cells were injected in nude mice by tail vein. The tumor-bearing mice were treated with or without Lef (7.5 mg/kg/d) by intraperitoneal injection. Bioluminescence images were collected at 30 days. The luminescence signal is represented by an overlaid false-color image with the signal intensity indicated by the scale. All values shown are mean ± SD. *P < 0.05, **P < 0.01, ***P < 0.001, ****P < 0.0001. In B, E, and G, one-way ANOVA was used for comparison between treatment groups, and Tukey post hoc test was used for two-group comparisons. In D, two-way ANOVA was used for comparison between groups. The average gray values and the statistical data were shown under the corresponding band. Student’s t-test was used for comparisons, *P < 0.05, **P < 0.01.
Fig. 5
Fig. 5. UBE2T activates the Akt/β-catenin signaling pathway.
A, B WB was used to assess the key factors in several signaling pathways in A UBE2T-overexpressing and control, B UBE2T-silencing and control HCC-LM3/MHCC-97H cells. C GSEA exhibited the correlation between the expression of UBE2T and gene signatures of the Akt/β-catenin signaling pathway in the TCGA cohort. D UBE2T-overexpressing and control HCC-LM3 were treated with or without MK-2206 (50 μM, 48 h). Total cells lysate were detected for the indicated proteins. E cells were treated as (D) and then collected for subcellular protein extraction, followed by WB to detect β-catenin and p-Akt. F Cells were treated as panel (D). Representative images of immunofluorescence staining for β-catenin (Red) are shown. Scale bar = 200 μm. The average gray values and the statistical data were shown under the corresponding band. Student’s t-test was used for comparisons, *P < 0.05, **P < 0.01.
Fig. 6
Fig. 6. UBE2T activates the Akt/β-catenin pathway via regulating Akt K63-ubiquitination and leads to upregulation of key enzymes involved in de novo pyrimidine metabolism.
A HCC-LM3 cells were transfected with the FLAG or FLAG-UBE2T vector. FLAG-UBE2T complexes were purified by using an anti-FLAG antibody and analyzed by the indicated antibodies. B UBE2T-overexpressing and control HCC-LM3 cells were transfected with HA-ub vector and treated with MG132 (5 μM) for 8 h. IP using anti-HA antibody followed by WB to detect Akt ubiquitination. C UBE2T-silencing and control MHCC-97H cells were transfected with HA-ub vector and treated with MG132 (5 μM) for 8 h. IP using anti-HA antibody followed by WB to detect Akt ubiquitination. D 293 T cells were co-transfected with FLAG-UBE2T and HA-K48-ub or HA-K63-ub, then treated with MG132 (5 μM) for 8 h. Ubiquitinated AKT was detected in HA immunoprecipitation. E 293 T cells were co-transfected with HA-ub and FLAG-UBE2T WT or FLAG-UBE2T C86A, then treated with MG132 (5 μM) for 8 h. The whole-cell extracts were collected for IP using an anti-HA antibody followed by WB for Akt ubiquitination. F Whole-cell extract and membrane fraction from HCC-LM3 cells transfected with FLAG-UBE2T WT or FLAG-UBE2T C86A were analyzed for Akt by WB. ATP1A1 was included as a loading control for membrane protein. G Cells were treated as panel (F). Representative images of IF staining for β-catenin (Red) are shown. Scale bar = 200 μm. H 293 T cells were transfected with various constructs as indicated, then treated with MG132 (5 μM) for 8 h and performed for Akt ubiquitination analysis. I The mRNA levels of the indicated genes were detected by qRT-PCR analysis in UBE2T-silencing and control HCC-LM3 cells transfected with siRNA targeting β-catenin. J HCC-LM3 cells were co-transfected with FLAG-UBE2T and siRNA targeting β-catenin and then collected for WB. K, L HCC-LM3 cells were transfected with FLAG-UBE2T WT or FLAG-UBE2T C86A and collected for qRT-PCR (K) and WB (L). M The mRNA levels of the indicated genes were detected by qRT-PCR analysis in UBE2T-silencing and control HCC-LM3 cells transfected with His-Akt WT or His-Akt K8/14 R. N HCC-LM3 cells were transfected with FLAG-UBE2T, and His-Akt WT or His-Akt K8/14 R, then collected for WB. In I, K, and M, all data in graph bars are mean ± SD from triplicate experiments. *P < 0.05, **P < 0.01, ***P < 0.001, ****P < 0.0001 by one-way ANOVA followed by Tukey post hoc test. The average gray values and the statistical data were shown under the corresponding band. Student’s t-test was used for comparisons, *P < 0.05, **P < 0.01.
Fig. 7
Fig. 7. UBE2T positively correlates with the Akt/β-catenin signaling pathway and de novo pyrimidine metabolism-related enzymes in HCC.
A The representative images of IHC staining for the indicated proteins in xenografts derived from UBE2T-overexpressing or control HCC-LM3 cells. Scale bar = 100 μm. B WB was performed to detect the indicated proteins in xenografts derived from UBE2T-overexpressing or control HCC-LM3 cells. C WB of the indicated protein in six pairs of HCC tissues (T) and matched non-tumorous liver tissues (N) was performed. D Representative cases of HCC specimens with high level or low levels of UBE2T from 38 HCC patients were analyzed by IHC staining with the indicated proteins. Scale bar = 100 μm. E The expression of the indicated proteins in 38 HCC specimens were analyzed by IHC analysis. The relative proportions of protein expressions were illustrated as a pie chart. *P < 0.05, **P < 0.01, ***P < 0.001, ****P < 0.0001 by chi-square test. The average gray values and the statistical data were shown under the corresponding band. Student’s t-test was used for comparisons, *P < 0.05, **P < 0.01.
Fig. 8
Fig. 8. The schematic of UBE2T-mediated regulation of pyrimidine metabolism and HCC development.
UBE2T upregulates Akt K63-ubiquitination and then promotes Akt phosphorylation and activation, thus leading to the nuclear translocation of β-catenin. The UBE2T-induced Akt/β-catenin axis activation increases the expression of de novo pyrimidine synthesis-related enzymes, including CAD, DHODH, and UMPS, which facilitates the pyrimidine metabolism and hepatocellular carcinoma development. The oncogenic role of UBE2T was impaired by Leflunomide, which is an inhibitor of DHODH.

References

    1. Bray F, Ferlay J, Soerjomataram I, Siegel RL, Torre LA, Jemal A. Global cancer statistics 2018: GLOBOCAN estimates of incidence and mortality worldwide for 36 cancers in 185 countries. CA Cancer J Clin. 2018;68:394–424. - PubMed
    1. Benson AB, D’Angelica MI, Abbott DE, Abrams TA, Alberts SR, Anaya DA, et al. Guidelines insights: hepatobiliary cancers, version 2.2019. J Natl Compr Canc Netw. 2019;17:302–10. - PubMed
    1. Byrne TJ, Rakela J. Loco-regional therapies for patients with hepatocellular carcinoma awaiting liver transplantation: Selecting an optimal therapy. World J Transplant. 2016;6:306–13. - PMC - PubMed
    1. Kulik L, Heimbach JK, Zaiem F, Almasri J, Prokop LJ, Wang Z, et al. Therapies for patients with hepatocellular carcinoma awaiting liver transplantation: a systematic review and meta-analysis. Hepatology. 2018;67:381–400. - PubMed
    1. Liu LP, Yang M, Peng QZ, Li MY, Zhang YS, Guo YH, et al. UBE2T promotes hepatocellular carcinoma cell growth via ubiquitination of p53. Biochem Biophys Res Commun. 2017;493:20–7. - PubMed

Publication types

MeSH terms