. 2022 Feb 15;13(1):869.
doi: 10.1038/s41467-022-28464-9.

Gut metagenome associations with extensive digital health data in a volunteer-based Estonian microbiome cohort

Affiliations

Gut metagenome associations with extensive digital health data in a volunteer-based Estonian microbiome cohort

Oliver Aasmets et al. Nat Commun. .

Abstract

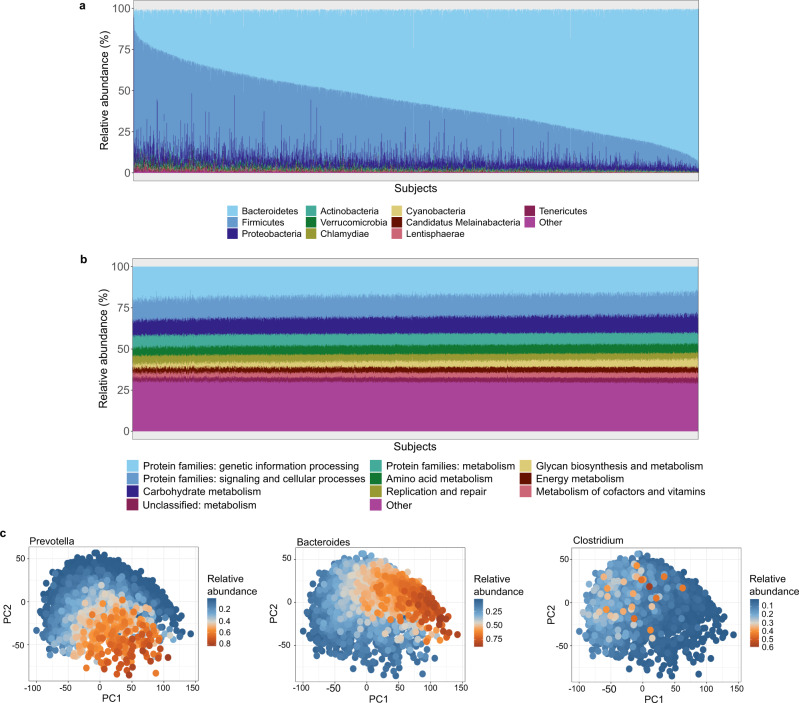
Microbiome research is starting to move beyond the exploratory phase towards interventional trials and therefore well-characterized cohorts will be instrumental for generating hypotheses and providing new knowledge. As part of the Estonian Biobank, we established the Estonian Microbiome Cohort which includes stool, oral and plasma samples from 2509 participants and is supplemented with multi-omic measurements, questionnaires, and regular linkages to national electronic health records. Here we analyze stool data from deep metagenomic sequencing together with rich phenotyping, including 71 diseases, 136 medications, 21 dietary questions, 5 medical procedures, and 19 other factors. We identify numerous relationships (n = 3262) with different microbiome features. In this study, we extend the understanding of microbiome-host interactions using electronic health data and show that long-term antibiotic usage, independent from recent administration, has a significant impact on the microbiome composition, partly explaining the common associations between diseases.


Conflict of interest statement

The authors declare no competing interests.

Figures

Fig. 1
Fig. 1. EstMB cohort characteristics.
a Data flow of the EstMB cohort participants. In 2009–2010 and during the stool sample collection in 2017–2019, subjects (N = 2509) completed questionnaires on their diet and lifestyle. All of the EstMB participants have been genotyped. Additional datasets, e.g., WES, WGS, and NMR metabolite datasets, are available for subsets of participants (Supplementary Fig. 1). Data on disease occurrences, prescribed medications, and medical procedures have been recorded annually for all of the participants using the national EHRs. b The age and gender distributions of the cohort participants were compared to the Estonian population in 2020. c Residence of the cohort participants by county. The two counties colored with dark purple are where most of the population originates from and where the study centers were located. The figure uses county borders data from the Estonian Land Board (accessed 12.01.2021). d Compliance of prevalent diseases from EHRs and self-reported questionnaires. The color bars indicate the data source of the diagnosis (light blue, registries only; blue, registries and questionnaire; dark blue, questionnaire only). EstMB Estonian Microbiome Project, EHRs Electronic health records, NMR Nuclear magnetic resonance, WGS Whole-genome sequencing, WES Whole-exome sequencing.
Fig. 2
Fig. 2. Landscape of the Estonian microbiome.
a Phylum level microbiome composition across all EstMB cohort subjects. b Functional profile of the microbiome across EstMB cohort subjects (KEGG domains). c PCA biplots on species-level taxonomic profiles colored by the relative abundance of the most dominant genus in the sample. EstMB Estonian Microbiome Project, KEGG Kyoto Encyclopedia of Genes and Genomes, PCA Principal component analysis.
Fig. 3
Fig. 3. Statistically significant associations with species-level microbiome alpha and beta diversity.
The bar plot indicates the explained variance in the interindividual variation of the microbial composition obtained by the permutational analysis of variance (based on the Euclidean distance on the centered log-ratio-transformed data). The heatmap shows the Spearman correlation coefficients of each factor with the Shannon’s index of diversity and the observed species richness. Blue indicates a negative correlation, and red indicates a positive correlation. Asterisks indicate associations with false discovery rate < 0.05. In the brackets are the international classification of diseases-10 and anatomical therapeutic chemical codes for diagnoses and medications, respectively.
Fig. 4
Fig. 4. Associations of medication usage history with the observed number of species (the y-axis represents the number of species), Shannon diversity (the y-axis represents the Shannon’s diversity index), or the first two principal components (PCs) of the species-level microbial composition.
a Antibiotics, b Antidepressants. Asterisks indicate statistically significant differences between the drug usage history groups using Wilcoxon test (FDR < 0.05*, FDR < 0.01**, FDR < 0.001***, FDR < 0.0001****), and ns notes statistically nonsignificant results. Color key indicates the five distinct classes of medication users, the non-users and four additional classes based on the quartiles of the number of prescriptions filled over the 10-year period. The sample size for antibiotics were following: nonusers n = 243; [1,2] n = 549; [3,4] n = 440; [5,7] n = 395; [8,42] n = 400 and for antidepressants: nonusers n = 1761; [1,2] n = 188; [3,4] n = 96; [5,9] n = 109; [10,55] n = 115. For all boxplots, the central line, box and whiskers represent the median, interquartile range (IQR), and 1.5 times the IQR, respectively.
Fig. 5
Fig. 5. Effect of adjusting for antibiotic usage on the number of overlapping associations between various diseases.
a Heatmap of overlapping associations between various complex diseases before adjusting for antibiotic usage. b Heatmap of overlapping associations between various complex diseases after taking long-term antibiotic usage into account. c The area under the receiver operating curve (AUROC) values on 10 random test sets for elastic net regression models for predicting diseases based on different predictor sets. The null model includes age, gender, BMI, and stool consistency as predictors, microbiome (MB), and history of antibiotic (AB) usage. Group 1 consists of phenotypes for which the null model provides the best AUROC. Group 2 includes type 2 diabetes, for which the sets including microbial predictors provide the best AUROC. Group 3 includes phenotypes for which the microbiome does not provide an additional predictive value compared to the null model and a history of antibiotic usage leads to the best average AUROC. Group 4 includes anxiety disorder, for which the microbial predictors lead to a higher AUROC compared to the null model, but a history of antibiotic usage leads to the highest average AUROC. Abbreviations in the x-axis of a, b and c are the international classification of diseases-10 codes (ICD-10) for diagnoses. The precise sample size and ICD- 10 descriptions can be located in the Supplementary Table 5. For all boxplots in c, the central line, box and whiskers represent the median, interquartile range (IQR), and 1.5 times the IQR, respectively.

References

    1. Sonnenburg ED, Sonnenburg JL. The ancestral and industrialized gut microbiota and implications for human health. Nat. Rev. Microbiol. 2019;17:383–390. - PubMed
    1. Sonnenburg JL, Sonnenburg ED. Vulnerability of the industrialized microbiota. Science. 2019;366:eaaw9255. - PubMed
    1. Schüssler-Fiorenza Rose SM, et al. A longitudinal big data approach for precision health. Nat. Med. 2019;25:792–804. - PMC - PubMed
    1. Kashyap PC, Chia N, Nelson H, Segal E, Elinav E. Microbiome at the frontier of personalized medicine. Mayo. Clin. Proc. 2017;92:1855–1864. - PMC - PubMed
    1. Wilkinson JE, et al. A framework for microbiome science in public health. Nat. Med. 2021;27:766–774. - PubMed

Publication types

Substances