. 2022 Feb 15;12(1):2624.
doi: 10.1038/s41598-022-06002-3.

Human ignitions on private lands drive USFS cross-boundary wildfire transmission and community impacts in the western US

Affiliations

Human ignitions on private lands drive USFS cross-boundary wildfire transmission and community impacts in the western US

William M Downing et al. Sci Rep. .

Abstract

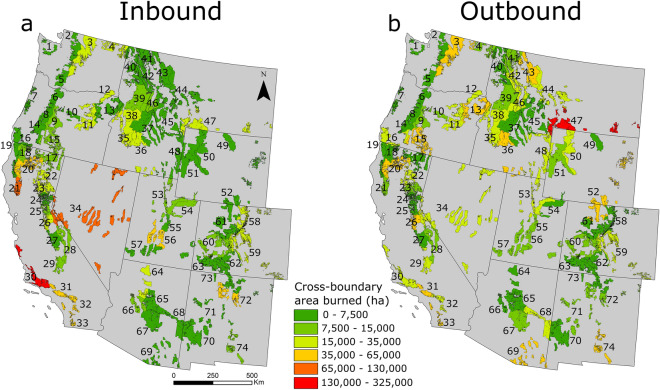
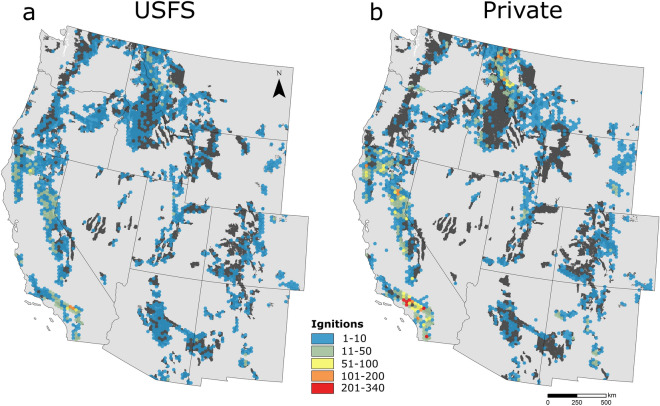
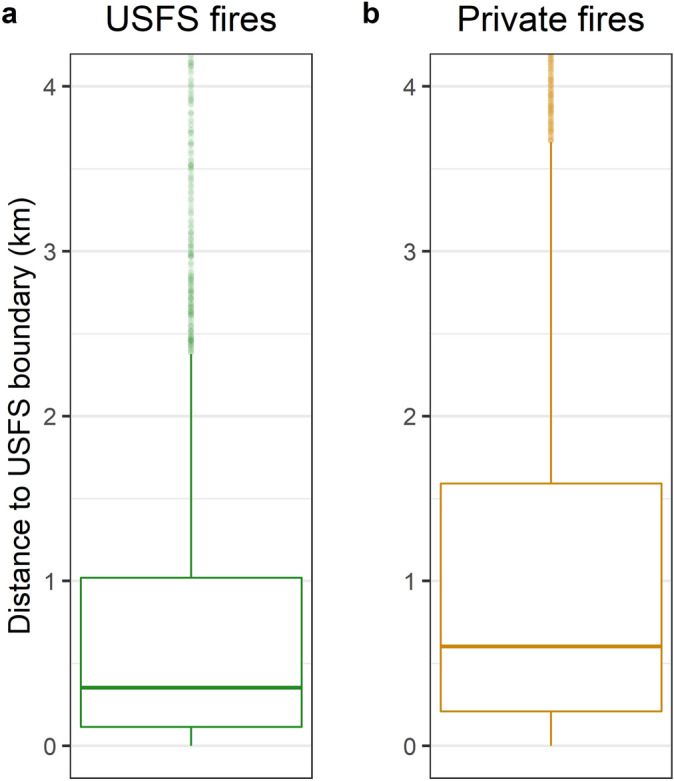
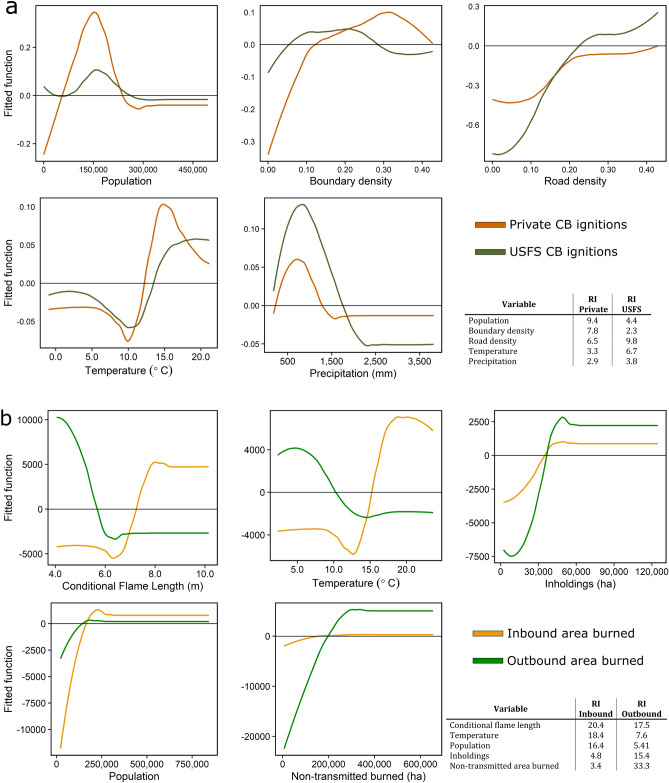
Wildfires in the western United States (US) are increasingly expensive, destructive, and deadly. Reducing wildfire losses is particularly challenging when fires frequently start on one land tenure and damage natural or developed assets on other ownerships. Managing wildfire risk in multijurisdictional landscapes has recently become a centerpiece of wildfire strategic planning, legislation, and risk research. However, important empirical knowledge gaps remain regarding cross-boundary fire activity in the western US. Here, we use lands administered by the US Forest Service as a study system to assess the causes, ignition locations, structure loss, and social and biophysical factors associated with cross-boundary fire activity over the past three decades. Results show that cross-boundary fires were primarily caused by humans on private lands. Cross-boundary ignitions, area burned, and structure losses were concentrated in California. Public lands managed by the US Forest Service were not the primary source of fires that destroyed the most structures. Cross-boundary fire activity peaked in moderately populated landscapes with dense road and jurisdictional boundary networks. Fire transmission is increasing, and evidence suggests it will continue to do so in the future. Effective cross-boundary fire risk management will require cross-scale risk co-governance. Focusing on minimizing damages to high-value assets may be more effective than excluding fire from multijurisdictional landscapes.


Conflict of interest statement

The authors declare no competing interests.

Figures

Figure 1
Figure 1
Area burned by CB fires that impacted USFS lands. Polygons represent USFS national forests. (a) USFS area burned by fires ignited on non-USFS lands (inbound). (b) Area burned outside of national forests by fires ignited on USFS lands (outbound). 1. Olympic, 2. Mt. Baker-Snoqualmie, 3. Okanogan-Wenatchee, 4. Colville, 5. Gifford Pinchot, 6. Mt. Hood, 7. Siuslaw, 8. Willamette, 9. Deschutes, 10. Ochoco, 11. Malheur, 12. Umatilla, 13. Wallowa-Whitman, 14. Umpqua, 15. Fremont-Winema, 16. Rogue River-Siskiyou, 17. Modoc, 18. Klamath, 19. Six Rivers, 20. Shasta-Trinity, 21. Mendocino, 22. Lassen, 23. Plumas, 24. Tahoe, 25. Eldorado, 26. Stanislaus, 27. Sierra, 28. Inyo, 29. Sequoia, 30. Los Padres, 31. Angeles, 32. San Bernardino, 33. Cleveland, 34. Humboldt-Toiyabe, 35. Boise, 36. Sawtooth, 37. Salmon-Challis, 38. Payette, 39. Nez Perce-Clearwater, 40. Idaho Panhandle, 41. Kootenai, 42. Lolo, 43. Flathead, 44. Helena-Lewis and Clark, 45. Beaverhead-Deerlodge, 46. Bitterroot, 47. Custer-Gallatin, 48. Caribou-Targhee, 48. Bighorn, 50. Shoshone, 51. Bridger-Teton, 52. Medicine Bow-Routt, 53. Uinta-Wasatch-Cache, 54. Ashley, 55. Manti-La Sal, 56. Fishlake, 57. Dixie, 58. Arapaho-Roosevelt, 59. Pike-San Isabel, 60. Grand Mesa Uncompahgre-Gunnison, 61. White River, 62. Rio Grande, 63. San Juan, 64. Kaibab, 65. Coconino, 66. Prescott, 67. Tonto, 68. Apache-Sitgreaves, 69. Coronado, 71. Cibola, 72. Santa Fe, 73. Carson, 74. Lincoln.
Figure 2
Figure 2
(a) National forests ranked according to area burned by CB fire between 1992 and 2019. Some forests are net receivers of inbound fire (e.g., Los Padres), while others are net transmitters (e.g., Custer-Gallatin). (b) Total non-transmitted fire load and the ratio of CB area burned (inbound and outbound) to the area burned by non-transmitted fire (CB/NT). CB fire is a major contributor to area burned in and around some national forests (e.g., Mendicino) and not others (e.g., Payette).
Figure 3
Figure 3
Area burned by CB fires derived from FIRESTAT data and binned by ownership category. Blue dots represent decadal averages of inbound and outbound acres combined. CB fire activity increased substantially during our study period. Area burned on USFS lands by fires originating on other ownerships (“inbound”, gray) has increased more rapidly than area burned on non-USFS lands. Ownership categories are described in more detail in the Methods.
Figure 4
Figure 4
CB ignition densities derived from FPA FOD and FIRESTAT databases for fires originating on (a) USFS and (b) private lands between 1992 and 2017. Private ignition data are restricted to fires that impacted USFS lands; fires that originated on private land and spread to other state or federal jurisdictions are not included.
Figure 5
Figure 5
Distance from CB ignitions to USFS national forest borders for fires ignited on (a) USFS and (b) private lands between 1992 and 2017. To improve figure interpretability, the maximum distance shown here is constrained by the 90th percentile (2.62 km) of distance between a USFS ignition and national forest boundary. Private ignition data are restricted to fires that impacted USFS lands; fires that originated on private land and spread to other state or federal jurisdictions are not included.
Figure 6
Figure 6
Location of destructive wildfires (> 50 structures lost) between 2000 and 2018 that originated on (a) USFS lands, and (b) non-USFS lands. Fire locations are symbolized by magnitude of structure loss. Relatively few destructive fires originated on USFS lands. The most destructive USFS and non-USFS fires during this time are the Cedar fire and the Camp fire, respectively.
Figure 7
Figure 7
Partial dependence plots and relative influence of variables used to model (a) CB ignitions and (b) CB area burned. Note that the scales vary on the y axes, which represent each variable’s effect on (a) ignition counts and (b) CB area burned after accounting for the influence of other predictor variables. Predictions were center-scaled by subtracting the mean from each value. Partial dependence plots are shown in descending order of importance (left to right) determined by averaging variable relative importance (RI) values between models. Uninfluential variables (RI < 2.5) are not shown.

References

    1. Zald HSJ, Dunn CJ. Severe fire weather and intensive forest management increase fire severity in a multi-ownership landscape. Ecol. Appl. 2018;2:1–13. - PubMed
    1. Schoennagel T, et al. Adapt to more wildfire in western North American forests as climate changes. Proc. Natl. Acad. Sci. 2017;114:4582–4590. doi: 10.1073/pnas.1617464114. - DOI - PMC - PubMed
    1. Johnstone JF, et al. Changing disturbance regimes, ecological memory, and forest resilience. Front. Ecol. Environ. 2016;14:369–378. doi: 10.1002/fee.1311. - DOI
    1. Radeloff VC, Helmers DP, Kramer HA, Mockrin MH, Alexandre PM. Rapid growth of the US wildland-urban interface raises wildfire risk. Proc. Natl. Acad. Sci. 2018 doi: 10.1073/pnas.1718850115. - DOI - PMC - PubMed
    1. Westerling AL, Hidalgo HG, Cayan DR, Swetnam TW. Warming and earlier spring increase western U.S. forest wildfire activity. Science (80-.). 2006;313:940–943. doi: 10.1126/science.1128834. - DOI - PubMed

Publication types