. 2022 Feb 15;13(1):876.
doi: 10.1038/s41467-022-28558-4.

HSL1 and BAM1/2 impact epidermal cell development by sensing distinct signaling peptides

Affiliations

HSL1 and BAM1/2 impact epidermal cell development by sensing distinct signaling peptides

Andra-Octavia Roman et al. Nat Commun. .

Abstract

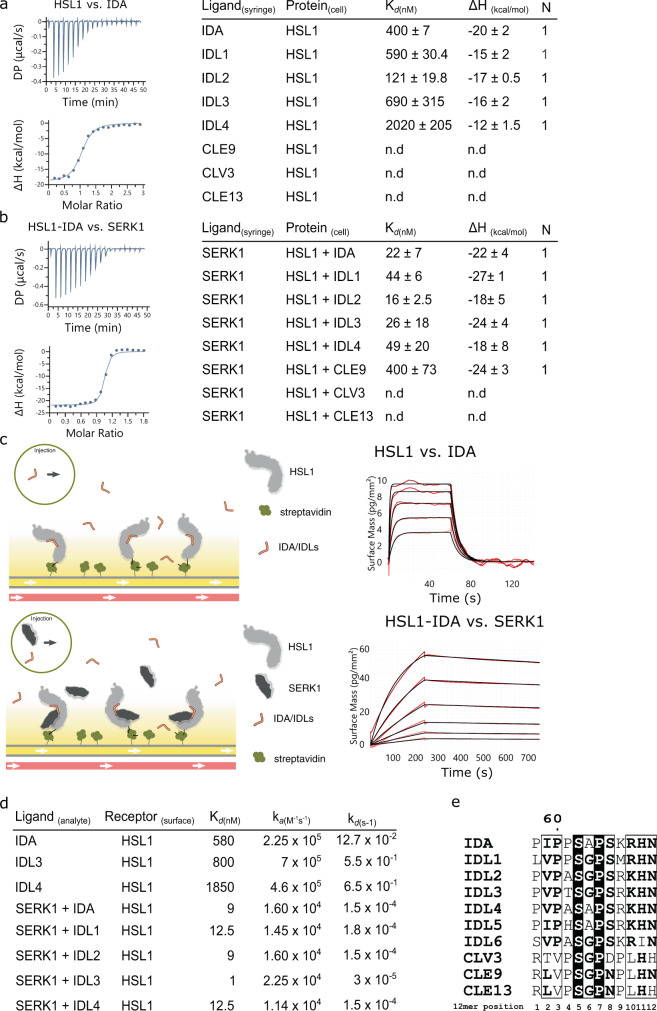
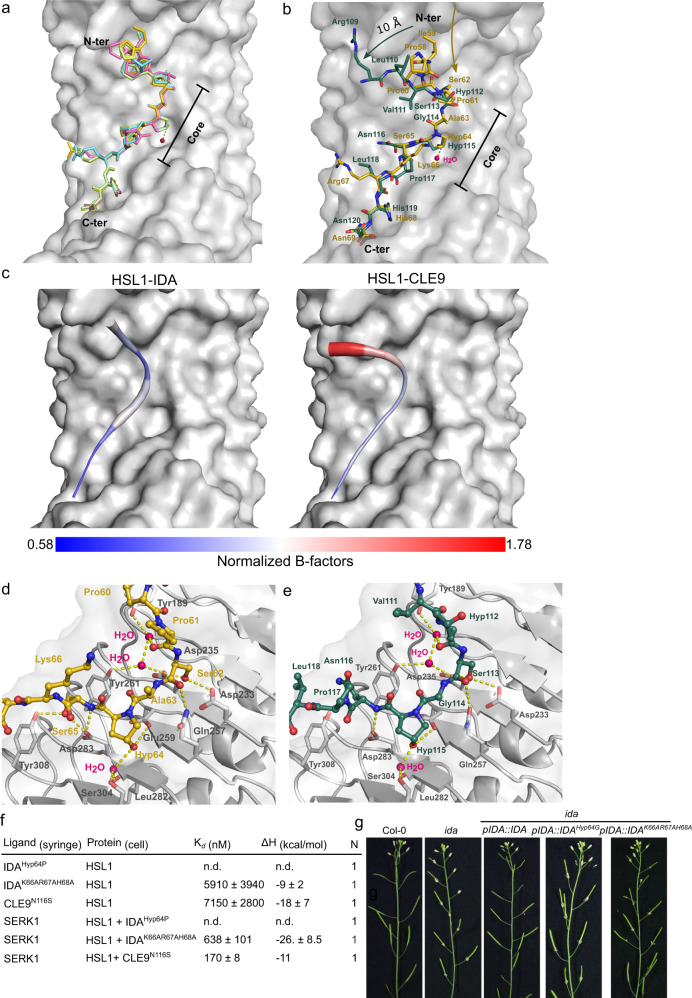
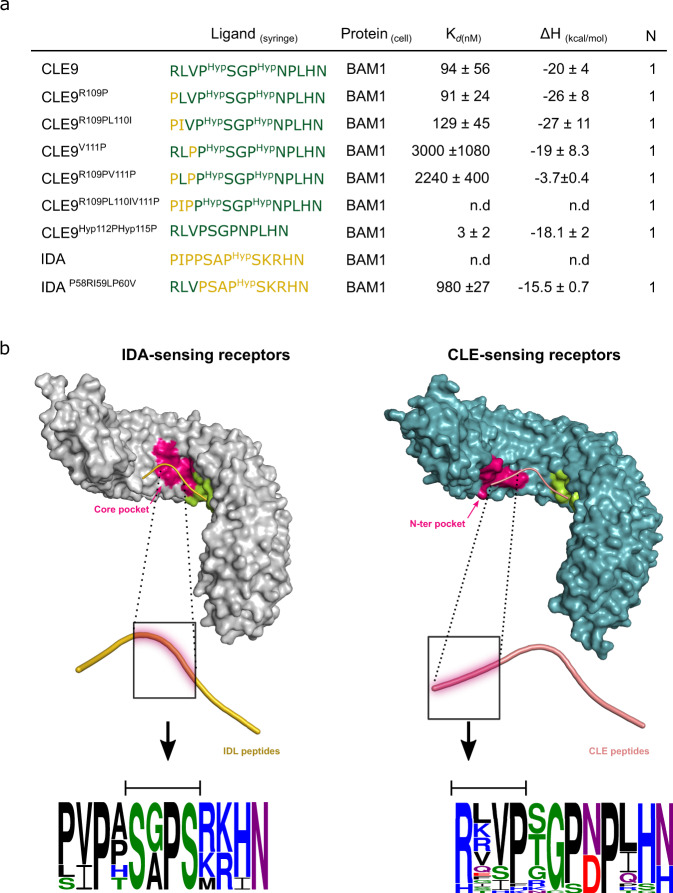
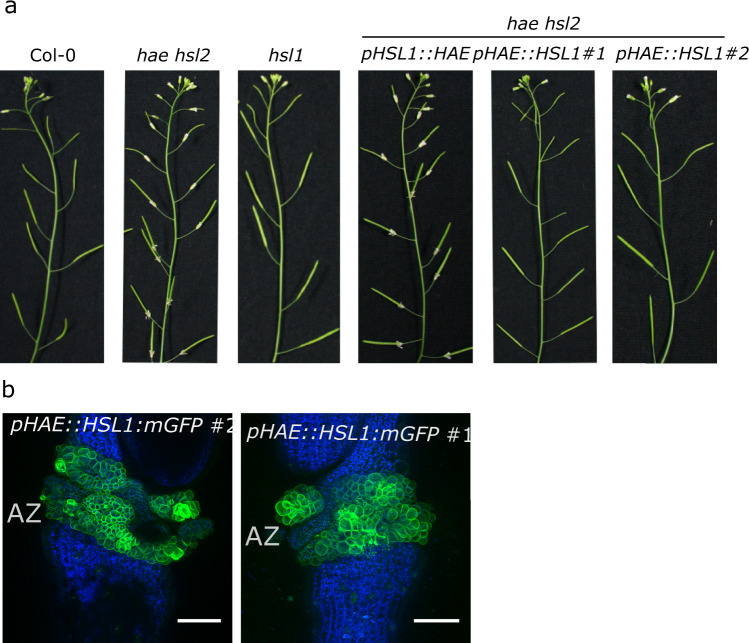
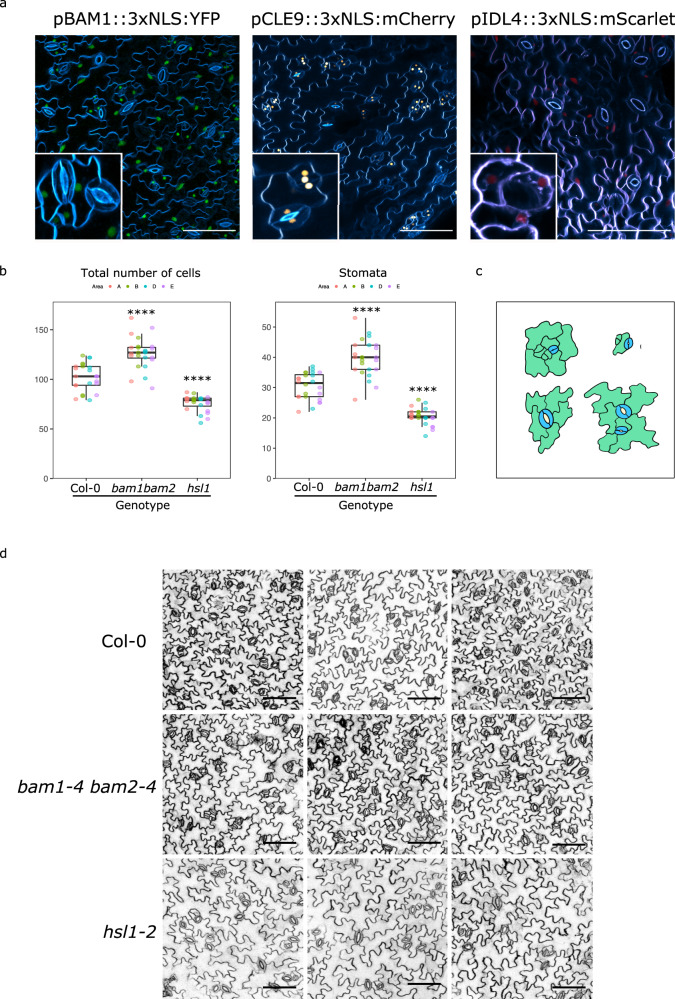
The membrane receptor kinases HAESA and HSL2 recognize a family of IDA/IDL signaling peptides to control cell separation processes in different plant organs. The homologous HSL1 has been reported to regulate epidermal cell patterning by interacting with a different class of signaling peptides from the CLE family. Here we demonstrate that HSL1 binds IDA/IDL peptides with high, and CLE peptides with lower affinity, respectively. Ligand sensing capability and receptor activation of HSL1 require a SERK co-receptor kinase. Crystal structures with IDA/IDLs or with CLE9 reveal that HSL1-SERK1 complex recognizes the entire IDA/IDL signaling peptide, while only parts of CLE9 are bound to the receptor. In contrast, the receptor kinase BAM1 interacts with the entire CLE9 peptide with high affinity and specificity. Furthermore, the receptor tandem BAM1/BAM2 regulates epidermal cell division homeostasis. Consequently, HSL1-IDLs and BAM1/BAM2-CLEs independently regulate cell patterning in the leaf epidermal tissue.


Conflict of interest statement

The authors declare no competing interests.

Figures

Fig. 1
Fig. 1. HSL1 senses IDA/IDL peptides with high affinity and forms a stable complex with the co-receptor SERK1.
a ITC binding experiments and summary table of IDA/IDL and CLE peptides versus HSL1 ectodomain. Kd (dissociation constant) indicates the binding affinity between the two molecules considered (in nanomolar). The N indicates the reaction stoichiometry (n = 1 for a 1:1 interaction). The values indicated in the table are the mean ± SD of at least two independent experiments. b Contribution of the SERK1 co-receptor to the HLS1-IDA/IDLs and HSL1-CLE ternary complex formation. ITC experiments and results table of titrating SERK1 protein into a solution containing HSL1 and the indicated peptide. c Schematic overview of the GCI binding experiments. Experiments were done using Avi-tag-based coupling. Streptavidin (in green) was immobilized using direct amine coupling to the chip. Next, the biotinylated ectodomain of HSL1 was captured by streptavidin. IDA/IDLs (top) or SERK1 + IDA/IDLs (bottom) were used as analytes in the different experiments. Binding kinetics of HSL1 receptor vs. IDA, and HSL1-IDA complex vs. SERK1 obtained from GCI experiments. The sensograms with recorded data are shown in red with the respective fits in black. d GCI summary table of HSL1 vs. IDA/IDLs and contribution of SERK1 to the kinetics of the ternary complex formation. The table contains the corresponding association rate constant (ka), dissociation rate constant (kd), and the dissociation constant Kd from experiments reported in Supplementary Fig. 4. e Sequence alignment of the mature peptides of IDA/IDLs, and CLE9, CLV3, and CLE13.
Fig. 2
Fig. 2. HSL1 discriminates between IDA/IDLs and the CLE9 peptide via the recognition of specific structural features in the N-terminal and core peptide regions.
a IDA/IDL peptides bind to the HSL1 binding groove in a fully extended conformation. Structural superimposition of IDA (yellow bond representation), IDL1 (blue), IDL2 (green), and IDL3 (pink) in the HSL1 binding canyon (light gray). The conserved central hydroxyproline is depicted together with the crystallographic water molecule that connects it to the receptor. b CLE9 falls out of the HSL1 binding pocket. Close view of the structural superimposition of CLE9 (green) and IDA (yellow) in bond representation bound to the HSL1 ligand groove. The yellow arrow indicates the direction of the natural binding canyon followed by IDA (yellow), whereas the green arrow highlights the displacement (10 Å) of the N-terminal of CLE9 (green) with respect to the HSL1 binding surface. c Temperature factor analysis of IDA and CLE9 peptides bound to HSL1 reveals a high atomic displacement parameter for the N-terminal region of CLE9 compared to IDA. Peptides are colored according to the scale of normalized B-factor values (ranging from 0.58 to 1.78, bottom). Normalization was made using the Cα B-factor of the complexes as follows Bi’= Bi/ √(Σ Bi2/n). The surface of the HSL1 receptor is depicted in gray. d The core region of IDA/IDL peptides is specifically recognized by the receptor HSL1 through a highly coordinated network of hydrogen bonds. e CLE9 is missing a key Ser residue in position Asn116 for anchoring the peptide to the HSL1 receptor. Close up view of the core region of CLE9 (green bond representation) in complex with HSL1 (light gray). Hydrogen bonds are depicted in yellow, and waters are shown as bright pink spheres. f Binding analysis of IDAHyp64P, IDAK66AR67AH68A, and CLE9N116S mutants vs. HSLI and SERK1. ITC table summaries. Kd dissociation constant, N stoichiometry (n = 1 for a 1:1 interaction). The values indicated in the table are the mean ± SD of at least two independent experiments. g IDA requires the Hyp64 and its C-terminal region for bioactivity. Abscission complementation assays of ida mutant with wild-type IDA and the IDA variants Pro64 to Gly and the triple mutant Lys66, Arg67, and H68A to Ala, driven by its endogenous promoter. A minimum of two independent lines were analyzed for floral abscission phenotype.
Fig. 3
Fig. 3. The CLE9 peptide uses its N-terminal region to specifically anchor to its cognate receptor BAM1.
N-terminal engineered CLE9 peptides lose their capacity to bind the BAM1 LRR ectodomain a ITC table summaries of engineered CLE9 and IDA variants versus BAM1. Kd, dissociation constant; N, stoichiometry (n = 1 for a 1:1 interaction). The values indicated in the table are the mean ± SD of at least two independent experiments. b Representation of the specific recognition features of IDA/IDLs and CLE-like peptides by their cognate receptors. IDA/IDL peptides and IDA-like receptors are depicted in gold (cartoon) and gray (surface), respectively. CLE-like peptides and CLE-like receptors are shown in pink (cartoon) and dark cyan (surface), respectively. The receptor region highlighted in magenta depicts unique structural features for peptide recognition in each type of receptors; and illustrates the receptor region where the peptide is highly coordinated to form a high-affinity binding pair. We termed these regions “core pocket” and “N-ter pocket” for the IDA-like and CLE-like receptors, respectively. The surface depicted in light green corresponds to a common receptor architecture, with a similar peptide-binding recognition in both types of receptors. A magnification of the peptides is shown to highlight the amino acid position at the specific receptor pocket. Peptide sequence logos for each peptide family were generated through the WebLogo 3 server (http://weblogo.threeplusone.com/) using the sequence information of the IDA/IDL peptides (IDA and IDL1-6) and the mature sequence of the 27 A. thaliana CLE peptides.The size of the amino acid letters correlates with the residue frequency, and the color code depicts the following amino acid properties: green for polar, purple for neutral, blue for basic, red for acidic and black for hydrophobic residues.
Fig. 4
Fig. 4. The LRR-RK HSL1 can mimic HAESA, acting as a positive regulator of floral abscission.
a HSL1, which is not typically expressed in abscission zone (AZ), can perceive IDA in vivo and replace the receptor HAESA in floral shedding. Abscission complementation assays of hae hsl2 double mutant expressing the receptor HSL1 under the HAESA promoter. As control, the HAESA receptor was expressed under the HSL1 promoter. A minimum of two independent lines were analyzed for floral abscission phenotype. Wilt type Col-0, and hae hsl2 and hsl1 mutants were also phenotyped alongside. b Localization of HSL1 in AZ under the expression of the HAESA promoter. Confocal images of AZ of pHAESA::HSL1::mGFP lines. Scale bar = 100 μm.
Fig. 5
Fig. 5. The receptors HSL1 and BAM1-BAM2 impact epidermal cell patterning via signaling of two distinct peptide families.
a BAM1, the peptide CLE9 and IDL4 express in the same or neighboring cell types in epidermal tissue. Expression pattern of pIDL4::3xNLS::mScarlet, pCLE9::3xNLS::mCherry and pBAM1::3xNLS::YFP in the abaxial side of 5-day-old cotyledons. Scale bar = 100 μm b BAM1/2 and HSL1 regulate epidermal cell development. Effects of the double mutant bam1-4 bam2-4 and hsl1-2 on the number of stomata and total number of cells in cotyledons of 10-day-old seedlings. Box plots representing the different total number of cells and stomata of Col-0 vs bam1-4 bam2-4 and hsl1-2. * p < 0.05, ** p < 0.01, *** p < 0.001 and **** p < 0.0001 by two-sided mixed effect model with a Poisson link function and area as a random factor. The different areas counted per cotyledon are depicted in different colors. n = 2457, 3028, 1822 cells were counted over 6 independent cotyledons for Col-0, bam1-4 bam2-4 and hsl1-2, respectively. The centerline of the box plots represents the median value (50th percentile), while the box contains the 25th to 75th percentiles of the dataset. The black whiskers mark the 5th and 95th percentiles, and values beyond these upper and lower bounds are considered outliers. c Schematic representation of epidermal cells counted in cotyledons in b. Young and well-defined stomata are depicted in blue. Non-guard cells (NGCs) are depicted in green, including pavement cells and stomata lineage ground cells (SLGCs). d Representative confocal images of hs1-2, bam1-4 bam2-4, and wild-type Col-0 cotyledons analyzed in the experiment shown in (b). Scale bar = 100 μm.

References

    1. Matsubayashi Y. Posttranslationally modified small-peptide signals in plants. Annu. Rev. Plant Biol. 2014;65:385–413. - PubMed
    1. Hohmann U, Lau K, Hothorn M. The structural basis of ligand perception and signal activation by receptor kinases. Annu. Rev. Plant Biol. 2017;68:109–137. - PubMed
    1. Schardon K, et al. Precursor processing for plant peptide hormone maturation by subtilisin-like serine proteinases. Science. 2016;354:1594–1597. - PubMed
    1. Santiago J, et al. Mechanistic insight into a peptide hormone signaling complex mediating floral organ abscission. eLife. 2016;5:e15075. - PMC - PubMed
    1. Song W, et al. Signature motif-guided identification of receptors for peptide hormones essential for root meristem growth. Cell Res. 2016;26:674–685. - PMC - PubMed

Publication types

MeSH terms

Substances