. 2022 Feb 15;13(1):882.
doi: 10.1038/s41467-022-28505-3.

Cell specific peripheral immune responses predict survival in critical COVID-19 patients

Affiliations

Cell specific peripheral immune responses predict survival in critical COVID-19 patients

Junedh M Amrute et al. Nat Commun. .

Abstract

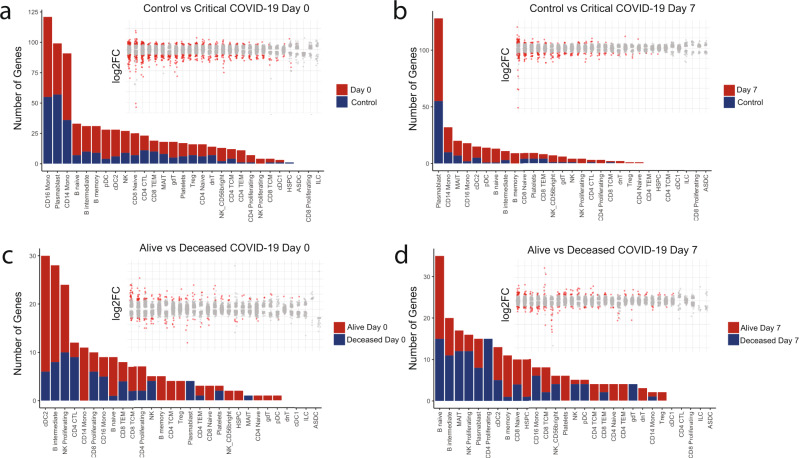
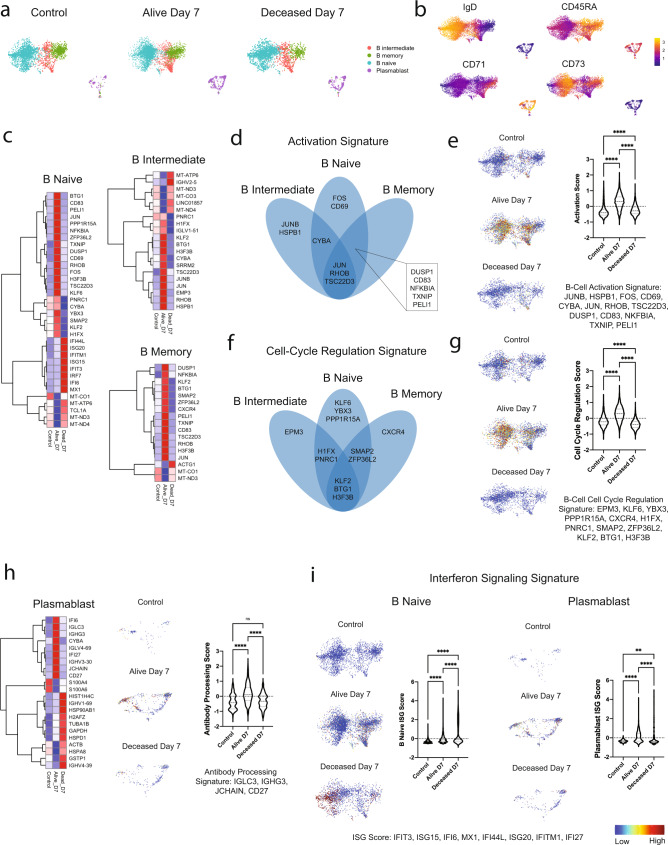
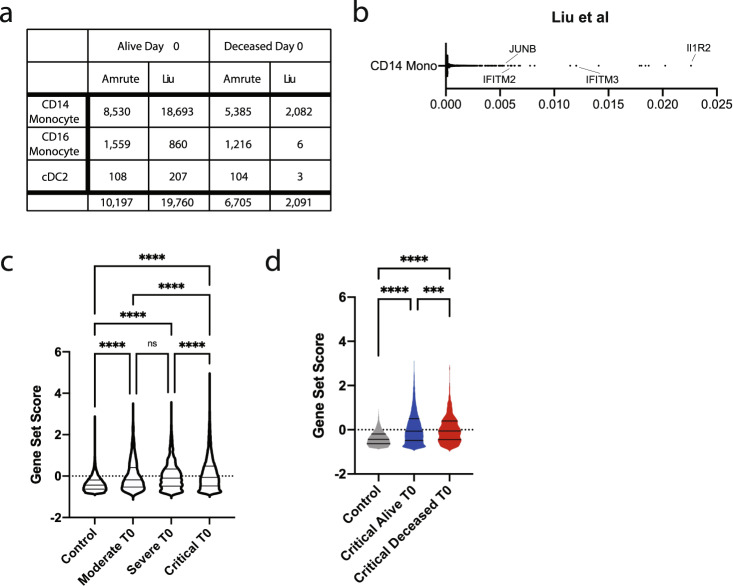
SARS-CoV-2 triggers a complex systemic immune response in circulating blood mononuclear cells. The relationship between immune cell activation of the peripheral compartment and survival in critical COVID-19 remains to be established. Here we use single-cell RNA sequencing and Cellular Indexing of Transcriptomes and Epitomes by sequence mapping to elucidate cell type specific transcriptional signatures that associate with and predict survival in critical COVID-19. Patients who survive infection display activation of antibody processing, early activation response, and cell cycle regulation pathways most prominent within B-, T-, and NK-cell subsets. We further leverage cell specific differential gene expression and machine learning to predict mortality using single cell transcriptomes. We identify interferon signaling and antigen presentation pathways within cDC2 cells, CD14 monocytes, and CD16 monocytes as predictors of mortality with 90% accuracy. Finally, we validate our findings in an independent transcriptomics dataset and provide a framework to elucidate mechanisms that promote survival in critically ill COVID-19 patients. Identifying prognostic indicators among critical COVID-19 patients holds tremendous value in risk stratification and clinical management.


Conflict of interest statement

C.C. receives research support from: Biogen, EISAI, Alector, and Parabon. The funders of the study had no role in the collection, analysis, or interpretation of data; in the writing of the report; or in the decision to submit the paper for publication. C.C. is a member of the advisory board of Vivid genetics, Halia Therapeutics, and ADx Healthcare. The remaining authors declare no competing interests.

Figures

Fig. 1
Fig. 1. Single-cell transcriptomic mapping of PBMCs during critical COVID-19.
a Demographics and clinical characteristics of patient samples selected for sequencing. b Study design. c UMAP embedding plots of scRNA sequencing profiles of 199,097 cells with cluster annotations derived from Azimuth mapping, a CITE-sequencing reference dataset. d UMAP embedding plots for each of the following conditions: Control, Alive Day 0, Alive Day 7, Deceased Day 0, and Deceased Day 7 (n = 6 each). e Heatmap of the top marker gene for each cell type annotated. f Azimuth mapping cell type prediction scores.
Fig. 2
Fig. 2. Single-cell transcriptomics reveal number and magnitude of differential gene expression in specific cell populations during the evolution of critical COVID-19.
Number of differentially expressed genes (adjusted p-value < 0.05 and log2FC > 0.58) in annotated populations between a Control versus Day 0, b Control versus Day 7, c Alive vs Deceased Day 0, and d Alive vs. Deceased Day 7. Dot plots within each subfigure show magnitude of fold-change for each cell type in the same order as the corresponding bar plot. Red dots in dot plots denote differentially expressed genes that reached statistical significance. Differential expression analysis was performed using the default Seurat non-parametric Wilcoxon rank-sum test.
Fig. 3
Fig. 3. B-cell subsets display the strongest transcriptional differences between alive and deceased patients on day 7.
a UMAP embedding plots of B-naive, B-intermediate, B-memory cells, and plasmablasts for the following sample conditions: control, Alive day 7, and Deceased day 7. b UMAP embedding plots of B-cell subsets with imputed CITEseq surface-protein expression for canonical markers. c Hierarchical clustering heatmap of average normalized gene expression for statistically significant differentially expressed genes (adjusted p-value < 0.05 and log2FC > 0.50) between Alive and Deceased day 7 B-naive, B-intermediate, and B-memory cells. d Venn diagram of activation genes from c denoting overlapping signatures across B-cell subsets. e B-cell activation signature z-score for all genes in d overlaid on UMAP embedding plots of B-cells (left) and quantified (right). f Venn diagram of cell-cycle regulation genes from c denoting overlapping signatures across B-cell subsets. g B-cell activation signature z-score for all genes in f overlaid on UMAP embedding plots of B-cells (left) and quantified (right). h Hierarchical clustering heatmap of average normalized gene expression for statistically significant differentially expressed genes (adjusted p-value < 0.05 and log2FC > 0.50) between Alive and Deceased day 7 plasmablasts (left) and antibody processing gene z-scores overlaid on UMAP embedding plots of plasmablasts (middle) and quantified (right). i SARS-CoV-2 IgGII serology at day 7 in critical COVID-19 cohort by outcome. j Interferon signaling gene z-scores overlaid on UMAP embedding of B-cell subsets with quantification in B-naive cells (left) and plasmablasts (right). On all heatmaps blue (low) to red (high) expression. 3261 Control, 5270 Alive day 7, and 2397 Deceased day 7 B-cells were examined across 18 patients. 135 Control, 804 Alive Day 7, and 287 Deceased Day 7 Plasmablasts were examined across 18 patients. Ordinary one-way ANOVA statistical tests were used for each comparison. ** denotes p < 0.01, **** denotes p < 0.0001, and ns denotes not significant.
Fig. 4
Fig. 4. Innate immune cells dominate early peripheral immune responses and predict survival in critical COVID-19.
a UMAP embedding plot of CD14 monocytes, CD16 monocytes, and cDC2 cells for the following sample conditions: Control, Alive day 0, and Deceased day 0. b Hierarchical clustering heatmap of average normalized gene expression for statistically significant differentially expressed genes (adjusted p-value < 0.05 and log2FC > 0.50) between Control, Alive day 0 and Deceased day 0 CD14 monocytes, CD16 monocytes, and cDC2 cells. UMAP embedding plots and quantification for Control, Alive day 0, and Deceased day 0 samples for c inflammatory activation gene set z-scores, d antigen-presentation gene set z-scores, e ISG set z-scores, and f protein synthesis gene set z-scores from genes in b. All comparisons were statistically significant (p < 0.0001) except the ones marked n.s. g Random forest classifier model survival prediction accuracy using 3000 highly variable gene normalized counts in all cell types with at least 100 cells. Red boxed cell types are those with a prediction accuracy of >80%. h Ranked feature importance score from random forest classifier model with key genes annotated in CD14 monocytes (top), CD16 monocytes (middle), and cDC2 cells (bottom). i Global UMAP embedding plot of the top 100 predictive features in CD14 monocytes, CD16 monocytes, and cDC2 cells for Control (top), Alive day 0 (middle), and Deceased day 0 (bottom). j Venn diagram of overlapping genes from the top predictive features for the CD14 monocytes random forest classifier, statistically significant differentially expressed genes between Alive day 0 and Deceased day 0 CD14 monocytes, and statistically significant differentially expressed genes between Control and day 0 CD14 monocytes. k UMAP embedding plot from a of Control (left, top), Alive day 0 (left, middle), and Deceased day 0 (left, bottom) for four overlapping genes (CEBPD, MAFB, IFITM3, and LGALS1) identified from j with z-score quantification (right). On all heatmaps blue (low) to red (high) expression.12,044 Control, 8530 Alive day 0, and 5385 Deceased day 0 CD14 Monocytes were examined across 18 patients. 1694 Control, 1559 Alive day 0, and 1216 Deceased day 0 CD16 Monocytes were examined across 18 patients. 553 Control, 108 Alive day 0, and 104 Deceased day 0 cDC2 cells were examined across 18 patients. Ordinary one-way ANOVA statistical tests were used for each comparison. **** denotes p < 0.0001.
Fig. 5
Fig. 5. Cross-validation of random forest predicted gene signature in an independent cohort of critical COVID.
a Number of CD14 monocytes, CD16 monocytes, and cDC2 cells sequenced by outcome in this study and that by Liu et al.. b Ranked feature importance score from random forest classifier model with key genes annotated in CD14 monocytes in the critically ill cohort in Liu et al.. z-score for CEBPD, MAFB, IFITM3, and LGALS1 in CD14 monocytes from Liu et al. c By disease severity pooled at day 0 and d by survival outcome at day 0 (healthy controls, n = 14, and critically ill patients, n = 25; 21 alive and 4 deceased). 13,464 Control, 1297 Moderate day 0, 2798 Severe day 0, and 20,775 Critical day 0 CD14 Monocytes were examined. Ordinary one-way ANOVA statistical tests were used for each comparison. ns denotes not significant and **** denotes p < 0.0001.

References

    1. Hu, B., Guo, H., Zhou, P. & Shi, Z. L. Characteristics of SARS-CoV-2 and COVID-19. Nat. Rev. Microbiol.10.1038/s41579-020-00459-7 (2021). - PMC - PubMed
    1. Guo, Y. R. et al. The origin, transmission and clinical therapies on coronavirus disease 2019 (COVID-19) outbreak- A n update on the status. Milit. Med. Res.10.1186/s40779-020-00240-0 (2020). - PMC - PubMed
    1. Ge H, et al. The epidemiology and clinical information about COVID-19. Eur. J. Clin. Microbiol. Infect. Dis. 2020 doi: 10.1007/s10096-020-03874-z. - DOI - PMC - PubMed
    1. Long, Q. X. et al. Clinical and immunological assessment of asymptomatic SARS-CoV-2 infections. Nat. Med. 10.1038/s41591-020-0965-6 (2020) - PubMed
    1. Brodin, P. Immune determinants of COVID-19 disease presentation and severity. Nat. Med.10.1038/s41591-020-01202-8 (2021). - PubMed

Publication types