. 2022 Feb;54(2):143-155.
doi: 10.1038/s12276-022-00725-z. Epub 2022 Feb 15.

Lipidome profile predictive of disease evolution and activity in rheumatoid arthritis

Affiliations

Lipidome profile predictive of disease evolution and activity in rheumatoid arthritis

Jung Hee Koh et al. Exp Mol Med. 2022 Feb.

Abstract

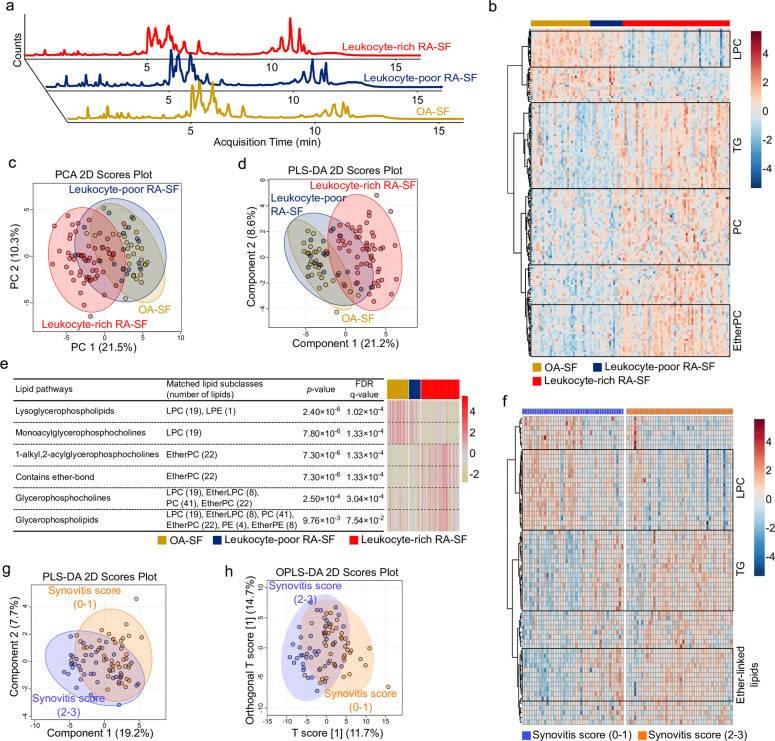
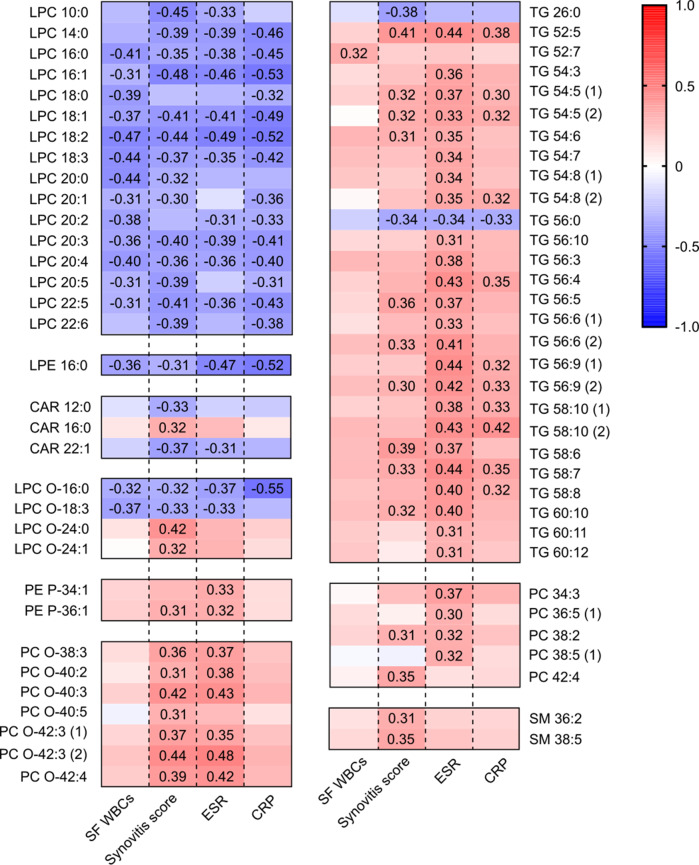
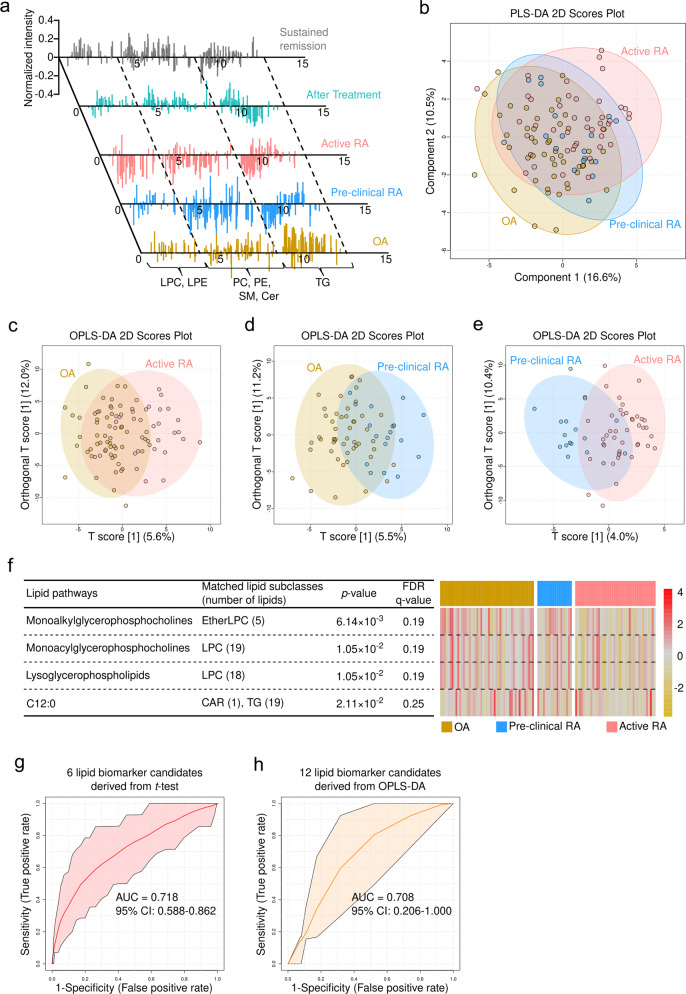
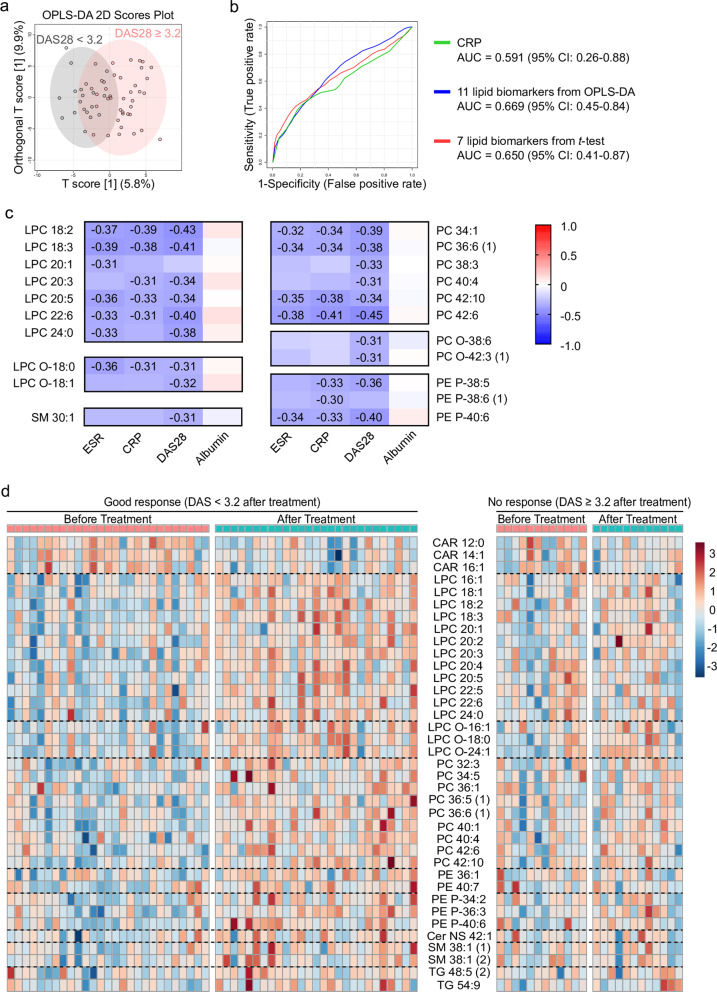
Lipid mediators are crucial for the pathogenesis of rheumatoid arthritis (RA); however, global analyses have not been undertaken to systematically define the lipidome underlying the dynamics of disease evolution, activation, and resolution. Here, we performed untargeted lipidomics analysis of synovial fluid and serum from RA patients at different disease activities and clinical phases (preclinical phase to active phase to sustained remission). We found that the lipidome profile in RA joint fluid was severely perturbed and that this correlated with the extent of inflammation and severity of synovitis on ultrasonography. The serum lipidome profile of active RA, albeit less prominent than the synovial lipidome, was also distinguishable from that of RA in the sustained remission phase and from that of noninflammatory osteoarthritis. Of note, the serum lipidome profile at the preclinical phase of RA closely mimicked that of active RA. Specifically, alterations in a set of lysophosphatidylcholine, phosphatidylcholine, ether-linked phosphatidylethanolamine, and sphingomyelin subclasses correlated with RA activity, reflecting treatment responses to anti-rheumatic drugs when monitored serially. Collectively, these results suggest that analysis of lipidome profiles is useful for identifying biomarker candidates that predict the evolution of preclinical to definitive RA and could facilitate the assessment of disease activity and treatment outcomes.


Conflict of interest statement

The authors declare no conflict of interest.

Figures

Fig. 1
Fig. 1. The lipidome profile and its associated pathways in synovial fluid from RA patients.
a Representative LC-MS/MS chromatogram of lipid extracts belonging to three different synovial fluid (SF) groups (osteoarthritis [OA]-SF, leukocyte-poor RA-SF, and leukocyte-rich RA-SF). b Heatmap of normalized intensity demonstrating significant differences among lipids in the three groups. The lipid subclasses in the heatmap are as follows: lysophosphatidylcholine (LPC), triacylglycerol (TG), phosphatidylcholine (PC), and ether-linked phosphatidylcholine (EtherPC). c PCA 2D score plots and d PLS-DA 2D score plots based on lipidome profiles. e Heatmap of lipid-related pathways that were significantly different among the three groups. The normalized scale of the six pathways in each sample is indicated from red (high) to yellow (low). f Heatmap of lipids that differ significantly according to the synovitis score measured by ultrasound. A synovitis score of 0 or 1 denotes mild synovitis, and a synovitis score of 2 or 3 denotes moderate-to-severe synovitis. g PLS-DA 2D score plot and h OPLS-DA 2D score plot derived from the models established by assignment of mild synovitis and moderate-to-severe synovitis based on the synovial lipidome. Abbreviations: EtherLPC ether-linked lysophosphatidylcholine, EtherPE ether-linked phosphatidylethanolamine, LPE lysophosphatidylethanolamine, OPLS-DA orthogonal partial least squares discriminant analysis, PCA principal component analysis, PLS-DA partial least-squares discriminant analysis.
Fig. 2
Fig. 2. Pearson’s correlation analysis of lipids and laboratory and clinical parameters.
Exact values for the correlation coefficients are depicted in a heatmap when the absolute values of the correlation coefficients are ≥0.3 (i.e., the p values for the correlation coefficients were <0.05). Red indicates a positive correlation, and blue indicates a negative correlation with acute phase reactants (erythrocyte sedimentation rate (ESR) and C-reactive protein (CRP)) and synovial inflammatory parameters (the synovitis score measured by ultrasonography and white blood cell counts in synovial fluid). Abbreviations: CAR acylcarnitine, LPC lysophosphatidylcholine, LPC O- ether-linked LPC, LPE lysophosphatidylethanolamine, PC phosphatidylcholine, PC O- ether-linked phosphatidylcholine, PE P- ether-linked phosphatidylethanolamine, SM sphingomyelin, TG triacylglycerol.
Fig. 3
Fig. 3. Comprehensive interpretation of the serum lipidome profile in RA patients according to disease phase and activity.
a Normalized intensity of the identified lipids in representative samples belonging to five different groups (OA, preclinical RA, active RA (before treatment), paired samples after treatment, and sustained remission). b PLS-DA 2D score plots for the OA, preclinical RA, and active RA groups (Q2 = −0.016). OPLS-DA 2D score plots based on models of c OA and active RA, d OA and preclinical RA, and e preclinical RA and active RA (Q2 = 0.005, −0.090, and −0.363, respectively). f Expression of four significant lipid-related pathways shown as a heatmap; data were obtained from lipid ontology enrichment analysis of all lipids identified in the OA, preclinical RA, and active RA groups. g Six candidate lipid biomarkers (CAR 18:0, DG 36:2, LPC 16:1, LPC 18:1, LPC 20:1, and LPC O-16:1), identified by the t test (p value <0.05, FDR ≤ 0.25), which discriminate active RA from OA. h Twelve candidate lipid biomarkers (CAR 18:0, LPC 16:1, LPC 18:1, LPC 18:2, LPC 18:3, LPC 20:2, LPC 20:3, LPC 20:4, LPC 20:5, LPC 22:6, LPC O-18:0, and LPC O-18:1), identified by the OPLS-DA 2D score plot (|r| >0.5), which discriminate patients who go on to develop RA from patients with preclinical RA.
Fig. 4
Fig. 4. Diagnostic performance of candidate serum lipid biomarkers for assessing RA activity and treatment outcome.
a OPLS-DA 2D score plots derived from models of moderate-to-high disease activity (DAS28 ≥ 3.2) and low disease activity or remission (DAS28 < 3.2) groups. b Validation of biomarker candidates from the discovery set identified by the t test (red) and OPLS-DA (blue). These biomarkers were used for biomarker analysis in the validation set. Area under the receiver operating characteristic (ROC) curve (AUC) analysis of the lipid biomarker candidates identified by the OPLS-DA and t test versus that for the C-reactive protein (as a comparator); parameters were evaluated for the ability to distinguish low disease activity from moderate/high disease activity, as determined by the DAS28 (green). The three compared areas are not significantly different. c Correlation between serum lipids and disease activity parameters. The exact value of the correlation coefficients is presented in a heatmap when absolute correlation coefficients are ≥0.3 (the p values for the correlation coefficient are <0.05). d Heatmap showing the expression of 37 significant lipids identified after comparison of paired samples obtained before and after treatment with DMARDs (samples compared using the t test).

Similar articles

Cited by

References

    1. Schoels M, et al. Evidence for treating rheumatoid arthritis to target: Results of a systematic literature search. Ann. Rheum. Dis. 2010;69:638–643. - PMC - PubMed
    1. Smolen JS, et al. EULAR recommendations for the management of rheumatoid arthritis with synthetic and biological disease-modifying antirheumatic drugs: 2019 update. Ann. Rheum. Dis. 2020;79:685–699. - PubMed
    1. Ajeganova S, et al. Disease-modifying antirheumatic drug-free sustained remission in rheumatoid arthritis: an increasingly achievable outcome with subsidence of disease symptoms. Ann. Rheum. Dis. 2016;75:867–873. - PubMed
    1. Mankia K, Emery P. Preclinical rheumatoid arthritis: Progress toward prevention. Arthritis Rheumatol. 2016;68:779–788. - PubMed
    1. Nielen MMJ, et al. Specific autoantibodies precede the symptoms of rheumatoid arthritis: A study of serial measurements in blood donors. Arthritis Rheum. 2004;50:380–386. - PubMed

Publication types

Substances