. 2022 Feb 15;5(1):131.
doi: 10.1038/s42003-022-03077-6.

A deep learning-based toolbox for Automated Limb Motion Analysis (ALMA) in murine models of neurological disorders

Affiliations

A deep learning-based toolbox for Automated Limb Motion Analysis (ALMA) in murine models of neurological disorders

Almir Aljovic et al. Commun Biol. .

Abstract

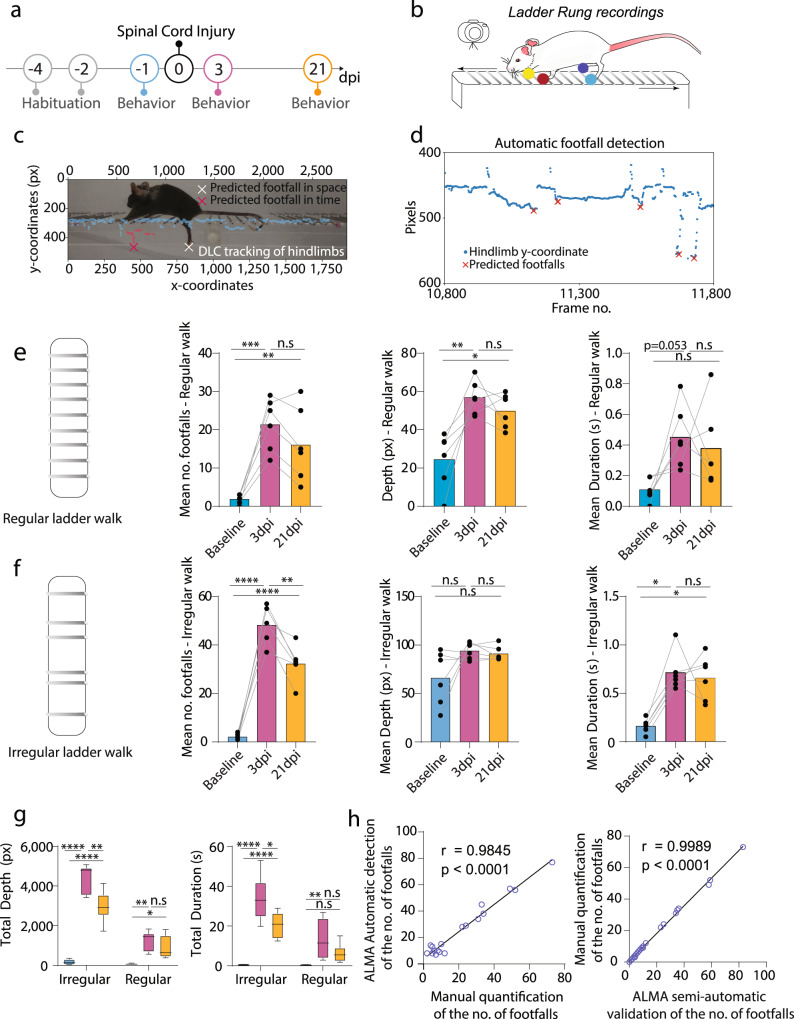
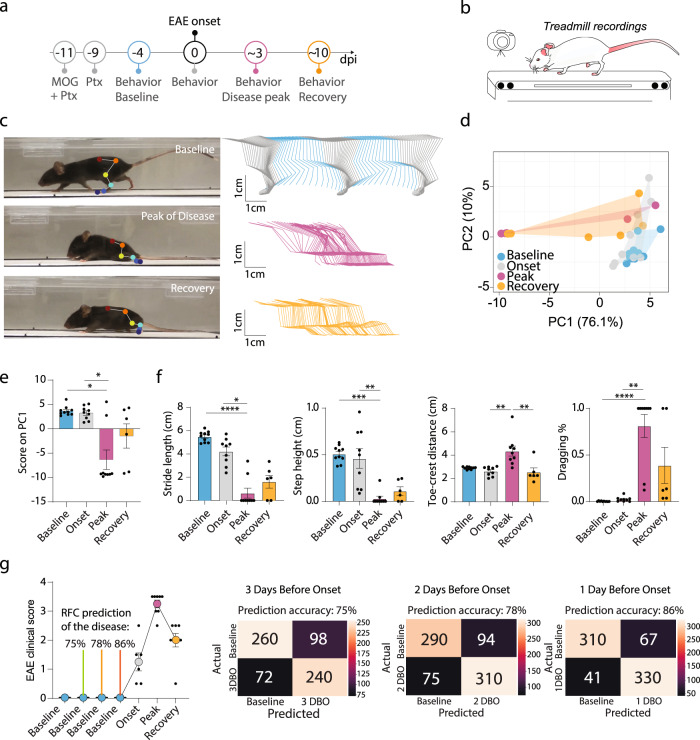
In neuroscience research, the refined analysis of rodent locomotion is complex and cumbersome, and access to the technique is limited because of the necessity for expensive equipment. In this study, we implemented a new deep learning-based open-source toolbox for Automated Limb Motion Analysis (ALMA) that requires only basic behavioral equipment and an inexpensive camera. The ALMA toolbox enables the consistent and comprehensive analyses of locomotor kinematics and paw placement and can be applied to neurological conditions affecting the brain and spinal cord. We demonstrated that the ALMA toolbox can (1) robustly track the evolution of locomotor deficits after spinal cord injury, (2) sensitively detect locomotor abnormalities after traumatic brain injury, and (3) correctly predict disease onset in a multiple sclerosis model. We, therefore, established a broadly applicable automated and standardized approach that requires minimal financial and time commitments to facilitate the comprehensive analysis of locomotion in rodent disease models.


Conflict of interest statement

The authors declare no competing interests.

Figures

Fig. 1
Fig. 1. Automated behavioral analysis using ALMA toolbox.
a Schematic of ALMA toolbox application to treadmill recordings for the generation of gait kinematic parameters. First, treadmill videos were recorded with a GoPro 8 camera placed parallel to the treadmill. Then, markerless limb labeling and modeling was trained and refined using ResNet-50 and DeepLabCut (DLC) and coordinates were extracted. Coordinates were tracked for six hindlimb joints (toe, metatarsophalangeal (MTP) joint, ankle, knee, hip, and iliac crest) in the treadmill kinematic paradigm, and the coordinates were processed using the toolbox to generate hindlimb trajectories. This allowed the generation of 44 kinematic parameters that represented joint angles, spatial variability, limb endpoint trajectories, temporal features of gait, and dragging. Data processing was conducted in ALMA to obtain principal component analysis and random forest classification of the parameters. b Schematic of ALMA toolbox application to the ladder rung recordings for the generation of footfall parameters. First, ladder rung videos were recorded with a GoPro 8 camera placed parallel to the ladder. Then, markerless limb labeling and modeling was trained and refined using ResNet-50 and DLC, and coordinates were extracted. Coordinates could be tracked for all four paws. The toolbox used the automated footfall detector to extract limb tracing and footfall detection. The on- and off-set of locomotor errors (footfalls) were estimated using signal processing methods and subjected to manual validation. Three parameters, the number, depth, and duration of the footfalls, were extracted. Px pixels.
Fig. 2
Fig. 2. ALMA analysis of gait changes in spinal cord injured mice tested on the treadmill.
a Timeline of the traumatic spinal cord injury (SCI) experiment. b Schematic of the treadmill system used to record the behavior of mice during the SCI experiment. c Schematic of DeepLabCut (DLC) markerless joint labeling. Six joints were labeled: iliac crest, hip, knee, ankle, metatarsophalangeal joint (MTP), and toe. d Representation of hindlimb trajectories (left panel) before the adjustment in ALMA (top; green, swing; gray, stance) and after adjustment with ALMA (bottom; green, swing; gray, stance). Note, that after adjustment, swing and stance were efficiently separated. Representation of automatic stride extraction from the toe coordinates and frame number (right panel). e Quantification of parameter reliability; baseline data were tested and re-tested and demonstrated a high correlation coefficient (r = 0.9985, P < 0.0001; Pearson’s correlation coefficient). f Photographic images (top) of mice running on the treadmill showing the markerless labeling of hindlimb joints using DLC at baseline, 3 dpi, and 21 dpi, and hindlimb trajectories for baseline (cyan), 3 dpi (fuchsia), and 21 dpi (orange). g Random forest classification (RFC) of 44 parameters extracted from the ALMA toolbox for the analysis of gait following spinal cord injury and accuracy injury status prediction based on the 44 parameters using confusion matrices for 3 dpi vs. 21 dpi (Gini impurity-based feature importance for RFC: knee joint extension, 0.125; knee joint flexion, 0.112; step height, 0.097. RFC prediction accuracy: baseline vs. 3 dpi 98% and 3 dpi vs. 21 dpi 94%, tested in n = 84–92 step cycles). h Principal component analysis of data obtained on the treadmill and processed with the ALMA toolbox for spinal cord injury, and plot of scores of PC2 that represent 22.3% of the variability (principal component analysis, PC1 36.1%, PC2 22.3%, repeated-measures one-way ANOVA followed by Tukey’s test; baseline vs. 3 dpi [P = 0.022]; baseline vs. 21 dpi [P = 0.920], 3 dpi vs. 21 dpi [P = 0.044]; n = 7). i Quantitative evaluation of parameters associated with PC2, such as step height, knee joint extension, or dynamic time warping (DTW) y plane, at baseline, 3 dpi, and 21 dpi. Repeated-measures one-way ANOVA followed by Tukey’s test was used to analyze knee joint extension (baseline vs. 3 dpi, P = 0.005; baseline vs. 21 dpi, P > 0.999; 3 dpi vs. 21 dpi, P = 0.005; n = 7), Friedman and Dunn tests were used for DTW y plane (baseline vs. 3 dpi, P = 0.004; baseline vs. 21 dpi, P > 0.999; 3 dpi vs. 21 dpi, P = 0.049; n = 7), Repeated-measures one-way ANOVA followed by Tukey’s test was used to analyze step height (baseline vs. 3 dpi, P = 0.063; baseline vs. 21 dpi, P = 0.012; 3 dpi vs. 21 dpi, P > 0.999; n = 6). In all panels, data are presented as mean ± SEM; *P < 0.05; **P < 0.01; ***P < 0.001. Px pixels.
Fig. 3
Fig. 3. ALMA analysis of fine paw placement in spinal cord injured mice in the ladder rung test.
a Timeline of the traumatic spinal cord injury experiment. b Schematic of the ladder rung system used to record the fine paw placement of mice during the spinal cord injury experiment indicating the DeepLabCut (DLC) markerless paw labeling (yellow, red, dark blue and light blue dots). c Photographic image of a mouse running on the treadmill showing the automatic detection of footfall, as predicted in time and space by the toolbox. d Automated detection algorithm used to predict footfalls in space and time. e Quantitative parameters extracted from ALMA for the regular walk showing the mean number, mean depth, and mean duration of footfalls for all time points (cyan, baseline; purple, 3 dpi; and orange, 21 dpi). Repeated one-way ANOVA followed by Tukey’s test was used to the analyze the regular ladder rung results (mean no. footfalls, baseline vs. 3 dpi [P = 0.0002], baseline vs. 21 dpi [P = 0.021], 3 dpi vs. 21 dpi [P = 0.223]; mean depth, baseline vs. 3 dpi [P = 0.003], baseline vs. 21 dpi [P = 0.013], 3 dpi vs. 21 dpi [P = 0.612]; and mean duration, baseline vs. 3 dpi [p = 0.053], baseline vs. 21 dpi [P = 0.131], 3 dpi vs. 21 dpi [P = 0.838]; n = 6). f Quantitative parameters extracted from ALMA for the regular walk showing the mean number, mean depth, and mean duration of footfalls for all time points (cyan, baseline; purple, 3 dpi; and orange, 21 dpi). Repeated one-way ANOVA followed by Tukey’s test was used to the analyze the irregular ladder rung results (mean no. footfalls, baseline vs. 3 dpi: [P < 0.0001], baseline vs. 21 dpi [P < 0.0001], 3 dpi vs. 21 dpi [P = 0.002]; mean depth, baseline vs. 3 dpi [P = 0.745], baseline vs. 21 dpi [P > 0.999], 3 dpi vs. 21 dpi [P > 0.999]; and mean duration, baseline vs. 3 dpi, P = [0.028], baseline vs. 21 dpi [P = 0.028], 3 dpi vs. 21 dpi [P > 0.999]; n = 6). g Quantitative evaluation of the total depth and total duration of footfalls for all time points (cyan, baseline; purple, 3 dpi; and orange, 21 dpi). Repeated one-way ANOVA followed by Tukey’s test was used to analyze total footfall depth on regular ladder rungs (baseline vs. 3 dpi, P = 0.0047; baseline vs. 21 dpi, P = 0.043; and 3 dpi vs. 21 dpi, P = 0.175; n = 6), total depth on irregular ladder rungs (baseline vs. 3 dpi, P < 0.0001; baseline vs. 21 dpi, P < 0.0001; 3 dpi vs. 21 dpi, P = 0.0039; n = 6), total duration on regular ladder rungs (baseline vs. 3 dpi, P = 0.0042; baseline vs. 21 dpi, P = 0.173; 3 dpi vs. 21 dpi, P = 0.101; n = 6), and total duration on irregular ladder rungs (baseline vs. 3 dpi, P < 0.0001; baseline vs. 21 dpi, P = 0.004; 3 dpi vs. 21 dpi, P = 0.041; n = 6). h Correlation between the ALMA automatic detection of the number of footfalls using the deviation algorithm and a fully manual detection (left panel; r = 0.9845, P < 0.0001; Pearson’s correlation coefficient) and between the ALMA semi-automatic detection of the number of footfalls using the deviation algorithm and a fully manual detection (left panel; r = 0.9989, P < 0.0001; Pearson’s correlation coefficient). In all panels, data are presented as mean ± SEM; *P < 0.05; **P < 0.01; ***P < 0.001. Px pixels, dpi days post-injury.
Fig. 4
Fig. 4. ALMA monitoring of gait changes and differences in fine paw placement in brain-injured mice.
a Timeline of the traumatic brain injury experiment. b Schematic of the treadmill system used to record the behavior of the mice during the traumatic brain injury experiment. c Photographic images of the mice running on the treadmill showing markerless labeling of hindlimb joints using DeepLabCut (DLC) at baseline. d Hindlimb trajectories for baseline (top, cyan), 1 dpi (middle, purple), and 10 dpi (bottom, orange). e Random forest classification (left) of the 44 parameters extracted from the ALMA toolbox for the analysis of gait following traumatic brain injury, and confusion matrix (right) for determining prediction accuracy of the injury status based on the 44 parameters (Gini impurity-based feature importance for RFC: hip joint, 0.061; step height, 0.059; hip joint amplitude, 0.056; hip joint flexion, 0.047: RFC prediction accuracy: baseline vs. 1 dpi 83%; tested in n = 282–481 step cycles). f Principal component analysis of data obtained from the treadmill task and processed with the ALMA toolbox, and plot of PC1 scores that represent 37.8% of the variability and associated factor loadings (principal component analysis, PC1 37.8%, PC2 14.7%; repeated one-way ANOVA followed by Tukey’s test, baseline vs. 1 dpi [P = 0.012], baseline vs. 10 dpi [P = 0.665], 1 dpi vs. 10 dpi [P = 0.014]; n = 6). g Quantitative evaluation of factors associated with PC1, i.e., step height, stride length, and dynamic time warping (DTW) distance, at baseline, 1 dpi, and 10 dpi. Repeated one-way ANOVA followed by Tukey’s test was used to analyze step height (baseline vs. 1 dpi, P = 0.0095; baseline vs. 10 dpi, P = 0.730; 1 dpi vs. 10 dpi, P = 0.033; n = 6), stride length (baseline vs. 1 dpi, P = 0.0214; baseline vs. 10 dpi, P = 0.855; 1 dpi vs. 10 dpi, P = 0.0517; n = 6), and DTW distance (baseline vs. 1 dpi, P = 0.001; baseline vs. 10 dpi, P = 0.9943; 1 dpi vs. 10 dpi, P = 0.0012; n = 6). h Schematic of the ladder rung system used to record the behavior of mice during the traumatic brain injury experiment, and photographic images of a mouse running on the treadmill showing markerless labeling of hindlimb paws using DLC at baseline and showing the algorithm detection of footfall. i Quantitative evaluation of three parameters extracted from ALMA for footfalls at baseline, 1 dpi, and 10 dpi. Friedman followed by Dunn’s test was used to analyze the regular ladder rung mean no. footfalls (baseline vs. 1 dpi, P = 0.0315, baseline vs. 10 dpi, P = 0.2557; 1 dpi vs. 10 dpi, P = 0.1583), mean depth (baseline vs. 1 dpi, P = 0.1299; baseline vs. 10 dpi, P = 0.0628; 1 dpi vs. 10 dpi, P > 9999), and mean duration (baseline vs. 1 dpi, P > 0.9999; baseline vs. 10 dpi, P > 0.9999; 1 dpi vs. 10 dpi, P > 9999; n = 6) and the irregular ladder rung mean no. footfalls (baseline vs. 1 dpi, P = 0.3371; baseline vs. 10 dpi, P = 0.9370; 1 dpi vs. 10 dpi, P > 0.9999; n = 6), mean depth (baseline vs. 1 dpi, P = 0.0534, baseline vs. 10 dpi, P > 0.9999; 1 dpi vs. 10 dpi, P = 0.0534; n = 6) and mean duration (baseline vs. 1 dpi, P > 0.9999; baseline vs. 10 dpi, P = 0.9370; 1 dpi vs. 10 dpi, P = 0.3371; n = 6). In all panels, data are presented as mean ± SEM; *P < 0.05; **P < 0.01; ***P < 0.001. Px pixels, dpi days post-injury.
Fig. 5
Fig. 5. ALMA monitoring of locomotor changes in mice that developed experimental autoimmune encephalomyelitis and accurate prediction of disease development during the prodromal phase.
a Timeline of the EAE experiment. b Schematic of treadmill system used to record the behavior of the mice during the EAE experiment. c Photographic images of mice running on the treadmill (left) showing markerless labeling of hindlimb joints using DeepLabCut (DLC) at baseline (top), onset of disease (middle), and disease recovery (bottom), and hindlimb trajectories (right) for baseline (top), onset of disease (middle), and disease recovery (bottom). d Principal component analysis of data obtained on the treadmill and processed with the ALMA toolbox. e Plot of the PC1 scores that represent 76.1% of the variability and associated factor loadings (Kruskal–Wallis followed by Dunn’s test; baseline vs. peak, P = 0.0104; onset vs. peak, P = 0.0418; baseline vs. recovery, P = 0.9806; peak vs. recovery, P > 0.9999). f Quantitative evaluation of factors associated with PC1, i.e., stride length, step height, toe–crest distance, and dragging, at baseline and different stages of EAE (Kruskal–Wallis followed by Dunn’s test; stride length, baseline vs. peak [P < 0.0001], onset vs. peak [P = 0.0231], baseline vs. recovery [P = 0.0019], peak vs. recovery [P > 0.9999]; n = 6; step height, baseline vs. peak [P = 0.0002], onset vs. peak [P = 0.0020], baseline vs. recovery, [P = 0.0382], peak vs. recovery [P > 0.9999]; toe–crest distance, baseline vs. peak [P = 0.0737], onset vs. peak [P = 0.0036], baseline vs. recovery [P = 0.0382], peak vs. recovery [P = 0.7374]; and dragging (%), baseline vs. peak [P < 0.0001], onset vs. peak [P = 0.0082], baseline vs. recovery [P = 0.0039], peak vs. recovery [P > 0.9999]; n = 6). g EAE clinical score and prediction of the disease onset based on random forest classification in the prodromal phase (3, 2, and 1 days before onset) using ALMA. In all panels, data are presented as mean ± SEM; *P < 0.05; **P < 0.01; ***P < 0.001. Px pixels, dpi days post-injury.

References

    1. Krakauer, J. W., Ghazanfar, A. A., Gomez-Marin, A., Maciver, M. A. & Poeppel, D. Perspective neuroscience needs behavior: correcting a reductionist bias. 10.1016/j.neuron.2016.12.041 (2017). - PubMed
    1. Boyden ES, Zhang F, Bamberg E, Nagel G, Deisseroth K. Millisecond-timescale, genetically targeted optical control of neural activity. Nat. Neurosci. 2005;8:1263–1268. - PubMed
    1. Armbruster BN, Li X, Pausch MH, Herlitze S, Roth BL. Evolving the lock to fit the key to create a family of G protein-coupled receptors potently activated by an inert ligand. Proc. Natl Acad. Sci. USA. 2007;104:5163–5168. - PMC - PubMed
    1. Wickersham IR, Finke S, Conzelmann KK, Callaway EM. Retrograde neuronal tracing with a deletion-mutant rabies virus. Nat. Methods. 2007;4:47–49. - PMC - PubMed
    1. Fenno L, Yizhar O, Deisseroth K. The development and application of optogenetics. Annu. Rev. Neurosci. 2011;34:389–412. - PMC - PubMed

Publication types