. 2022 Feb 12;12(2):e8596.
doi: 10.1002/ece3.8596. eCollection 2022 Feb.

Simulated trapping and trawling exert similar selection on fish morphology

Affiliations

Simulated trapping and trawling exert similar selection on fish morphology

Davide Thambithurai et al. Ecol Evol. .

Abstract

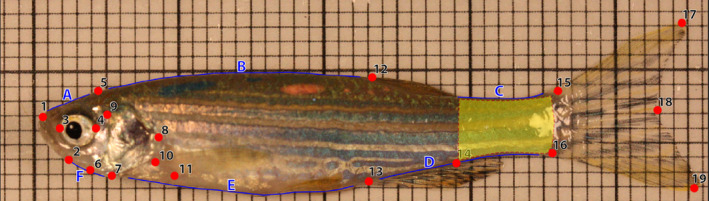
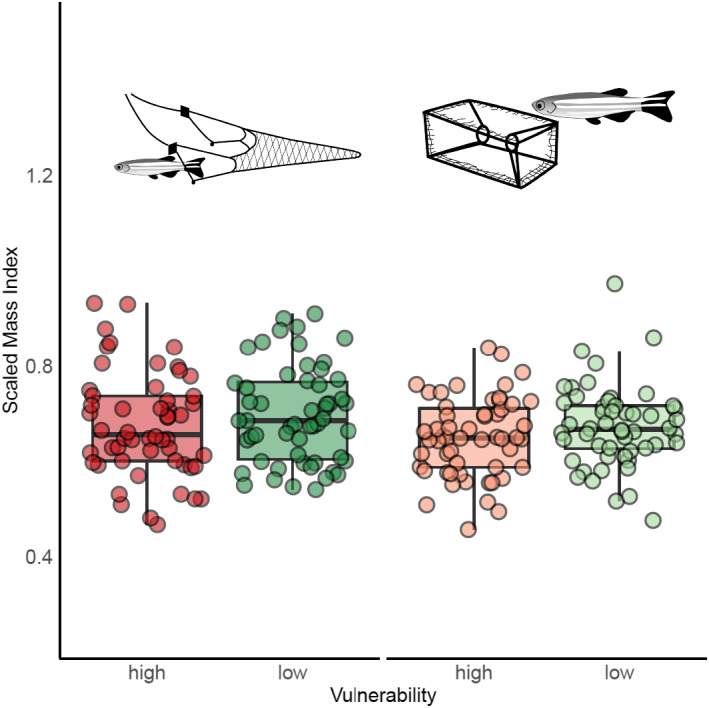
Commercial fishery harvest can influence the evolution of wild fish populations. Our knowledge of selection on morphology is however limited, with most previous studies focusing on body size, age, and maturation. Within species, variation in morphology can influence locomotor ability, possibly making some individuals more vulnerable to capture by fishing gears. Additionally, selection on morphology has the potential to influence other foraging, behavioral, and life-history related traits. Here we carried out simulated fishing using two types of gears: a trawl (an active gear) and a trap (a passive gear), to assess morphological trait-based selection in relation to capture vulnerability. Using geometric morphometrics, we assessed differences in shape between high and low vulnerability fish, showing that high vulnerability individuals display shallower body shapes regardless of gear type. For trawling, low vulnerability fish displayed morphological characteristics that may be associated with higher burst-swimming, including a larger caudal region and narrower head, similar to evolutionary responses seen in fish populations responding to natural predation. Taken together, these results suggest that divergent selection can lead to phenotypic differences in harvested fish populations.

Keywords: FIE; fishing; geometric morphometrics; human impact; locomotion; morphology.


Conflict of interest statement

The authors declare no competing or financial interests.

Figures

FIGURE 1
FIGURE 1
Simplified scheme of trawl setup. (a) Scoring applied to the trawl trials as seen in profile: E B = fish escaped beyond the net; E F = fish escaped in front of the net; C N = fish were caught within the net but did not enter the retention area (cod‐end); C C = fish were caught in the retention area. The trawl apparatus was fitted to the working area of a recirculating flume (b). Areas shaded in yellow indicate potential escape routes, fish were only able to escape under the footrope when turbulent flow lifted it momentarily. For more details, please see supplementary materials (Figure S2)
FIGURE 2
FIGURE 2
Numbered landmarks (red points) represent the following features: 1 anterior tip of snout, 2 posterior tip of lower mandible, 3 and 4 anterior and posterior middle axis of the eye, 5 occiput, 6 anterior tip of opercular bone, 7 inferior edge of opercular bone, 8 point of maximal exertion of operculum, 9 antedorsal origin of opercle, 10 superior insertion of pectoral fin, 11 inferior insertion of pectoral fin, 12 anterior insertion of dorsal fin, 13 anterior insertion of the anal fin, 14 posterior insertion of the anal fin, 15 superior insertion of the caudal fin, 16 inferior insertion of the caudal fin, 17 superior tip of the caudal fin, 18 posterior central edge of the caudal fin, 19 inferior tip of the caudal fin. A number of semi‐landmarks were used, and these were placed between the fixed landmarks: (a) between landmarks 1 and 5 (n = 8); (b) between landmarks 5 and 12 (n = 15); (c) between the posterior edge of the dorsal fin and 15 (n = 10); (d), between 13 and 16 (n = 14); (e), between 7 and 13 (n = 17); f, between 2 and 7 (n = 8). The area shaded in yellow is indicative of the caudal peduncle in zebrafish
FIGURE 3
FIGURE 3
Visualization of body shape variation between high and low vulnerability trawl fish for females and males. Polygon outlines (of LMs) representative of low vulnerability fish (green) against high vulnerability fish (red) are shown in the middle (magnified to 7). Thin‐plate spline transformation grids (magnification set at 7) of the average Procrustes adjusted shape for high vulnerability (a, c) and low vulnerability (b, d) for each sex are also shown
FIGURE 4
FIGURE 4
Visualization of body shape variation between high and low vulnerability trap fish for females and males. Polygon outlines (of LMs) representative of low vulnerability fish (green) against high vulnerability fish (red) are shown in the middle (magnified to 7). Thin‐plate spline transformation grids (magnification set at 7) of the average Procrustes adjusted shape for high vulnerability (a, c) and low vulnerability (b, d) for each sex are also shown
FIGURE 5
FIGURE 5
Heat maps of local shape deformation for trawl fish: (a) are female (n = 55), and (b) are male (n = 56). Red hues are indicative of expansion between the mean shape of high vulnerability fish and the mean shape of low vulnerability fish, blue hues are indicative of contraction, and green hues are approximately invariant regions. Arrows, if present, show the direction of the expansion. For all plots magnification was set at four, and plot resolution at 7,000
FIGURE 6
FIGURE 6
Heat maps of local shape deformation for trap fish: (a) are female (n = 44), and (b) are male (n = 63). Red hues are indicative of expansion between the mean shape of high vulnerability fish and the mean shape of low vulnerability fish, blue hues are indicative of contraction, and green hues are approximately invariant regions. Arrows, if present, show the direction of the expansion. For all plots magnification was set at four, and plot resolution at 7,000
FIGURE 7
FIGURE 7
Shape disparity across sex, gear and vulnerability. (a) Shape disparity in trawl fish (n = 111) and trap fish (n = 107) (c); greens are low vulnerability individuals (LF = Low Female; LM = Low Male) and reds are indicative of high vulnerability individuals (HF = High Female; HM = High Male). Pairwise comparisons for trawl fish (b) and trap fish (d); red hue is indicative of higher disparity and white of lower disparity
FIGURE 8
FIGURE 8
Scaled mass index across gear types, with trawl fish on the left and trap fish on the right of the graph. Each dot is representative of a single fish, greens are low vulnerability individuals and reds are indicative of high vulnerability individuals. The boxplots indicate medians, 25th, and 75th percentile

References

    1. Adams, D. C. , & Otárola‐Castillo, E. (2013). Geomorph: An r package for the collection and analysis of geometric morphometric shape data. Methods in Ecology and Evolution, 4, 393–399.
    1. Allendorf, F. W. , & Hard, J. J. (2009). Human‐induced evolution caused by unnatural selection through harvest of wild animals. Proceedings of the National Academy of Sciences of the United States of America, 106, 9987–9994. 10.1073/pnas.0901069106 - DOI - PMC - PubMed
    1. Alós, J. , Palmer, M. , Linde‐Medina, M. , & Arlinghaus, R. (2014). Consistent size‐independent harvest selection on fish body shape in two recreationally exploited marine species. Ecology and Evolution, 4, 2154–2164. 10.1002/ece3.1075 - DOI - PMC - PubMed
    1. Alós, J. , Palmer, M. , Rosselló, R. , & Arlinghaus, R. (2016). Fast and behavior‐selective exploitation of a marine fish targeted by anglers. Scientific Reports, 6, 38093. 10.1038/srep38093 - DOI - PMC - PubMed
    1. Andersson, J. , Johansson, F. , & Söderlund, T. (2006). Interactions between predator‐ and diet‐induced phenotypic changes in body shape of crucian carp. Proceedings of the Royal Society B‐Biological Sciences, 273, 431–437. 10.1098/rspb.2005.3343 - DOI - PMC - PubMed

LinkOut - more resources