

Analysis of community deaths during the catastrophic 2021 heat dome: Early evidence to inform the public health response during subsequent events in greater Vancouver, Canada
- PMID: 35169667
- PMCID: PMC8835552
- DOI: 10.1097/EE9.0000000000000189
Analysis of community deaths during the catastrophic 2021 heat dome: Early evidence to inform the public health response during subsequent events in greater Vancouver, Canada
Abstract
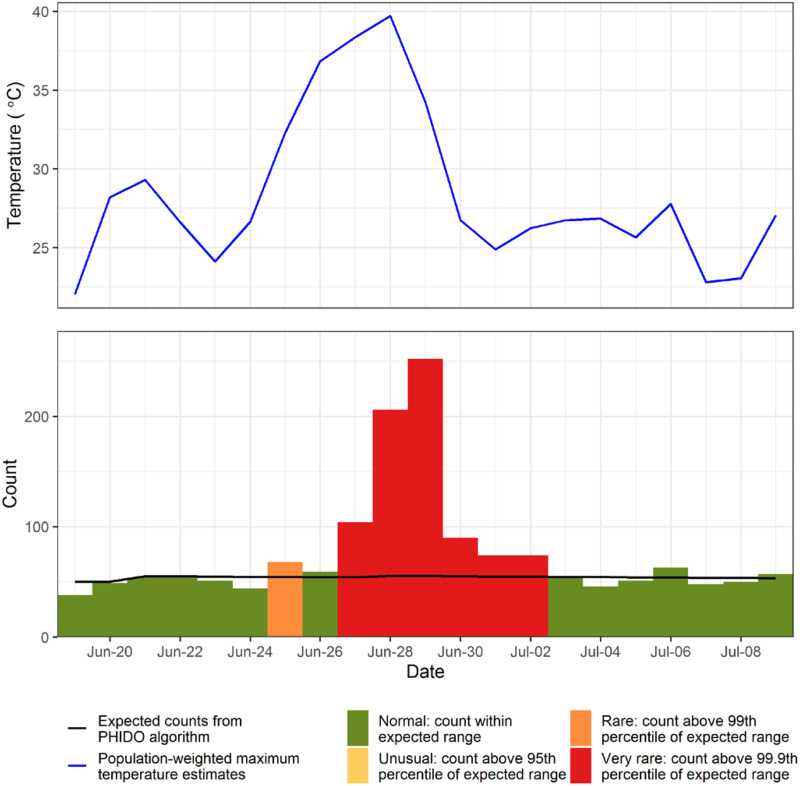
Background: British Columbia, Canada, was impacted by a record-setting heat dome in early summer 2021. Most households in greater Vancouver do not have air conditioning, and there was a 440% increase in community deaths during the event. Readily available data were analyzed to inform modifications to the public health response during subsequent events in summer 2021 and to guide further research.
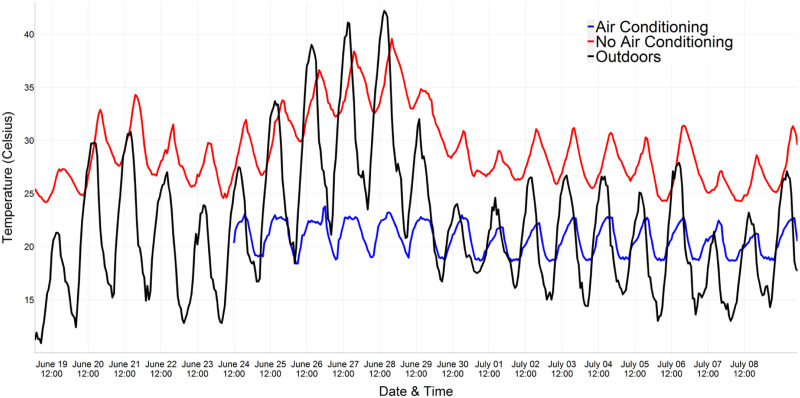
Methods: The 434 community deaths from 27 June through 02 July 2021 (heat dome deaths) were compared with all 1,367 community deaths that occurred in the same region from 19 June through 09 July of 2013-2020 (typical weather deaths). Conditional logistic regression was used to examine the effects of age, sex, neighborhood deprivation, and the surrounding environment. Data available from homes with and without air conditioning were also used to illustrate the indoor temperatures differences.
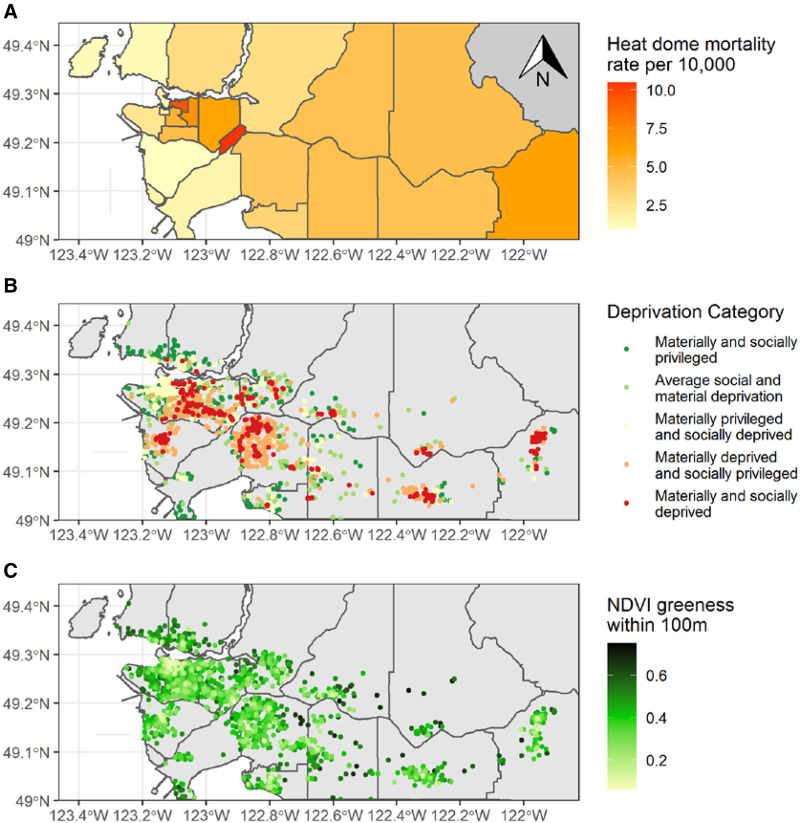
Results: A combined index of material and social deprivation was most predictive of heat dome risk, with an adjusted odds ratio of 2.88 [1.85, 4.49] for the most deprived category. Heat dome deaths also had lower greenness within 100 m than typical weather deaths. Indoor temperatures in one illustrative home without air conditioning ranged between 30°C and 40°C.
Conclusions: Risk of death during the heat dome was associated with deprivation, lower neighborhood greenness, older age, and sex. High indoor temperatures likely played an important role. Public health response should focus on highly deprived neighborhoods with low air conditioning prevalence during extreme heat events. Promotion of urban greenspace must continue as the climate changes.
Keywords: All-cause mortality; Greenness; Heat dome; Neighborhood deprivation; Urban heat island.
Copyright © 2022 The Authors. Published by Wolters Kluwer Health, Inc. on behalf of The Environmental Epidemiology. All rights reserved.
Conflict of interest statement
Funding for publication of this study was provided by the BC Climate Preparedness and Adaptation Strategy.
Figures
References
-
- Philip SY, Kew SF, van Oldenborgh GJ, et al. . Rapid attribution analysis of the extraordinary heatwave on the Pacific Coast of the US and Canada June 2021. Earth Syst Dynam Discuss. [preprint]. 10.5194/esd-2021-90, in review, 2021.1–37. - DOI
-
- BC Hydro. Cold comfort: The rising use (and cost) of air conditioning in B.C. Published online 2018. Accessed August 11, 2021. https://www.bchydro.com/content/dam/BCHydro/customer-portal/documents/ne....
-
- Lapointe L. Chief coroner’s statement on public safety during high temperatures. Published online 2021. Accessed August 7, 2021. https://www2.gov.bc.ca/assets/gov/birth-adoption-death-marriage-and-divo...
LinkOut - more resources
Full Text Sources