. 2022 Jan 11;3(1):tgac002.
doi: 10.1093/texcom/tgac002. eCollection 2022.

Different types of uncertainty distinguished by monkey prefrontal neurons

Affiliations

Different types of uncertainty distinguished by monkey prefrontal neurons

Madoka Matsumoto et al. Cereb Cortex Commun. .

Abstract

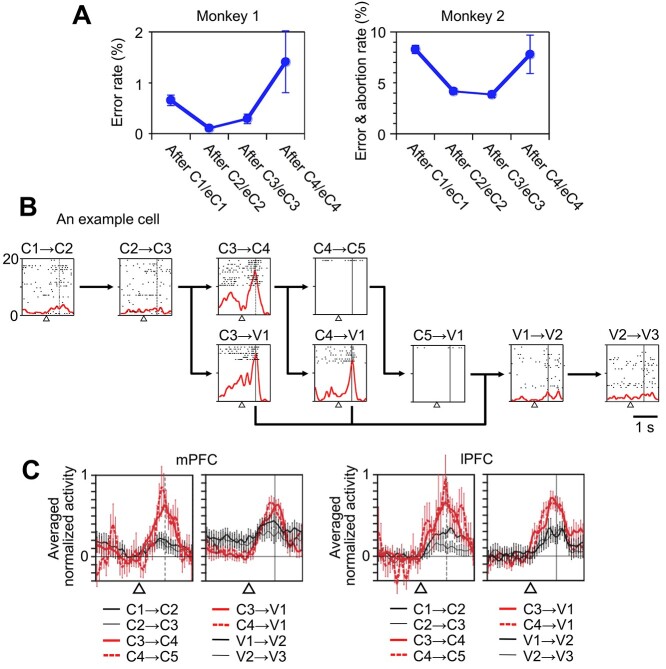
To adapt one's behavior, in a timely manner, to an environment that changes in many different aspects, one must be sensitive to uncertainty about each aspect of the environment. Although the medial prefrontal cortex has been implicated in the representation and reduction of a variety of uncertainties, it is unknown whether different types of uncertainty are distinguished by distinct neuronal populations. To investigate how the prefrontal cortex distinguishes between different types of uncertainty, we recorded neuronal activities from the medial and lateral prefrontal cortices of monkeys performing a visual feedback-based action-learning task in which uncertainty of coming feedback and that of context change varied asynchronously. We found that the activities of two groups of prefrontal cells represented the two different types of uncertainty. These results suggest that different types of uncertainty are represented by distinct neural populations in the prefrontal cortex.

Keywords: frontal lobe; medial prefrontal cortex; nonhuman primate; prediction error; single-unit recording.


Figures

Figure 1
Figure 1
Task design and behavioral results. (A) Trial transition diagram. The most frequent transitions among the trial types in visual and action-learning blocks are illustrated. V1, V2, and V3 are the first, second, and third trials of visual blocks, respectively. See the main text for the abbreviations of the trial types in action-learning blocks. (B) Event sequences in single trials of visual and action-learning blocks. Gray and pink shading indicate the preblock-transition and prefeedback periods, respectively, in which the activities associated with the uncertainty in block transition or the uncertainty in the nature of the coming feedback were measured. (C) Percentage of monkeys’ correct responses in trials 1–4 of action-learning blocks. Black lines, for blocks that started with a correct trial; red lines, for blocks that started with an error trial. Error bars indicate standard deviations across blocks.
Figure 2
Figure 2
Prefeedback activities in the mPFC and lPFC. (A, B) Activities in an example mPFC cell (A) and lPFC cell (B). (C, D) Activities in the mPFC cell population (C) and lPFC cell population (D). The bin width is 50 ms. The activity graphs are aligned with the onset of the fixation period (in the left of the short gaps) or with the onset of the visual feedback stimulus (in the right of the short gaps). The open triangles below the abscissa indicate the time when the monkey depressed the central lever and started to gaze at the fixation point. The filled triangles indicate the time when the monkey returned to the central lever. The vertical lines right to the filled triangles indicate the onset of the feedback. The activities in the trials with positive feedback stimuli are shown in red and those in the trials with negative feedback are shown in blue. For the population activities, the activity in each bin was subtracted by the averaged activity in the 400-ms window starting 100 ms after the start of gaze and central lever pressing in the C1/E1 trials, normalized by the peak activity in individual cells, and then averaged across cells. The error bars indicate the standard error of mean.
Figure 3
Figure 3
The prefeedback activities in the C1/E1 trials. (A) Averaged normalized prefeedback activities of the mPFC and lPFC cell populations in the 1st trial (C1 or E1) of the action-learning block. The activities were aligned at the onset of feedback (vertical line). The filled triangle indicates the time when the monkey returned to the central lever. (B) Cumulative distributions of the rising onset of the prefeedback activities in C1/E1 in the mPFC (black line) and lPFC (gray line).
Figure 4
Figure 4
Changes of the uncertainty of the coming feedback and the prefeedback activities along the course of action learning. (A, B) Changes of the standard deviation of feedback values (A), the expected values of absolute prediction errors (B). Note that the trial types are labeled as “first,” “after c,” “after cc,” “first,” “after e,” “after ec,” and “after ecc,” instead of C1, C2, C3, E1, eC1, eC2, and eC3, because the labeling is based on the past trials that had already occurred up to the point in time when the feedback was about to be given. (C, D) Changes of the prefeedback activities in the mPFC (C) and lPFC (D) cells with significant prefeedback activities in C1/E1. The prefeedback activities were normalized by the maximum activities in each cell and averaged across all the cells with significant prefeedback activities in C1/E1 recorded from each monkey. The error bars indicate the standard error of mean across cells.
Figure 5
Figure 5
Preblock-transition activities. (A) Performance deterioration in the later parts of the action-learning blocks. After C4 and eC4, the ratio of the erroneous responses in which the incorrect lever was chosen in the trials increased in Monkey 1 (left), and the ratio of trials in which either the incorrect lever was chosen or the trial was aborted by a fixation break or by an early central-lever release increased in Monkey 2 (right). The ratios were averaged over all recording sessions. The error bars indicate the standard error of mean across sessions. (B) Activities in an example mPFC cell that showed gradually increasing activity during the fixation period after C3, eC3, C4, and eC4, where a probabilistic transition from an action-learning block to a visual block occurred. C1 → C2 represents the transition from C1 to C2 or eC1 to eC2; C3 → V1 represents the transition from C3 or eC3 to V1, and so on. (C) Population activities of the cells with significant preblock-transition activities in the mPFC and lPFC during the fixation period. The activities that occurred when the block transition might occur are indicated in red. The activity in each bin was subtracted by the averaged activity in the 400-ms window immediately before the gaze fixation and central lever pressing started after C3, eC3, C4, and eC4 trials. The activity in each bin was normalized by the peak activity in each cell and then averaged across cells. The error bars indicate the standard error of mean across cells. In (B) and (C), the open triangles indicate the time when the monkey depressed the central lever and started to gaze at the fixation point, and the vertical solid (in B) and dashed (in C) lines indicate the expected or actual onset of the visual stimulus, respectively. The activity graphs are aligned with the onset of the fixation period.
Figure 6
Figure 6
Comparison between the magnitudes of prefeedback activities in C1/E1 and preblock-transition activities. (A) Scatterplot of preblock-transition activities (ordinate) against prefeedback activities (abscissa) in mPFC cells. The cells with significant prefeedback activities alone, those with significant preblock-transition activities alone, and those with both significant prefeedback and preblock-transition activities are plotted by blue, green, and red circles, respectively. The prefeedback activities were subtracted by the initial fixation-period activity in the 400-ms window (100–500 ms after gazing at the fixation point started) in C1/E1 trials. The preblock-transition activities were subtracted by the averaged baseline activity in the 400-ms window immediately before the gaze fixation and the central lever pressing started after C3, eC3, C4, and eC4 trials. (B) Scatterplot of the preblock-transition activities against prefeedback activities in lPFC cells. (C, D) The distribution of the argument angle of each cell’s vector. The bin width of 18° was determined using the Freedman–Diaconis rule for the mPFC histogram (C) and was also applied to the lPFC histogram (D) to match them.
Figure 7
Figure 7
Distribution of cells with different types of activities. (A, B) The positions of the mPFC (dotted lines) and lPFC (solid ellipse) recordings in Monkey 1 (A) and Monkey 2 (B) shown on the top view of the brain. PS, principal sulcus; AS, arcuate sulcus. (C, D) Pie charts indicating the numbers and proportions, in individual electrode penetration positions, of the cells with significant prefeedback activities in C1/E1 (prefeedback), cells with significant preblock-transition activities (preblock-transition), cells responding to the feedback in action-learning blocks (feedback), and cells responding to the first appearance of visual stimulus in visual blocks (first stimulus). The cells responding to the feedback are divided into those representing the positive value of feedback (positive), those representing the negative value of feedback (negative), and those representing the absolute value of feedback (absolute value). + indicates the penetrations in which none of these activities was observed in recorded cells.
Figure 8
Figure 8
Layer distributions of cells with different types of activities in the mPFC. The y-axis indicates the distance of the recording position from the white matter-gray matter (W/G) boundary normalized by the total thickness of the gray matter, both along the penetration in red shaded area of mPFC section shown at leftmost; 0 indicates the W/G boundary of the deep layer (upper dashed line from the mPFC section) and 1 indicates the border of the superficial layer closest to the cingulate sulcus (lower dashed line from the mPFC section). The rightmost histogram indicates the number of cells that showed none of the activities. CS, cingulate sulcus.

Similar articles

References

    1. Arnsten AF, Goldman-Rakic PS. Selective prefrontal cortical projections to the region of the locus coeruleus and raphe nuclei in the rhesus monkey. Brain Res. 1984:306:9–18. - PubMed
    1. Aron AR, Shohamy D, Clark J, Myers C, Gluck MA, Poldrack RA. Human midbrain sensitivity to cognitive feedback and uncertainty during classification learning. J Neurophysiol. 2004:92:1144–1152. - PubMed
    1. Aston-Jones G, Cohen JD. An integrative theory of locus coeruleus-norepinephrine function: adaptive gain and optimal performance. Annu Rev Neurosci. 2005:28:403–450. - PubMed
    1. Bach DR, Dolan RJ. Knowing how much you don't know: a neural organization of uncertainty estimates. Nat Rev Neurosci. 2012:13:572–586. - PubMed
    1. Badre D, Nee DE. Frontal cortex and the hierarchical control of behavior. Trends Cogn Sci. 2018:22:170–188. - PMC - PubMed

LinkOut - more resources