

This is a preprint.
Interactions among 17 respiratory pathogens: a cross-sectional study using clinical and community surveillance data
- PMID: 35169816
- PMCID: PMC8845514
- DOI: 10.1101/2022.02.04.22270474
Interactions among 17 respiratory pathogens: a cross-sectional study using clinical and community surveillance data
Abstract
Background: Co-circulating respiratory pathogens can interfere with or promote each other, leading to important effects on disease epidemiology. Estimating the magnitude of pathogen-pathogen interactions from clinical specimens is challenging because sampling from symptomatic individuals can create biased estimates.
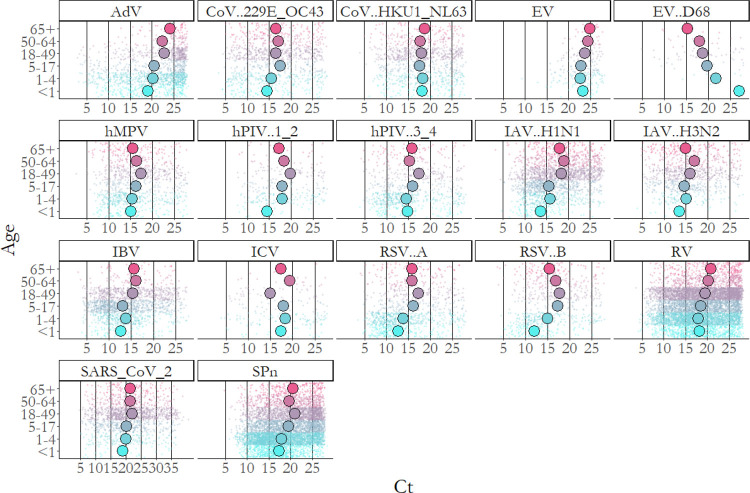
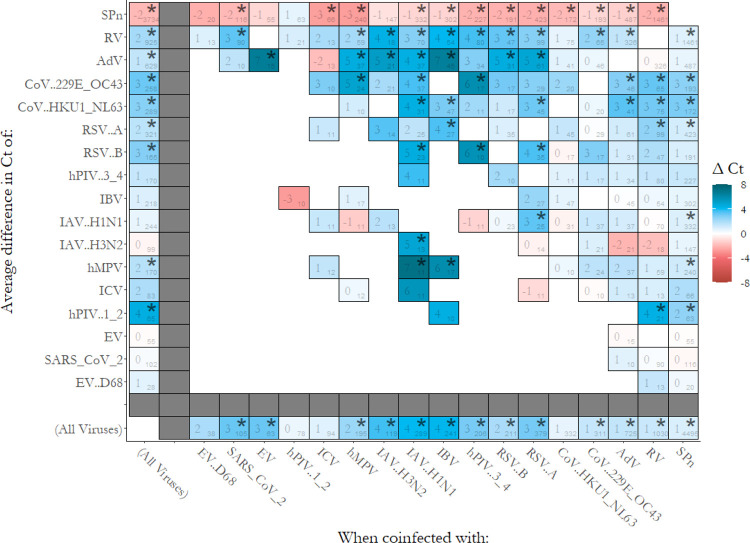
Methods: We conducted an observational, cross-sectional study using samples collected by the Seattle Flu Study between 11 November 2018 and 20 August 2021. Samples that tested positive via RT-qPCR for at least one of 17 potential respiratory pathogens were included in this study. Semi-quantitative cycle threshold (Ct) values were used to measure pathogen load. Differences in pathogen load between monoinfected and coinfected samples were assessed using linear regression adjusting for age, season, and recruitment channel.
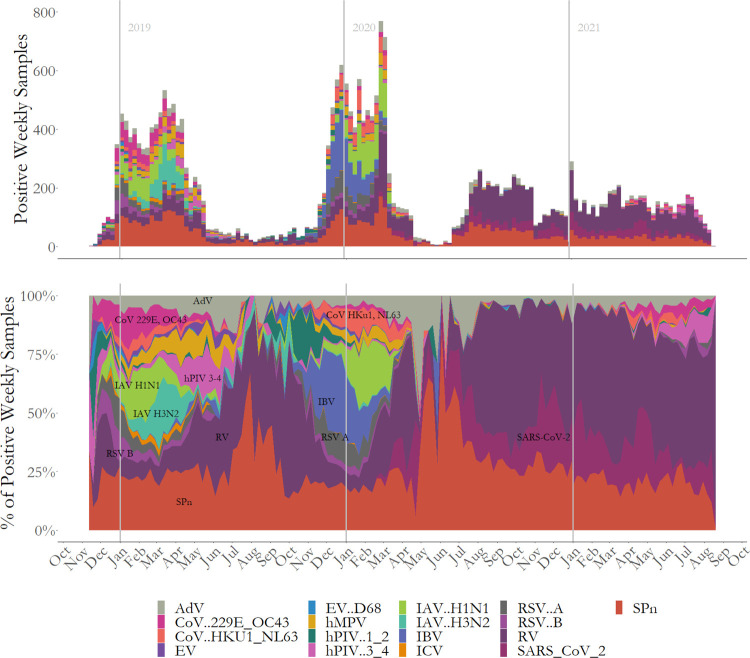
Results: 21,686 samples were positive for at least one potential pathogen. Most prevalent were rhinovirus (33·5%), Streptococcus pneumoniae (SPn, 29·0%), SARS-CoV-2 (13.8%) and influenza A/H1N1 (9·6%). 140 potential pathogen pairs were included for analysis, and 56 (40%) pairs yielded significant Ct differences (p < 0.01) between monoinfected and co-infected samples. We observed no virus-virus pairs showing evidence of significant facilitating interactions, and found significant viral load decrease among 37 of 108 (34%) assessed pairs. Samples positive with SPn and a virus were consistently associated with increased SPn load.
Conclusions: Viral load data can be used to overcome sampling bias in studies of pathogen-pathogen interactions. When applied to respiratory pathogens, we found evidence of viral-SPn facilitation and several examples of viral-viral interference. Multipathogen surveillance is a cost-efficient data collection approach, with added clinical and epidemiological informational value over single-pathogen testing, but requires careful analysis to mitigate selection bias.
Figures
Similar articles
-
Etiological and epidemiological characteristics of severe acute respiratory infection caused by multiple viruses and Mycoplasma pneumoniae in adult patients in Jinshan, Shanghai: A pilot hospital-based surveillance study.PLoS One. 2021 Mar 22;16(3):e0248750. doi: 10.1371/journal.pone.0248750. eCollection 2021. PLoS One. 2021. PMID: 33750952 Free PMC article.
-
Effectiveness and cost-effectiveness of four different strategies for SARS-CoV-2 surveillance in the general population (CoV-Surv Study): a structured summary of a study protocol for a cluster-randomised, two-factorial controlled trial.Trials. 2021 Jan 8;22(1):39. doi: 10.1186/s13063-020-04982-z. Trials. 2021. PMID: 33419461 Free PMC article.
-
Nasal host response-based screening for undiagnosed respiratory viruses: a pathogen surveillance and detection study.Lancet Microbe. 2023 Jan;4(1):e38-e46. doi: 10.1016/S2666-5247(22)00296-8. Lancet Microbe. 2023. PMID: 36586415 Free PMC article.
-
Peritonsillar abscess: clinical aspects of microbiology, risk factors, and the association with parapharyngeal abscess.Dan Med J. 2017 Mar;64(3):B5333. Dan Med J. 2017. PMID: 28260599 Review.
-
Accuracy of rapid point-of-care antigen-based diagnostics for SARS-CoV-2: An updated systematic review and meta-analysis with meta-regression analyzing influencing factors.PLoS Med. 2022 May 26;19(5):e1004011. doi: 10.1371/journal.pmed.1004011. eCollection 2022 May. PLoS Med. 2022. PMID: 35617375 Free PMC article.
Cited by
-
Clinical significance and role of coinfections with respiratory pathogens among individuals with confirmed severe acute respiratory syndrome coronavirus-2 infection.Front Public Health. 2022 Sep 2;10:959319. doi: 10.3389/fpubh.2022.959319. eCollection 2022. Front Public Health. 2022. PMID: 36117597 Free PMC article.
References
Publication types
Grants and funding
LinkOut - more resources
Full Text Sources
Miscellaneous