

Full-Likelihood Genomic Analysis Clarifies a Complex History of Species Divergence and Introgression: The Example of the erato-sara Group of Heliconius Butterflies
- PMID: 35169847
- PMCID: PMC9366460
- DOI: 10.1093/sysbio/syac009
Full-Likelihood Genomic Analysis Clarifies a Complex History of Species Divergence and Introgression: The Example of the erato-sara Group of Heliconius Butterflies
Abstract
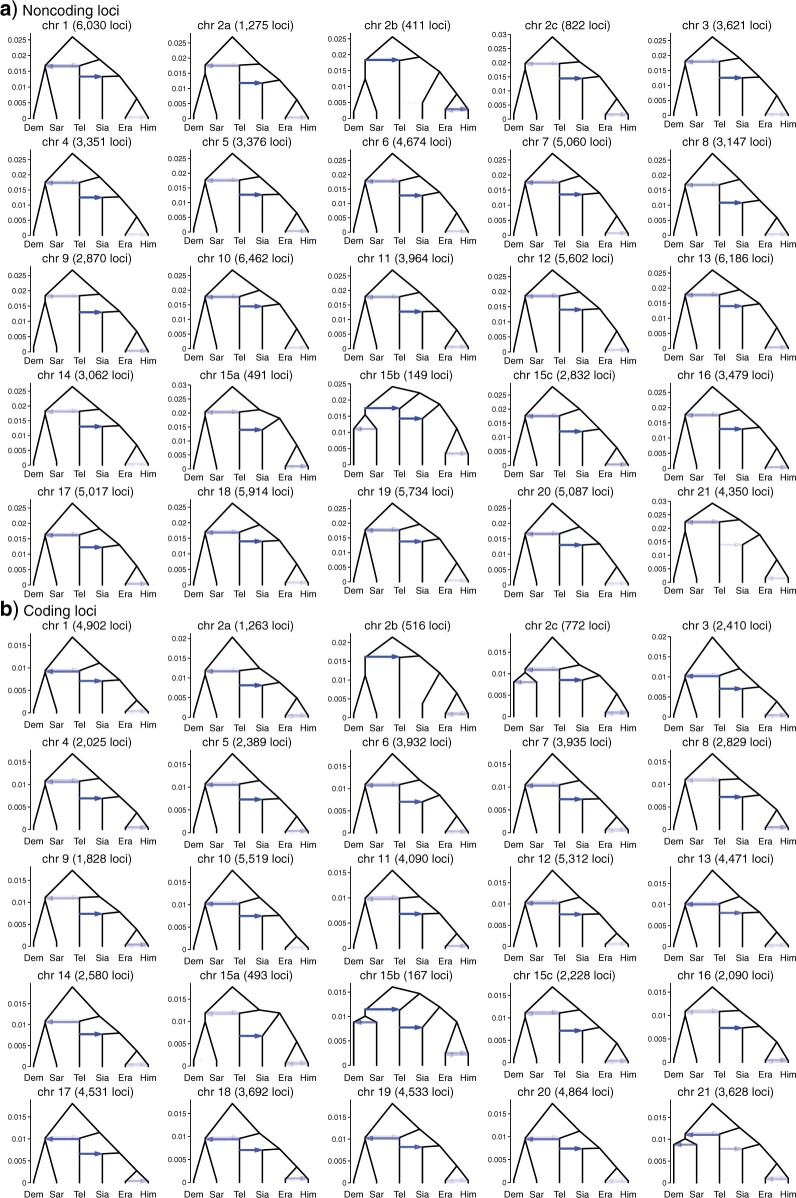
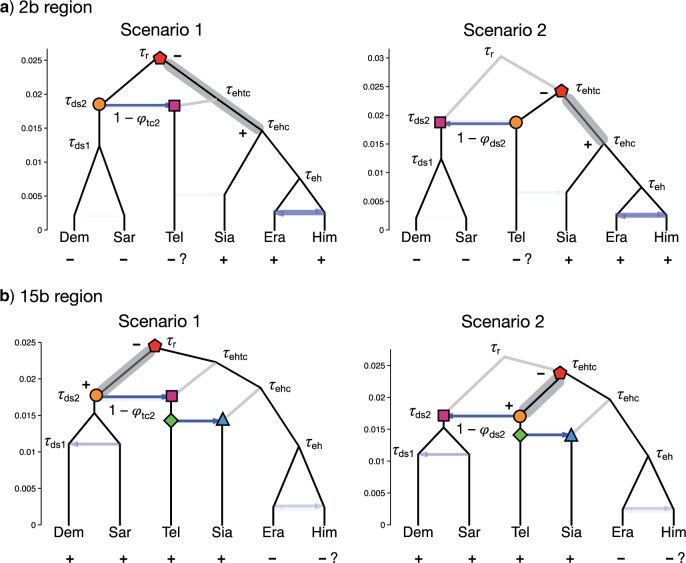
Introgressive hybridization plays a key role in adaptive evolution and species diversification in many groups of species. However, frequent hybridization and gene flow between species make estimation of the species phylogeny and key population parameters challenging. Here, we show that by accounting for phasing and using full-likelihood methods, introgression histories and population parameters can be estimated reliably from whole-genome sequence data. We employ the multispecies coalescent (MSC) model with and without gene flow to infer the species phylogeny and cross-species introgression events using genomic data from six members of the erato-sara clade of Heliconius butterflies. The methods naturally accommodate random fluctuations in genealogical history across the genome due to deep coalescence. To avoid heterozygote phasing errors in haploid sequences commonly produced by genome assembly methods, we process and compile unphased diploid sequence alignments and use analytical methods to average over uncertainties in heterozygote phase resolution. There is robust evidence for introgression across the genome, both among distantly related species deep in the phylogeny and between sister species in shallow parts of the tree. We obtain chromosome-specific estimates of key population parameters such as introgression directions, times and probabilities, as well as species divergence times and population sizes for modern and ancestral species. We confirm ancestral gene flow between the sara clade and an ancestral population of Heliconius telesiphe, a likely hybrid speciation origin for Heliconius hecalesia, and gene flow between the sister species Heliconius erato and Heliconius himera. Inferred introgression among ancestral species also explains the history of two chromosomal inversions deep in the phylogeny of the group. This study illustrates how a full-likelihood approach based on the MSC makes it possible to extract rich historical information of species divergence and gene flow from genomic data. [3s; bpp; gene flow; Heliconius; hybrid speciation; introgression; inversion; multispecies coalescent].
© The Author(s) 2022. Published by Oxford University Press, on behalf of the Society of Systematic Biologists.
Figures
Similar articles
-
Major patterns in the introgression history of Heliconius butterflies.Elife. 2023 Dec 18;12:RP90656. doi: 10.7554/eLife.90656. Elife. 2023. PMID: 38108819 Free PMC article.
-
Inferring the Direction of Introgression Using Genomic Sequence Data.Mol Biol Evol. 2023 Aug 3;40(8):msad178. doi: 10.1093/molbev/msad178. Mol Biol Evol. 2023. PMID: 37552932 Free PMC article.
-
A hybrid zone provides evidence for incipient ecological speciation in Heliconius butterflies.Mol Ecol. 2008 Nov;17(21):4699-712. doi: 10.1111/j.1365-294X.2008.03934.x. Epub 2008 Sep 30. Mol Ecol. 2008. PMID: 18828780
-
Introgression of wing pattern alleles and speciation via homoploid hybridization in Heliconius butterflies: a review of evidence from the genome.Proc Biol Sci. 2012 Dec 12;280(1752):20122302. doi: 10.1098/rspb.2012.2302. Print 2013 Feb 7. Proc Biol Sci. 2012. PMID: 23235702 Free PMC article. Review.
-
Review. Hybrid trait speciation and Heliconius butterflies.Philos Trans R Soc Lond B Biol Sci. 2008 Sep 27;363(1506):3047-54. doi: 10.1098/rstb.2008.0065. Philos Trans R Soc Lond B Biol Sci. 2008. PMID: 18579480 Free PMC article. Review.
Cited by
-
The puzzle of plant hybridisation: a high propensity to hybridise but few hybrid zones reported.Heredity (Edinb). 2023 Dec;131(5-6):307-315. doi: 10.1038/s41437-023-00654-1. Epub 2023 Oct 27. Heredity (Edinb). 2023. PMID: 37884616 Free PMC article. Review.
-
Toward telomere-to-telomere cat genomes for precision medicine and conservation biology.Genome Res. 2024 Jun 25;34(5):655-664. doi: 10.1101/gr.278546.123. Genome Res. 2024. PMID: 38849156 Free PMC article. Review.
-
Evolutionary déjà vu? A case of convergent evolution in an ant-plant association.Proc Biol Sci. 2024 Jul;291(2026):20241214. doi: 10.1098/rspb.2024.1214. Epub 2024 Jul 10. Proc Biol Sci. 2024. PMID: 38981524 Free PMC article.
-
Estimation of species divergence times in presence of cross-species gene flow.Syst Biol. 2023 Aug 7;72(4):820-836. doi: 10.1093/sysbio/syad015. Syst Biol. 2023. PMID: 36961245 Free PMC article.
-
Evolutionary dynamics of genome size and content during the adaptive radiation of Heliconiini butterflies.Nat Commun. 2023 Sep 12;14(1):5620. doi: 10.1038/s41467-023-41412-5. Nat Commun. 2023. PMID: 37699868 Free PMC article.
References
-
- Barton N.H. 2006. Evolutionary biology: how did the human species form? Curr. Biol. 16(16):R647–R650. - PubMed
-
- Bates H.W. 1862. Contributions to an insect fauna of the Amazon Valley. Lepidoptera: Heliconinæ. Trans. Linn. Soc. Lond. 23:495–566.
-
- Beltrán M., Jiggins C.D., Brower A.V.Z., Bermingham E., Mallet J.. 2007. Do pollen feeding, pupal-mating and larval gregariousness have a single origin in Heliconius butterflies? Inferences from multilocus DNA sequence data. Biol. J. Linn. Soc. 92(2):221–239.
-
- Beltrán M., Jiggins C.D., Bull V., Linares M., Mallet J., McMillan W.O., Bermingham E.. 2002. Phylogenetic discordance at the species boundary: comparative gene genealogies among rapidly radiating Heliconius butterflies. Mol. Biol. Evol. 19(12):2176–2190. - PubMed
