

Estimating the Cost of Industry Investment in Drug Research and Development: A Review of Methods and Results
- PMID: 35170336
- PMCID: PMC8855407
- DOI: 10.1177/00469580211059731
Estimating the Cost of Industry Investment in Drug Research and Development: A Review of Methods and Results
Abstract
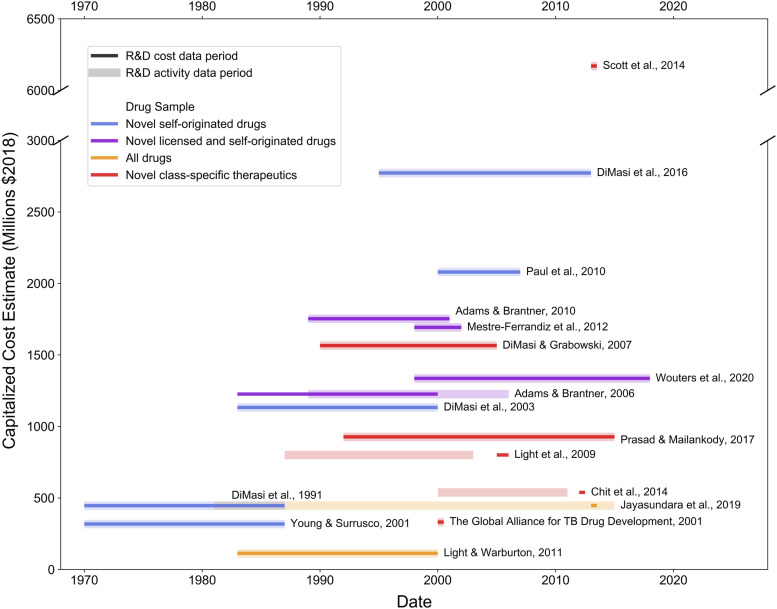
Research and development (R&D) costs factor into considerations of the tradeoffs between prices, intellectual property protection, and incentivizing innovation, all of which can have implications for policy development. Yet, there is little consensus on the actual cost of R&D for new drugs. We review and synthesize papers estimating drug R&D costs incurred by industry. We find a substantial range of per-drug costs, from $113 million to just over $6 billion in 2018 dollars. This range includes estimates covering all new drugs, new molecular entities, and drugs in specific therapeutic classes. The range is narrower-$318 million to $2.8 billion-for estimates of the per-drug cost for new molecular entities. We discuss the data sources, methods, and assumptions used in each study to provide context for the wide range in existing estimates. Differences in definitions, methods, and assumptions lead to large divergences in the main estimates, and the combination of fragmented data sources and different assumptions across studies means that the resulting estimates that can rarely be directly compared. We suggest areas for future research and data collection that would result in more comparable and robust estimates to inform ongoing policy discussion.
Keywords: Drug costs; data collection methods; industry; pharmaceutical preparations; policy making; prescription drugs; research.
Conflict of interest statement
Figures
References
-
- Arrow K, for U-NBC, Economic Research . Economic welfare and the allocation of resources for invention. In: The Rate and Direction of Inventive Activity: Economic and Social Factors. Princeton, NJ, USA: Princeton University Press; 1962:609-626.
-
- Nordhaus W. The Optimal Life of a Patent; 1967. Cowles Foundation Discussion Papers https://ideas.repec.org/p/cwl/cwldpp/241.html
-
- Winter SG. The logic of appropriability: from schumpeter to arrow to teece. Res Pol. 2006;35(8):1100-1106. doi: 10.1016/j.respol.2006.09.010 - DOI
-
- Elijah E. Cummings lower drug costs now act, HR.3, 117th Congress (2021-2022); 2020.https://ideas.repec.org/p/cwl/cwldpp/241.html
-
- Putting America First . Executive Order on Lowering Drug Prices. Exec. Order No. 13948, 85 FR 59649. Putting America First. https://www.federalregister.gov/documents/2020/09/23/2020-21129/lowering... (2020).
Publication types
MeSH terms
LinkOut - more resources
Full Text Sources
