

Compound heterozygous variants in OTULIN are associated with fulminant atypical late-onset ORAS
- PMID: 35170849
- PMCID: PMC8899767
- DOI: 10.15252/emmm.202114901
Compound heterozygous variants in OTULIN are associated with fulminant atypical late-onset ORAS
Abstract
Autoinflammatory diseases are a heterogenous group of disorders defined by fever and systemic inflammation suggesting involvement of genes regulating innate immune responses. Patients with homozygous loss-of-function variants in the OTU-deubiquitinase OTULIN suffer from neonatal-onset OTULIN-related autoinflammatory syndrome (ORAS) characterized by fever, panniculitis, diarrhea, and arthritis. Here, we describe an atypical form of ORAS with distinct clinical manifestation of the disease caused by two new compound heterozygous variants (c.258G>A (p.M86I)/c.500G>C (p.W167S)) in the OTULIN gene in a 7-year-old affected by a life-threatening autoinflammatory episode with sterile abscess formation. On the molecular level, we find binding of OTULIN to linear ubiquitin to be compromised by both variants; however, protein stability and catalytic activity is most affected by OTULIN variant p.W167S. These molecular changes together lead to increased levels of linear ubiquitin linkages in patient-derived cells triggering the disease. Our data indicate that the spectrum of ORAS patients is more diverse than previously thought and, thus, supposedly asymptomatic individuals might also be affected. Based on our results, we propose to subdivide the ORAS into classical and atypical entities.
Keywords: LUBAC; ORAS; OTULIN; autoinflammation; linear ubiquitin.
© 2022 The Authors. Published under the terms of the CC BY 4.0 license.
Figures
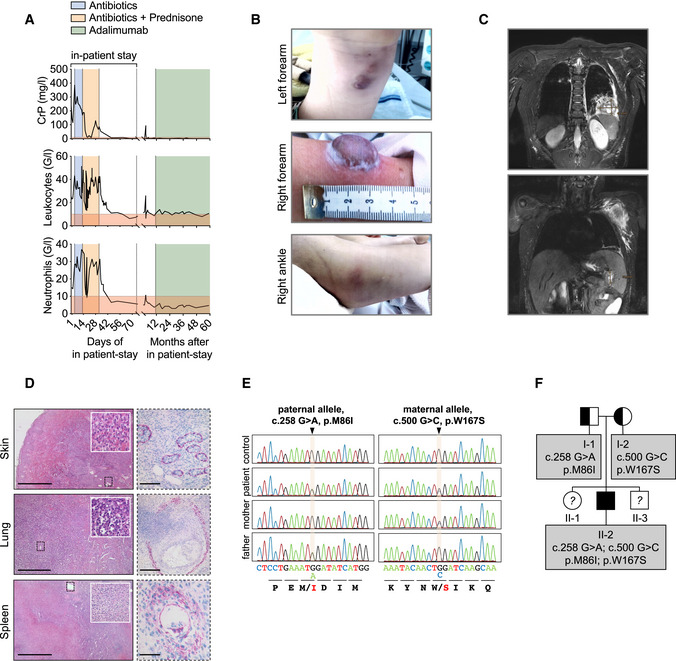
Blood parameters of patient are depicted.
Patient’s skin alterations are depicted.
T2‐weighted MR images in coronal plane show abscess formation in the left lower pulmonary lobe (upper panel) and in spleen and left axilla (lower panel).
Histological sections of patient biopsies stained with hematoxylin and eosin (left panel) or with an actin antibody (right panel). Scale bars: skin: left 1,000 µm, right 100 µm; lung: left 500 µm, right 250 µm; spleen: left 1,000 µm, right 75 µm.
Whole Exome Sequencing (WES) and targeted Sanger sequencing identified compound heterozygous variants in OTULIN at position c.258 G > A, p.M86I on the paternal allele and at position c.500 G > C, p.W167S on the maternal allele.
The pedigree is depicted. The patient (II‐2) is the second child of non‐consanguineous parents.
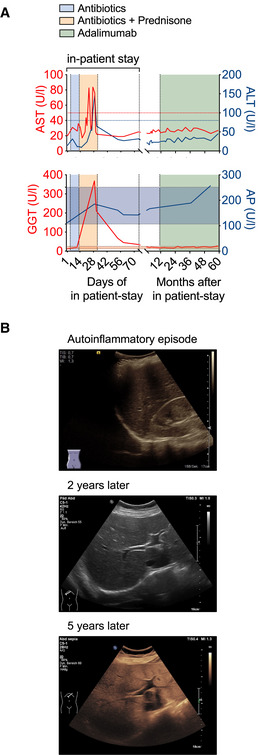
The course of the patient’s liver enzymes AST (aspartate transaminase) and ALT (alanine transaminase) (upper panel) or GGT (γ‐glutamyltransferase) and AP (alkaline phosphatase) (lower panel) are depicted along the time axis with the upper limit of normal indicated by red and blue lines for AST and ALT and the normal range in shades of red and blue for GGT and AP, respectively.
Liver ultrasound B‐mode images of the patient during the initial phase of autoinflammation and about 2 and 5 years thereafter display diffuse increase of liver echogenicity and finally slightly impaired appearance of portal vein wall and diaphragm indicative of steatosis hepatis grade II.

OTULIN protein is depicted.
OTULIN antibodies by Abcam (antigen corresponding to AA 60–158) or by Cell Signaling (recombinant fragment surrounds S76 without spanning M86) were tested in parallel on A549 OTULIN KO cells transfected with different OTULIN constructs as indicated. One representative of two independent experiments is shown.
Relative mRNA expression of OTULIN in fibroblasts and B cells with two different primer pairs is depicted. Data are presented as mean ± SD of six independent experiments; dots represent individual experiments performed in three technical replicates; ns, non‐significant, unpaired t‐test.
A549 OTULIN KO cells were transfected with the different OTULIN constructs as indicated. The following day, cells were treated with 50 µg/ml cycloheximide (CHX) for the indicated times, harvested and analyzed by Western blot for OTULIN protein expression. Tubulin served as loading control. One representative of three independent experiments is shown.
A549 OTULIN KO cells were transfected with the different OTULIN constructs as indicated. The following day, cells were treated with 50 µg/ml CHX alone or in combination with 1 µM Bortezomib (BTZ) or 1 µM Bafilomycin A1 (Baf A1) for 8 h or left untreated (DMSO). Expression of the proteins indicated was analyzed by Western blot. One representative of three independent experiments is shown.
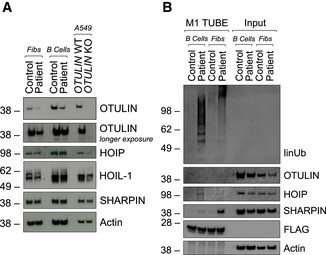
Expression of indicated proteins was determined by Western blot in patient‐derived and control fibroblasts and B cells and A549 OTULIN WT and KO cells.
FLAG‐tagged tandem ubiquitin binding entity (TUBE) assay was performed to pull down linear ubiquitin linkages in patient‐derived and control fibroblasts and B cells. One representative (A, B) out of three independent experiments is shown.

The overall structure of OTULINWT (3ZNV) is depicted with its catalytic triad (C129, H339, N341; pale cyan) and positions of variants identified in this study (M86, W167).
Close‐up of M86 (wheat) and M86I (pale green) with the interaction network around OTULIN’s catalytic center.
Close‐up of OTULINC129A and its interaction with the proximal ubiquitin (Ub). M86, Y91, E95, and R122 of OTULIN and their interaction with each other and with the F4 patch of the proximal Ub are depicted. Interactions (dotted red lines) and water molecules (light blue) < 5 Å are shown. Residues of the catalytic triad (A129, H339, N341) in pale cyan.
OTULINW167S in complex with di‐Ub. Contact sites of W167 (L237, I241, L273, and R274) in pale yellow. Positions of known homozygous OTULIN substitutions (Y244, L272, G281) in pale green. I44 patch of distal Ub in magenta and its contact sites L259, A262, and R263 in pale yellow. Close‐up of W167 and S167: loss of size and gain of polarity from W to S.
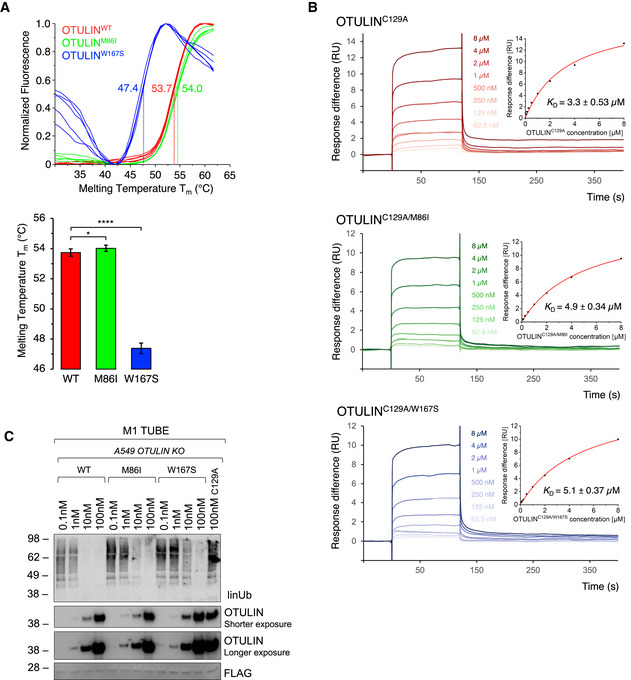
DSF measurements with OTULINWT, OTULINM86I, or OTULINW167S. Melting temperatures (T m ) are calculated from five independent experiments with standard deviations. *P = 0.011; ****P = 6.64 × 10⁻¹⁸, unpaired t‐test.
SPR measurements and steady‐state binding curves with calculated dissociation constants (Kd ) after injection of a concentration series of OTULINC129A, OTULINC129A/M86I, or OTULINC129A/W167S to CM5‐immobilized di‐ubiquitin chains.
Linear ubiquitin linkages isolated from A549 OTULIN KO cells by M1 TUBE assay were incubated with increasing concentrations of recombinant OTULINWT, OTULINM86I, and OTULINW167S or catalytically inactive OTULINC129A as control for 1 h. Afterward, samples were subjected to analysis by Western blot for the indicated proteins. Images are representative of three independent experiments.

- A–C
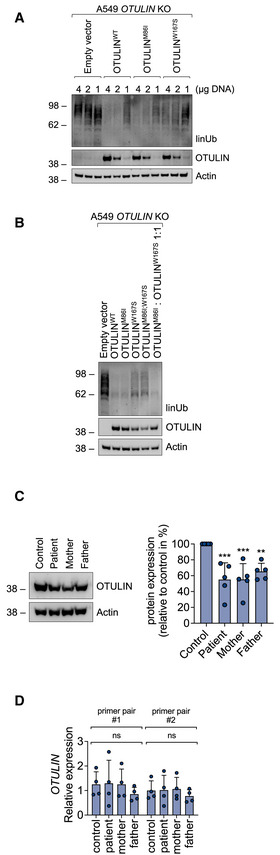
A549 OTULIN KO cells were transfected with empty vector or different OTULIN constructs as indicated and analyzed by Western blot.
- D
FLAG‐tagged tandem ubiquitin binding entity (TUBE) assay was performed in B cells from control, patient, mother, and father to pull down linear ubiquitin linkages. One representative (A–D) of three independent experiments is shown.
- A, B
A549 OTULIN KO cells were transfected with different OTULIN constructs as indicated. After 24 h, cells were lysed and subjected to analysis by Western blot. One representative of three independent experiments is shown.
- C
OTULIN protein expression in B cells derived from control, patient, mother, and father is shown. Blots (left panel) are representative of five independent experiments analyzed by densitometry (right panel). Data are presented as mean ± SD (dots represent individual experiments); ***P = 0.0008, **P = 0.0069, ordinary one‐way ANOVA, Dunnett’s multiple comparisons test.
- D
Relative mRNA expression of OTULIN in B cells derived from control, patient, mother, and father determined with two different primer pairs is depicted. Data are presented as mean ± SD of four independent experiments; dots represent individual experiments performed in three technical replicates; ns, non‐significant, ordinary one‐way ANOVA, Dunnett’s multiple comparisons test.
- A–D
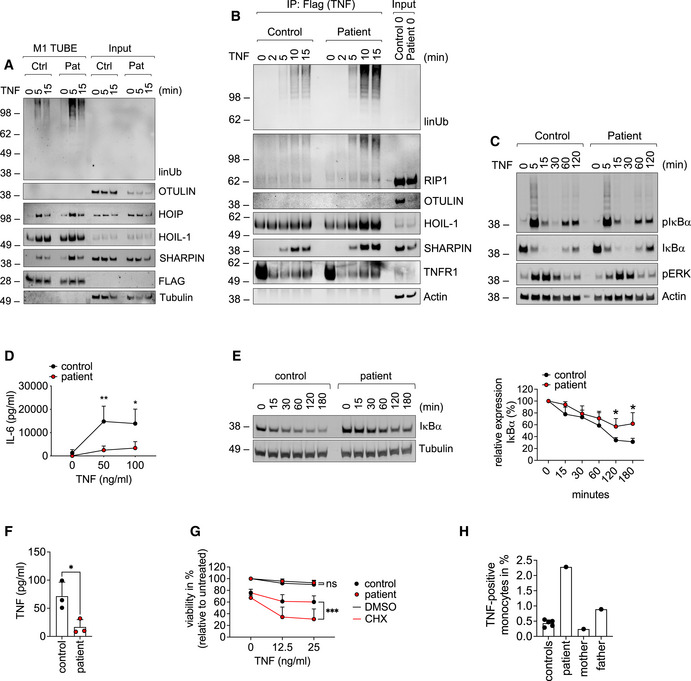
Patient‐derived and control fibroblasts were used. (A) FLAG‐tagged tandem ubiquitin binding entity (TUBE) assay was performed to pull down linear ubiquitin linkages upon stimulation with 500 ng/ml TNF. (B) The TNFR1‐SC was isolated using 500 ng/ml TAP‐TNF. (C) Cells were stimulated with 100 ng/ml TNF for the indicated times and analyzed by Western blot. One representative (A–C) of three independent experiments is shown. (D) Cells were stimulated with TNF for 24 h and IL‐6 was determined by ELISA. Data are presented as mean ± SD of three individual experiments performed in two technical replicates; *P = 0.014; **P = 0.007; multiple t‐test corrected for multiple comparisons using the Holm–Sidak method.
- E
B cells were incubated with 50 µg/ml cycloheximide (CHX) for the indicated times and subjected to analysis by Western blot. One representative (left panel) out of 4 individual experiments analyzed by densitometry (right panel) is shown. Data are presented as mean ± SD. *P = 0.02, unpaired t‐test.
- F
Patient‐derived and control B cells were cultivated for 24 h and TNF was determined by ELISA. Data are presented as mean ± SD of 3 individual experiments performed in two technical replicates; *P = 0.028; unpaired t‐test.
- G
Fibroblasts were incubated with 50 µg/ml cycloheximide (CHX) or DMSO and stimulated with TNF as indicated. Viability was measured after 24 h. Data are presented as mean ± SD of 5 individual experiments performed in three technical replicates; ***P = 0.0008, mixed‐effects analysis with Tukey’s multiple comparisons test.
- H
Intracellular TNF in CD11b‐positive cells from five healthy controls, patient (before anti‐TNF treatment), mother, and father was determined by FACS.
- A
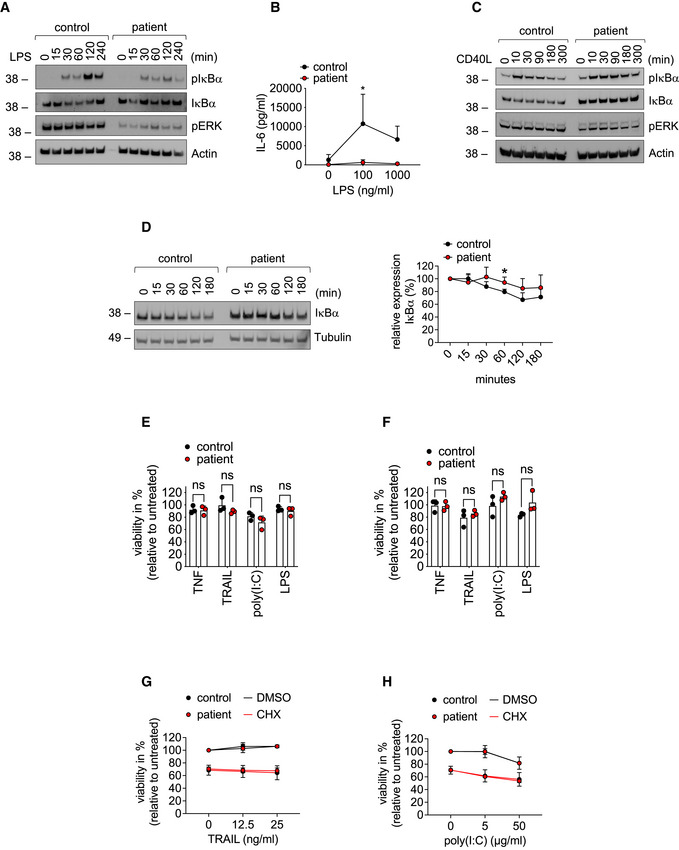
Fibroblasts were stimulated with 1 µg/ml LPS for the indicated times and subjected to analysis by Western blot. One representative out of three independent experiments is shown.
- B
Fibroblasts were stimulated with LPS for 24 h. Concentration of IL‐6 in the supernatant was determined by ELISA. Data are presented as mean ± SD of three individual experiments performed in two technical replicates; *P = 0.012; multiple t‐tests corrected for multiple comparisons using the Holm–Sidak method.
- C
B cells were treated with 100 ng/ml CD40L for the indicated times and subjected to analysis by Western blot. One representative out of three independent experiments is shown.
- D
Fibroblasts were incubated with 50 µg/ml cycloheximide (CHX) for the indicated times and subjected to analysis by western blot. One representative (left panel) out of 4 individual experiments analyzed by densitometry (right panel) is shown. Data are presented as mean ± SD. *P = 0.02, unpaired t‐test.
- E, F
Fibroblasts (E) or B cells (F) were treated with 0.1 µg/ml TNF, 0.1 µg/ml TRAIL, 100 µg/ml poly(I:C), 1 µg/ml LPS or left untreated, and viability was determined after 24 h. Data are presented as mean ± SD of three independent experiments; dots represent individual experiments performed in three technical replicates; ns, non‐significant, unpaired t‐test.
- G, H
Fibroblasts were incubated with 50 µg/ml cycloheximide (CHX) or DMSO and stimulated with the indicated concentrations of TRAIL (G) or poly(I:C) (H). Viability was measured after 24 h. Data are presented as mean ± SD of three individual experiments performed in three technical replicates.
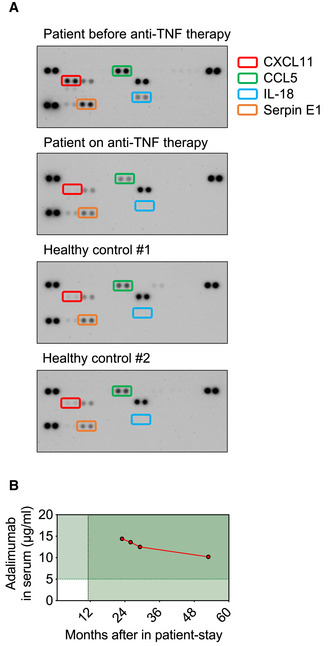
Plasma was collected from the patient before and after start of therapy with the anti‐TNF therapeutic Adalimumab. Plasma from two healthy controls was used as comparison. The Proteome Profiler Human Cytokine Array was performed according to the manufacturer’s instructions.
The concentration of Adalimumab in the patient’s serum is shown (target concentration: > 5 µg/ml).
References
Publication types
MeSH terms
Substances
Grants and funding
LinkOut - more resources
Full Text Sources
Molecular Biology Databases
Research Materials
