. 2022 Feb 16;14(632):eabm4107.
doi: 10.1126/scitranslmed.abm4107. Epub 2022 Feb 16.

Astrocytic α2-Na+/K+ ATPase inhibition suppresses astrocyte reactivity and reduces neurodegeneration in a tauopathy mouse model

Affiliations

Astrocytic α2-Na+/K+ ATPase inhibition suppresses astrocyte reactivity and reduces neurodegeneration in a tauopathy mouse model

Carolyn N Mann et al. Sci Transl Med. .

Abstract

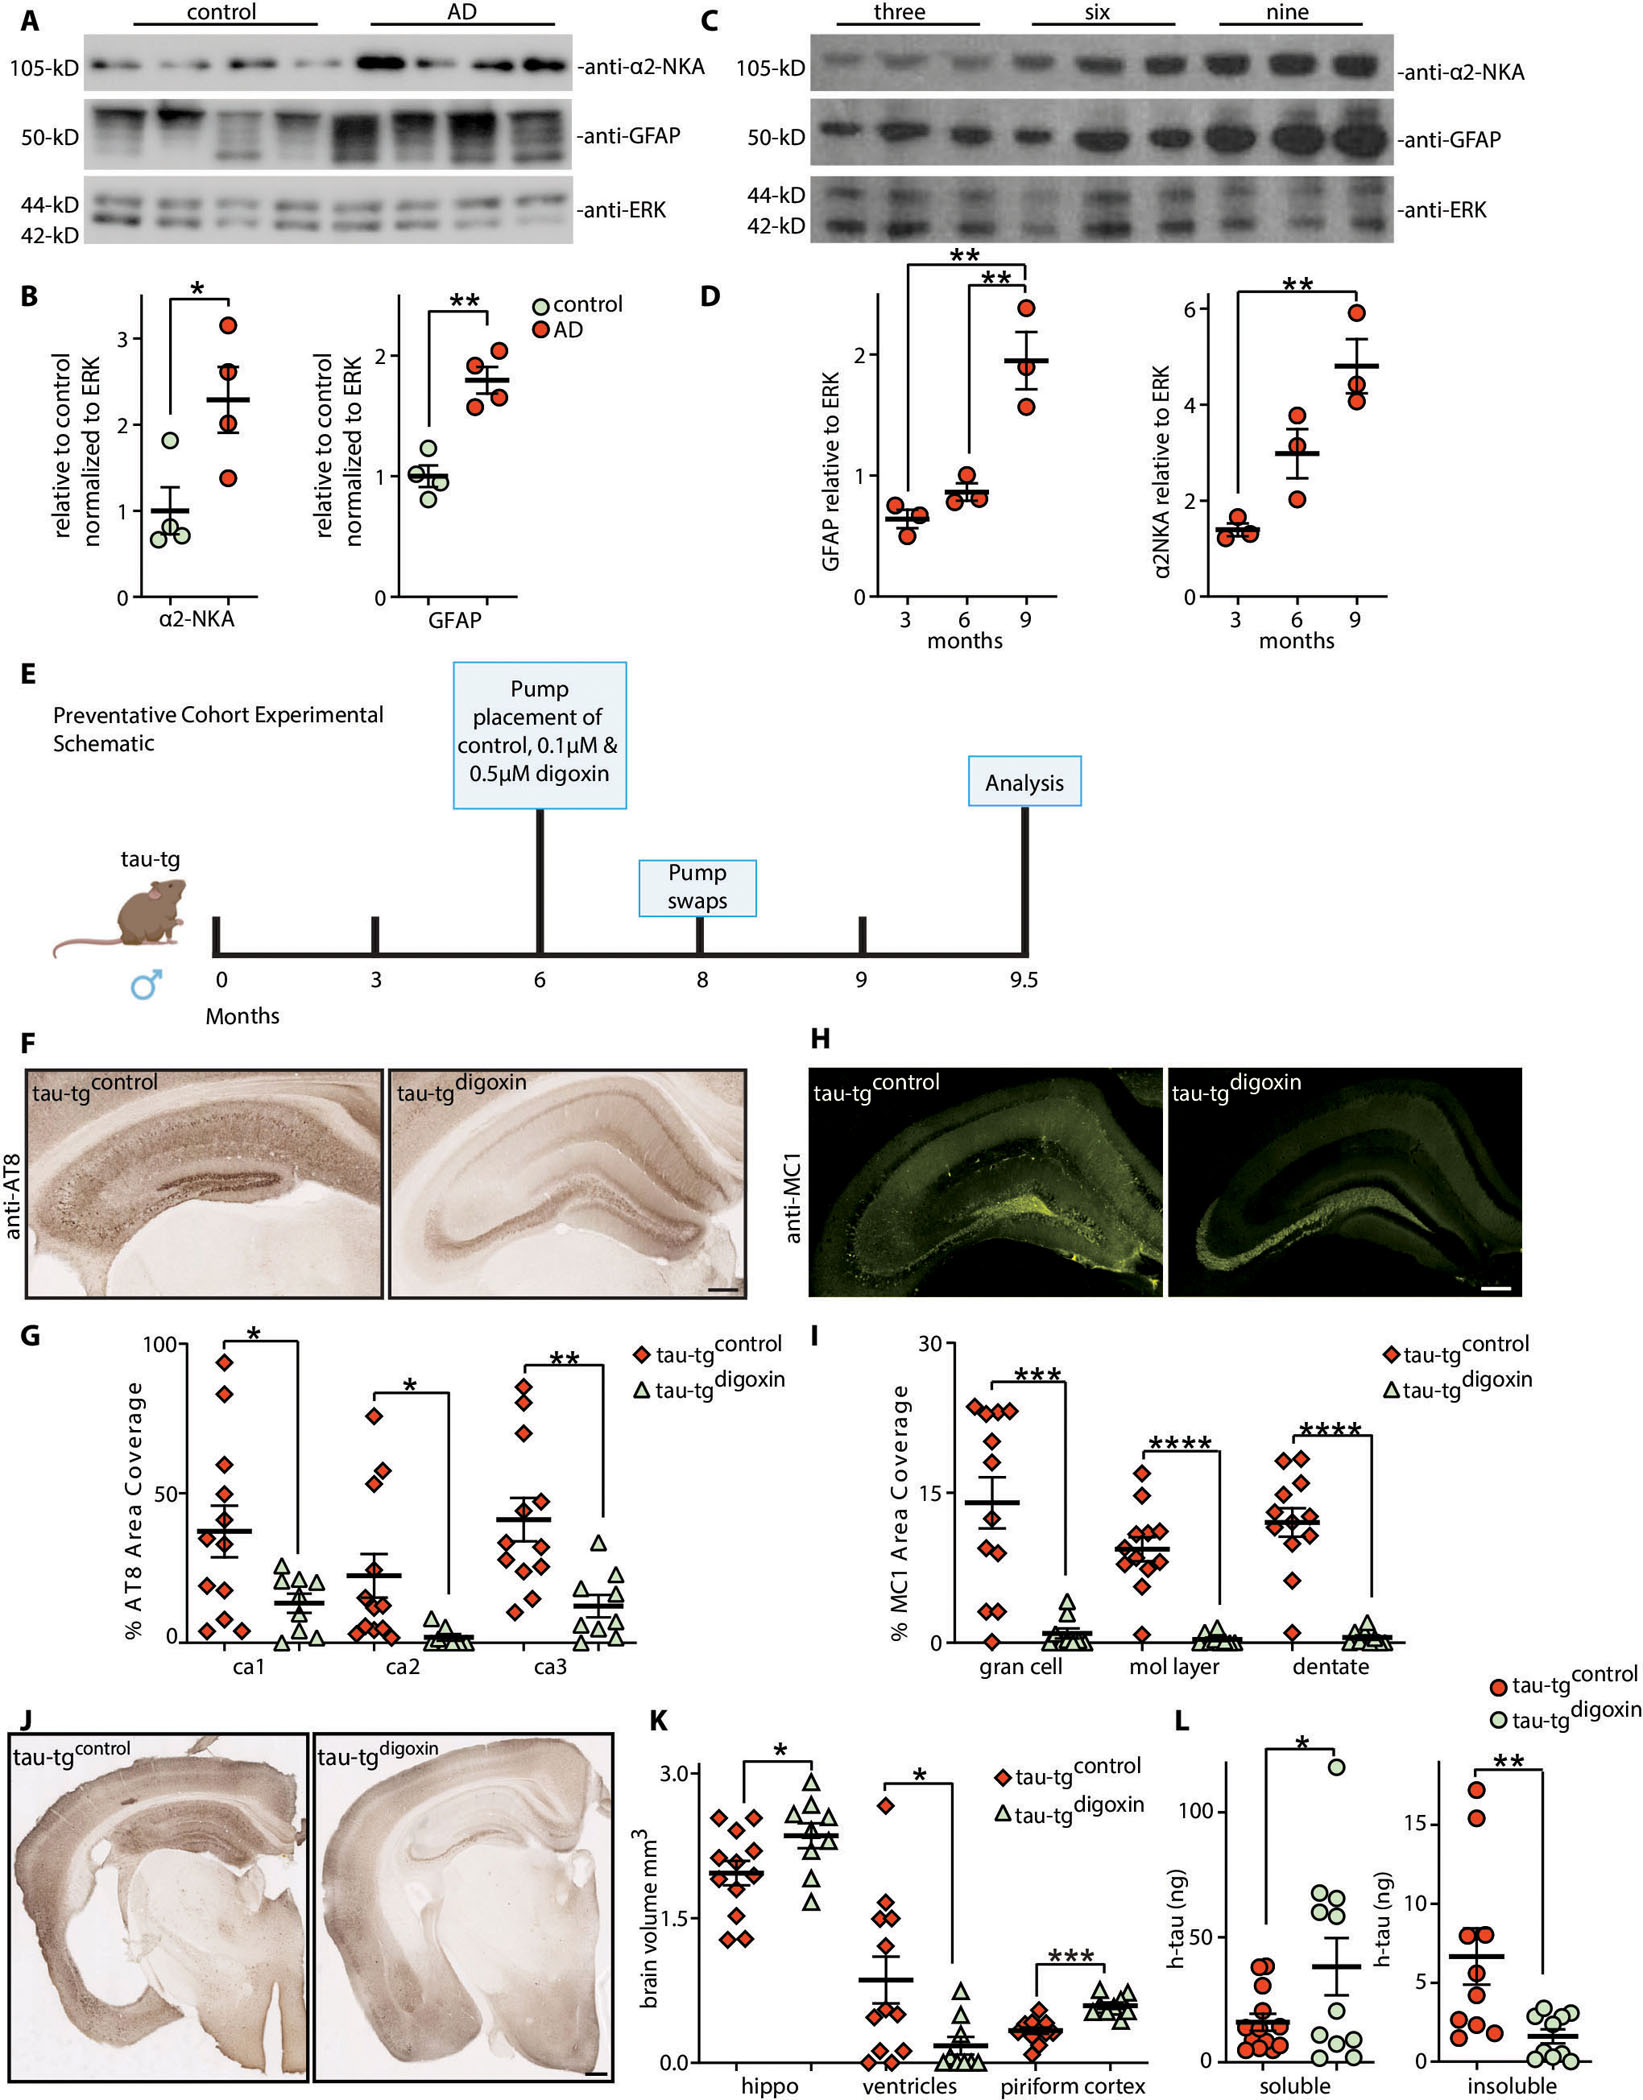
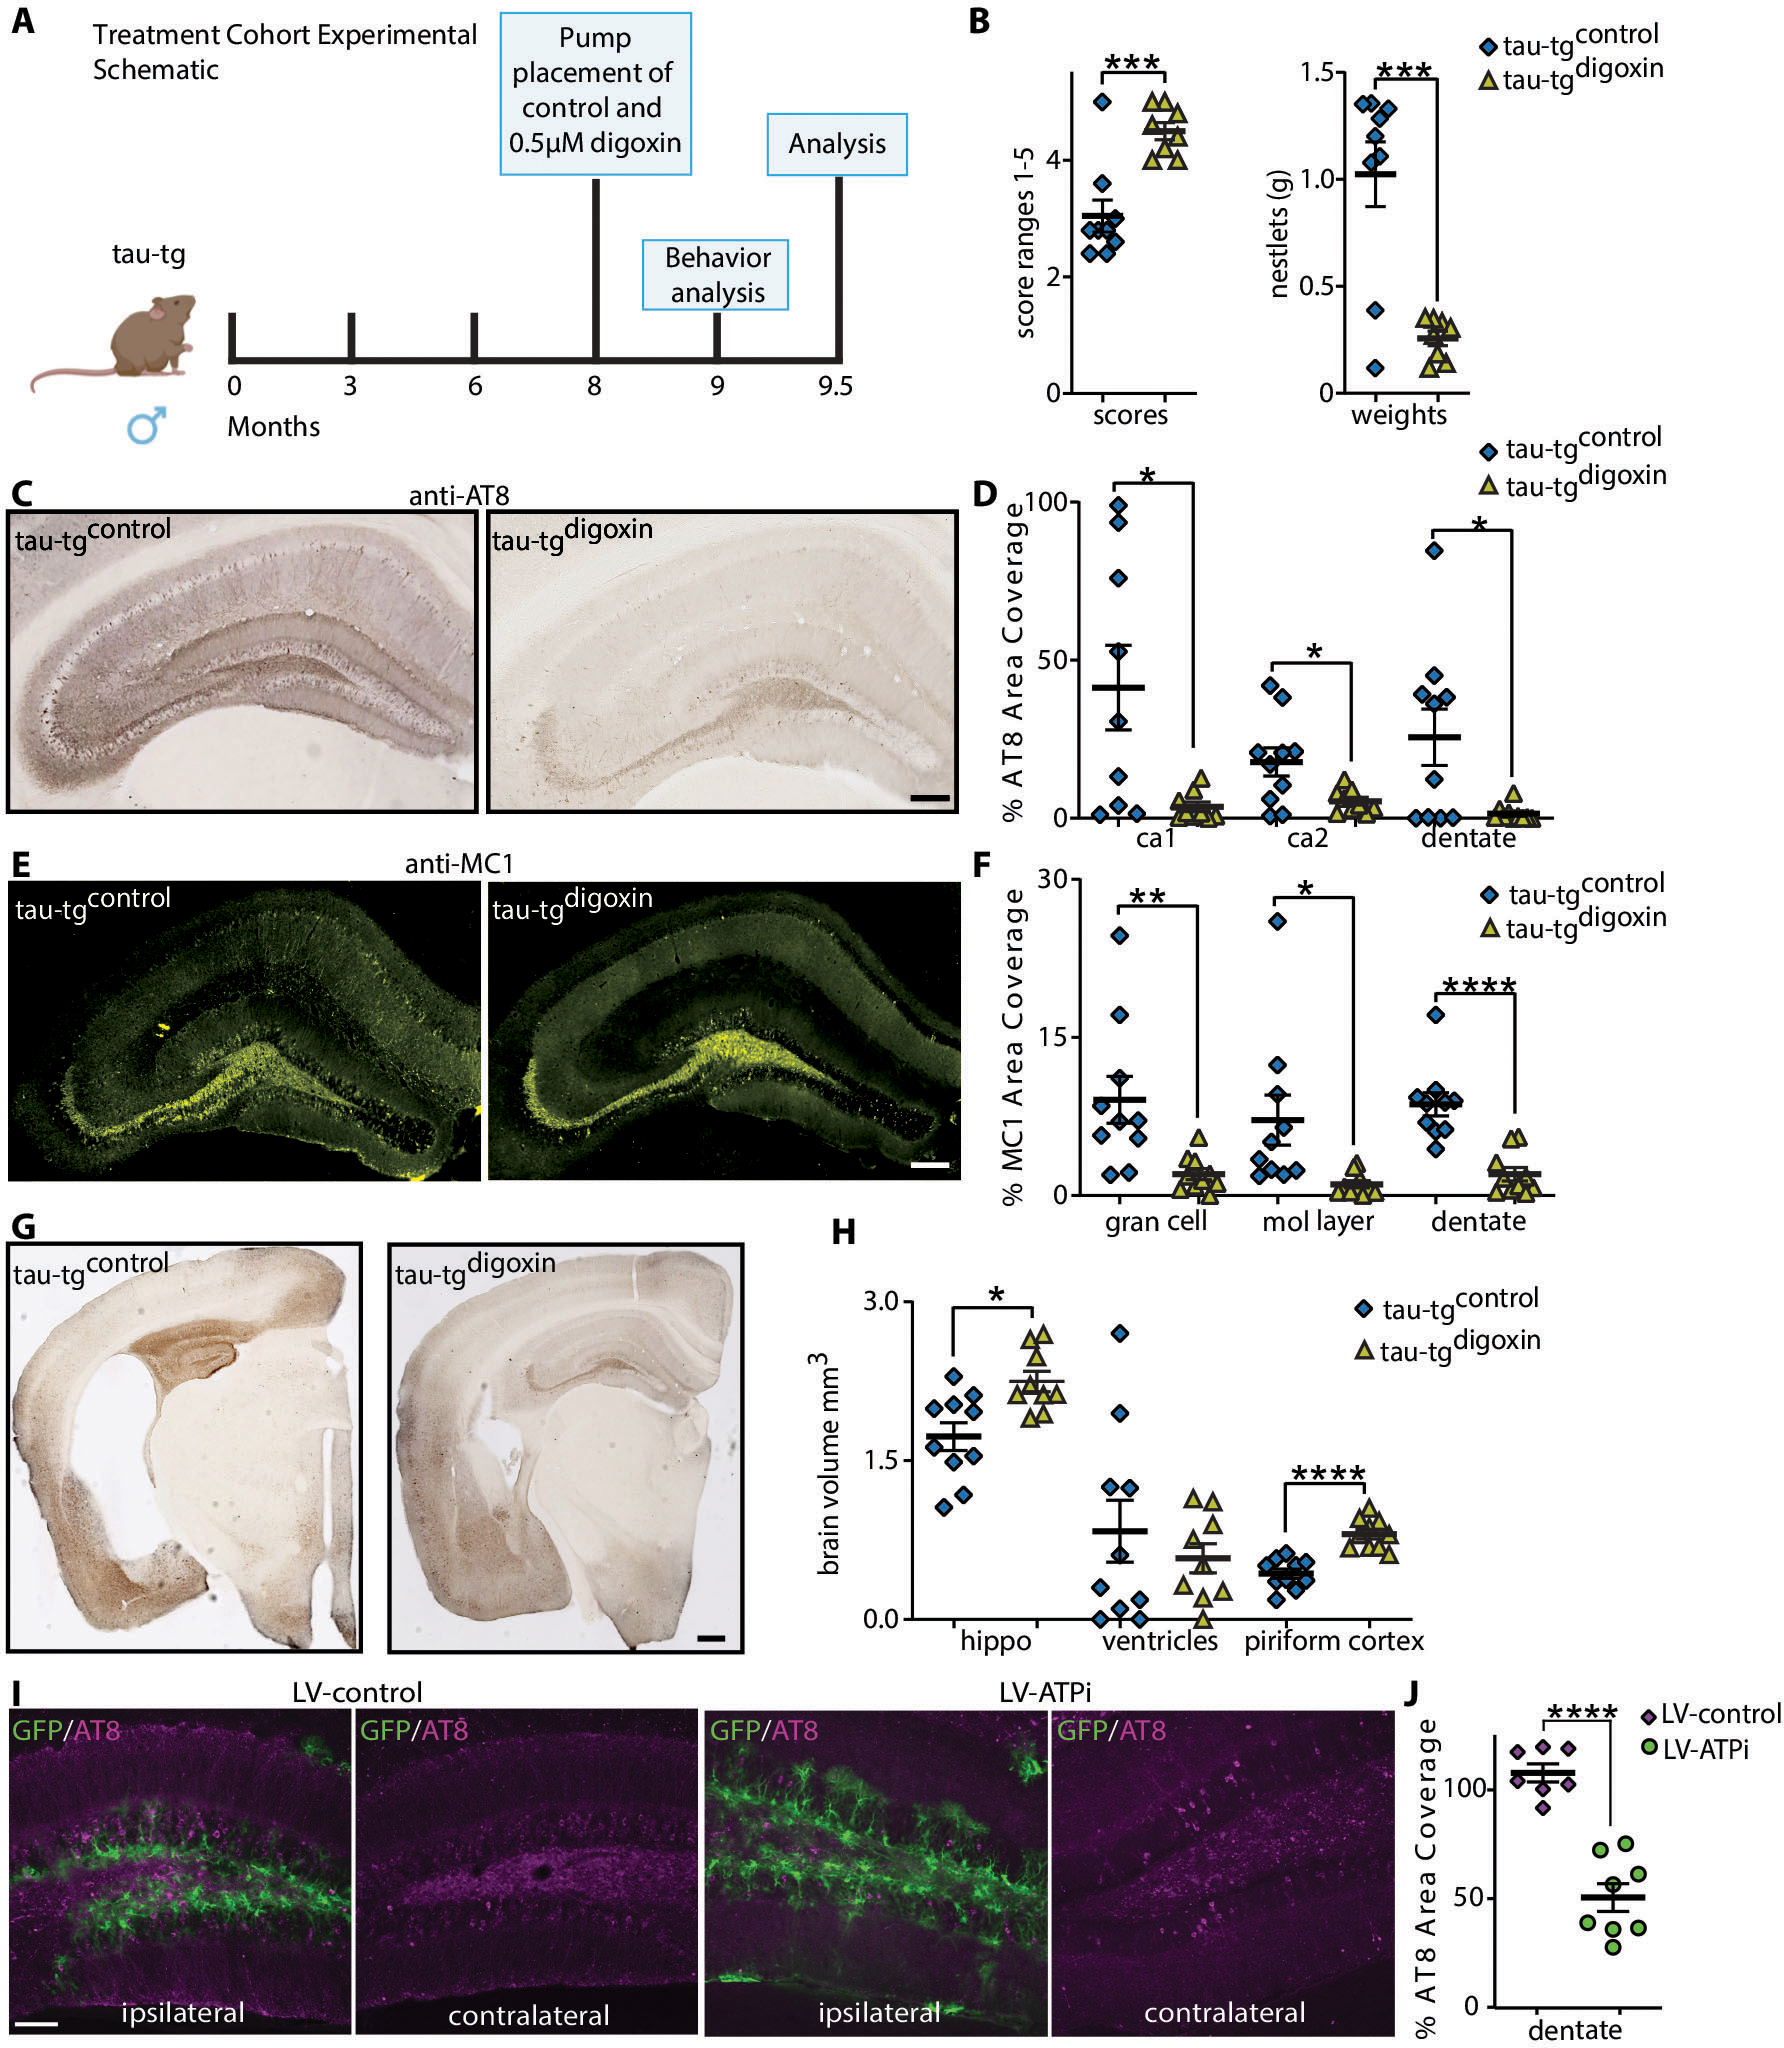
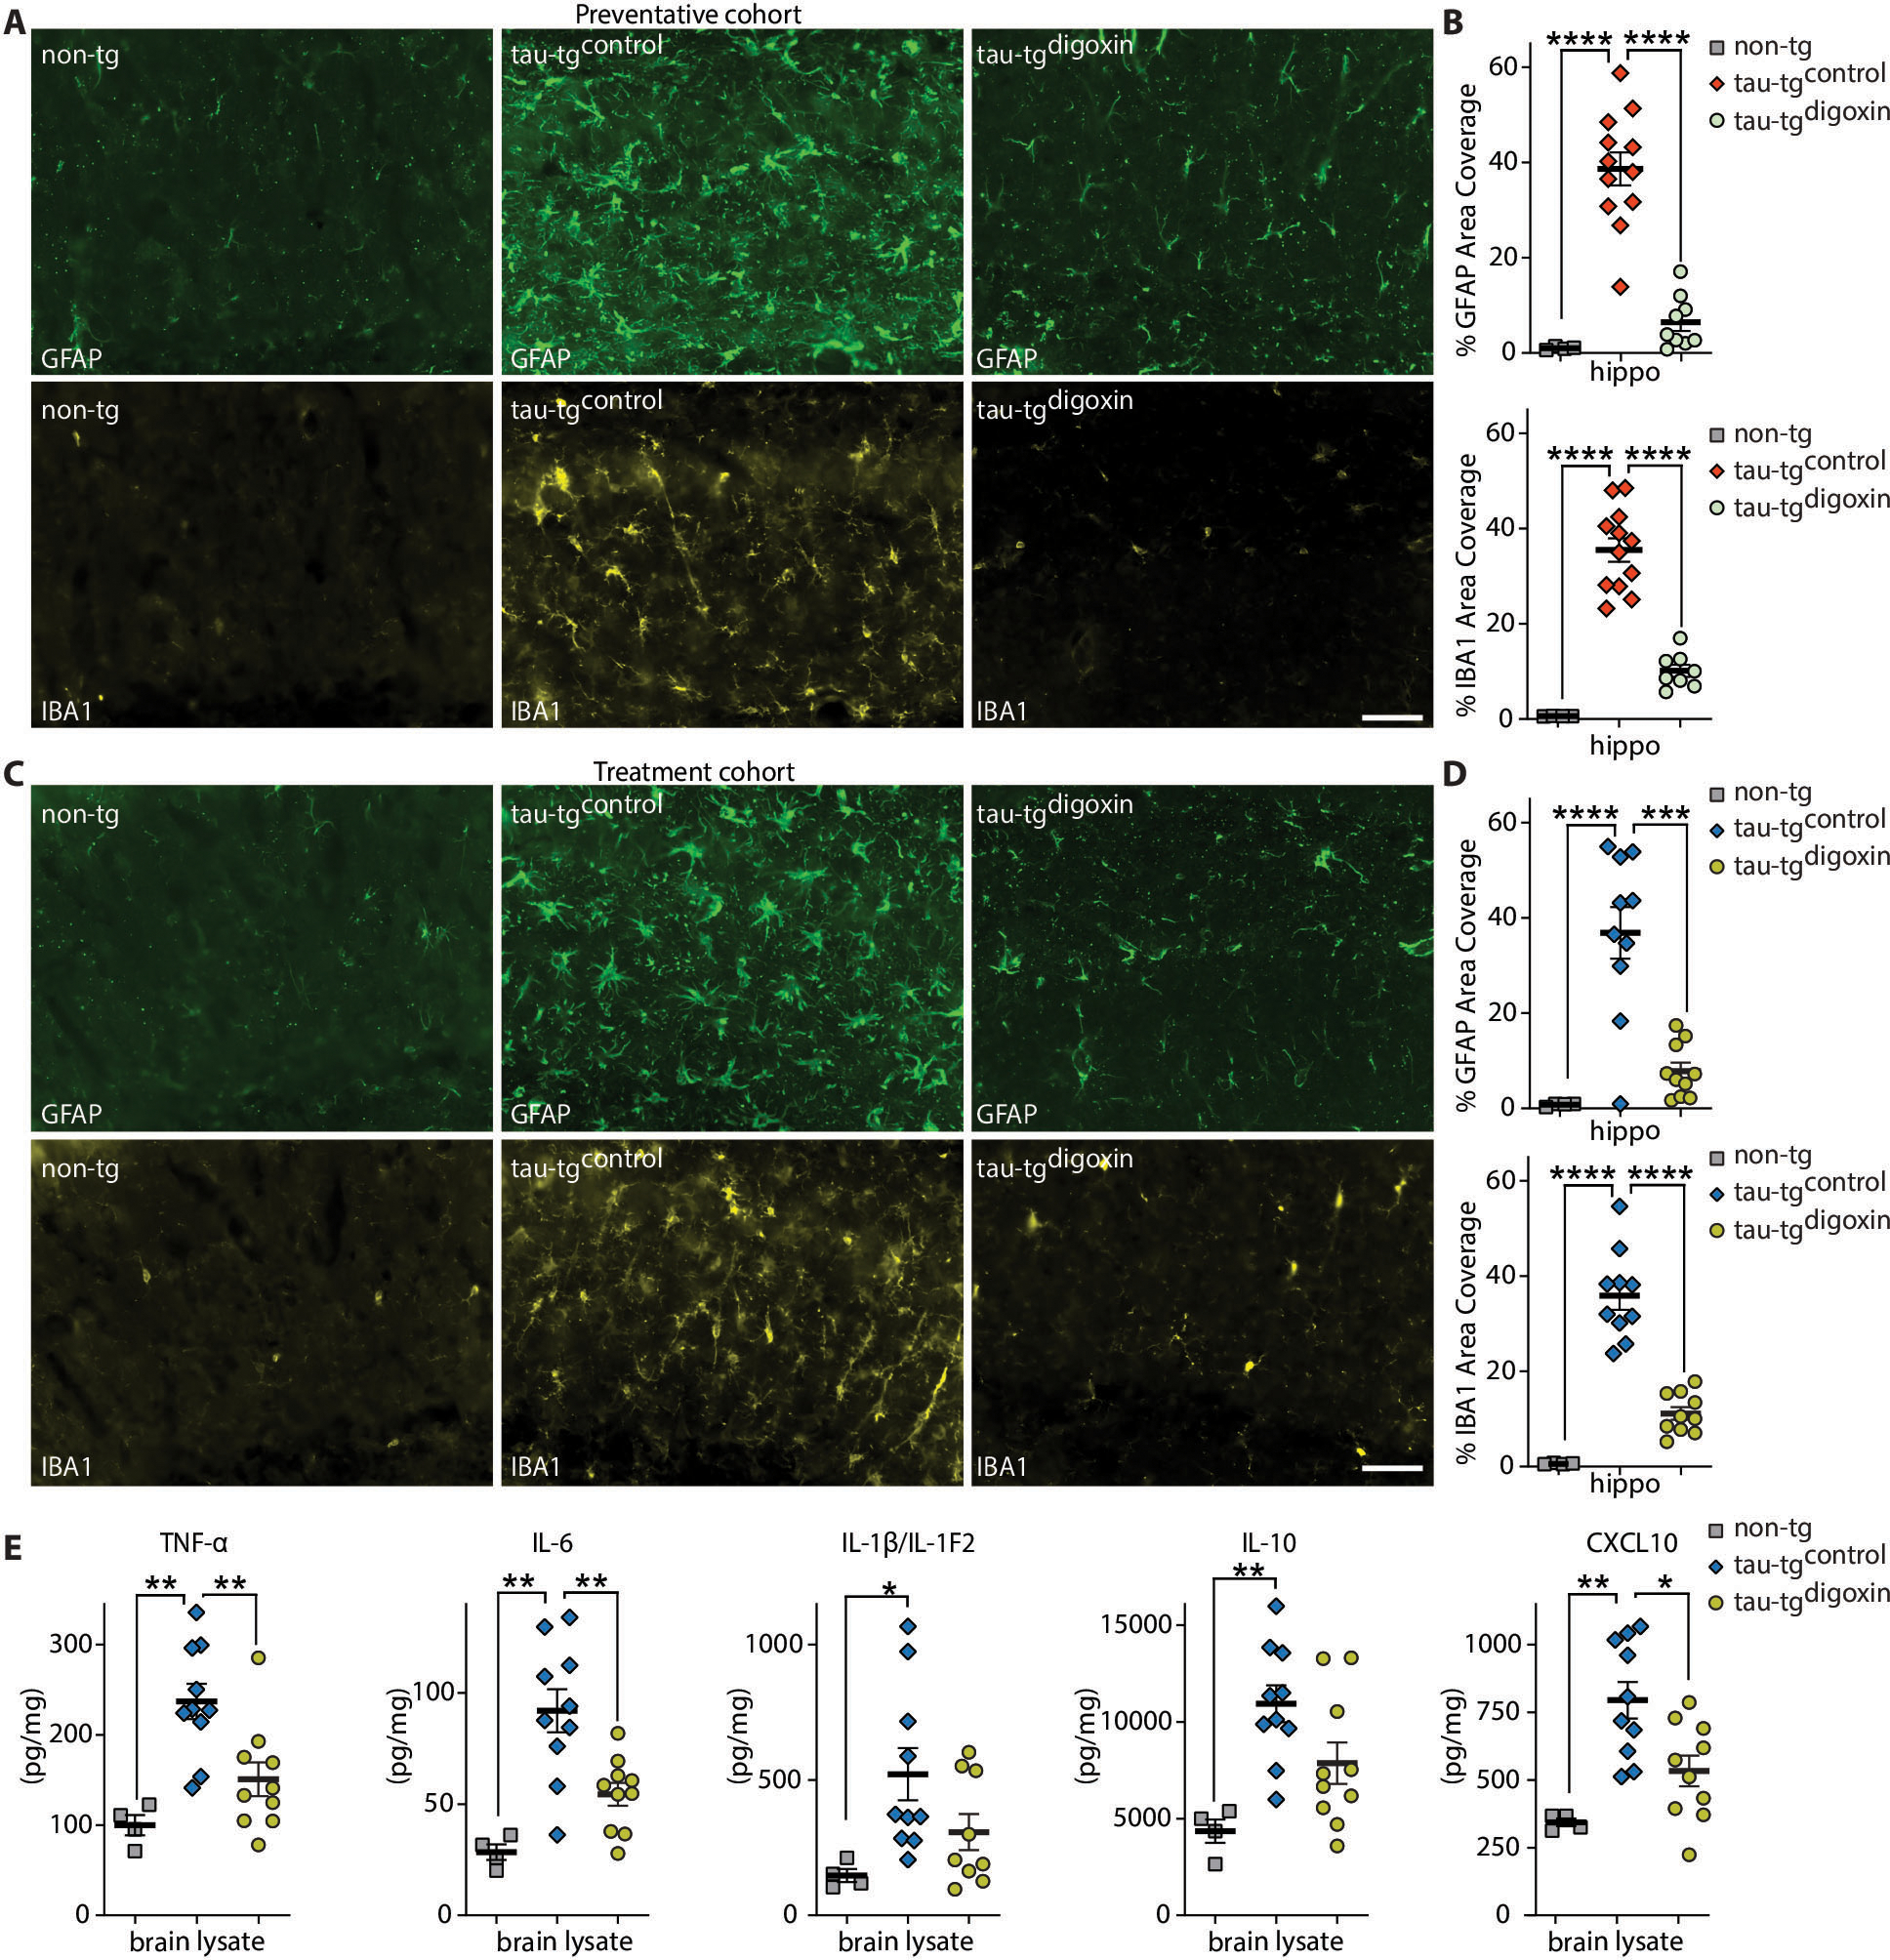
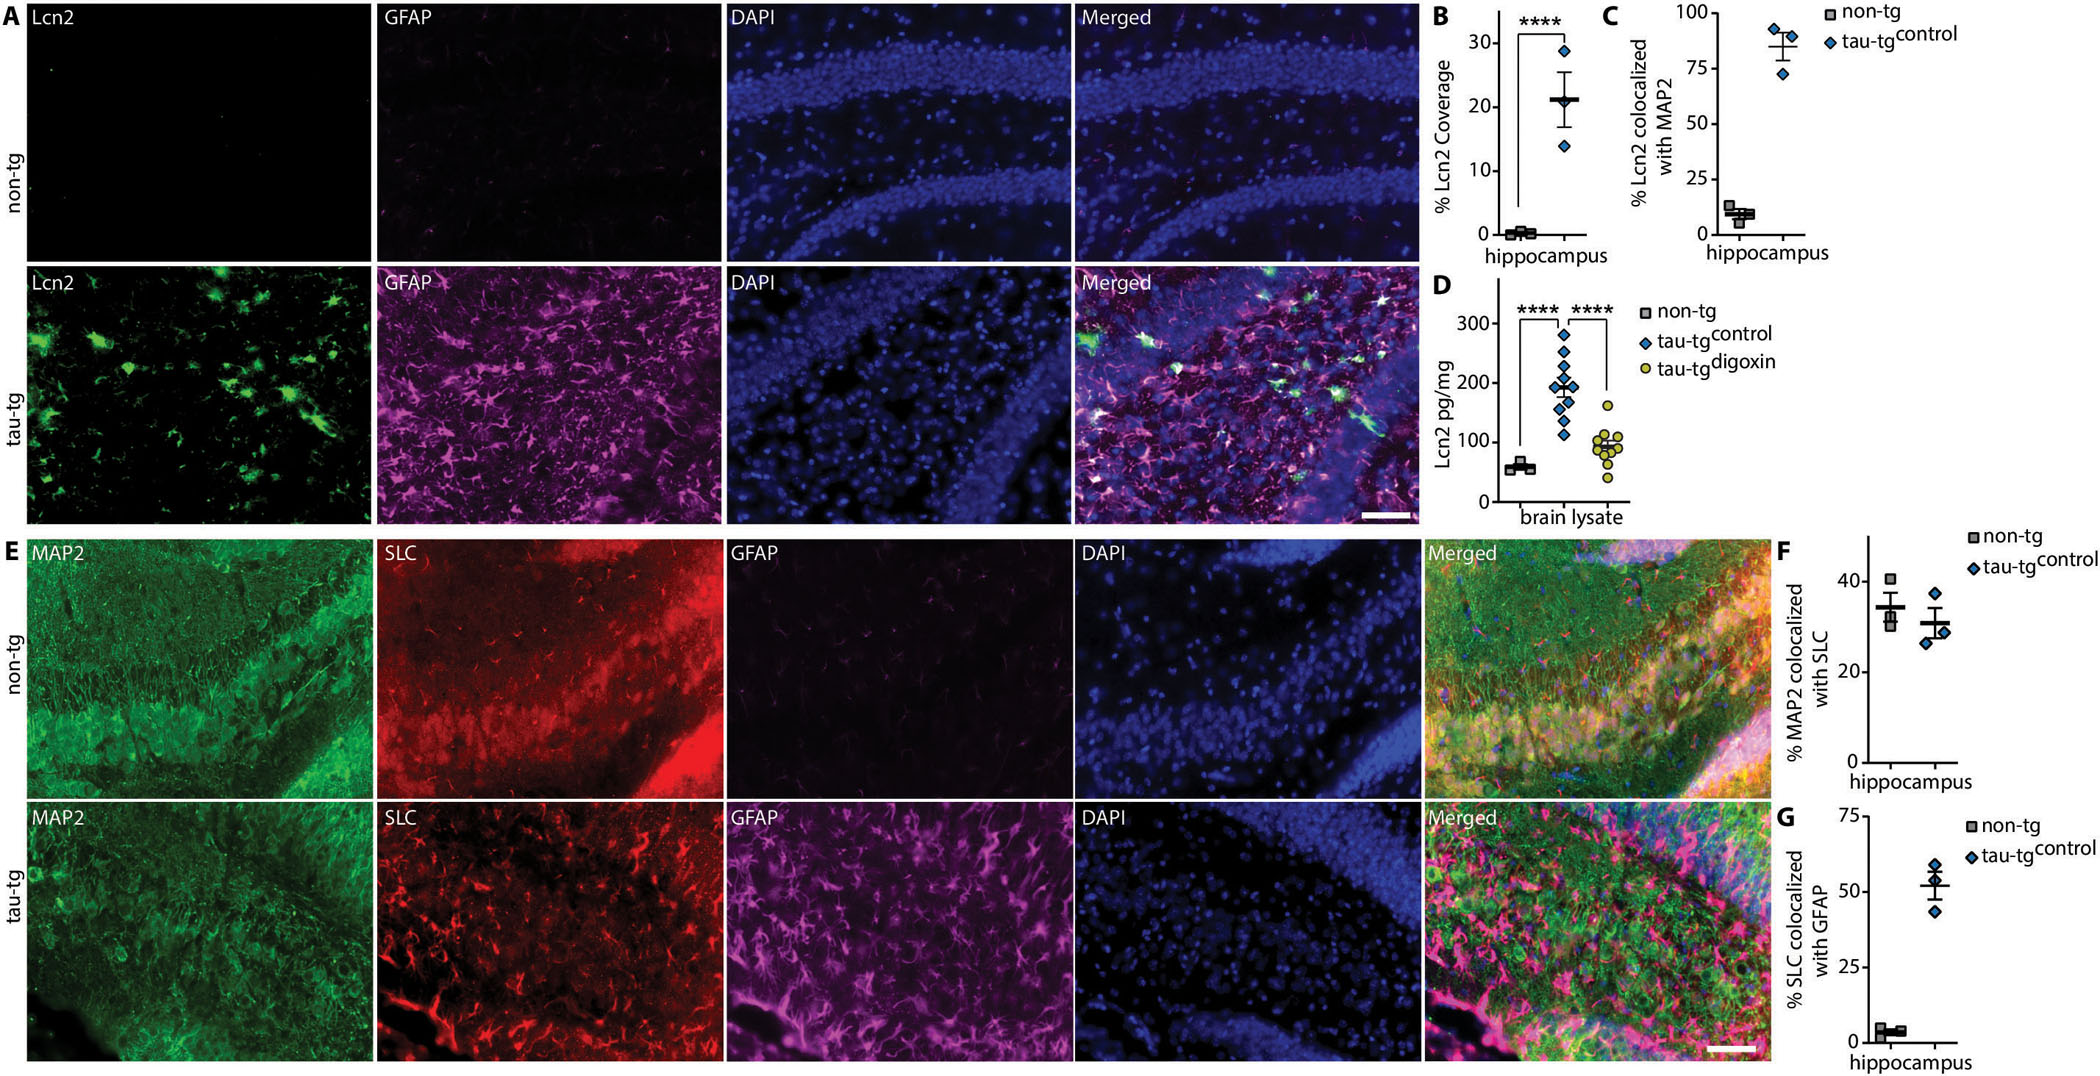
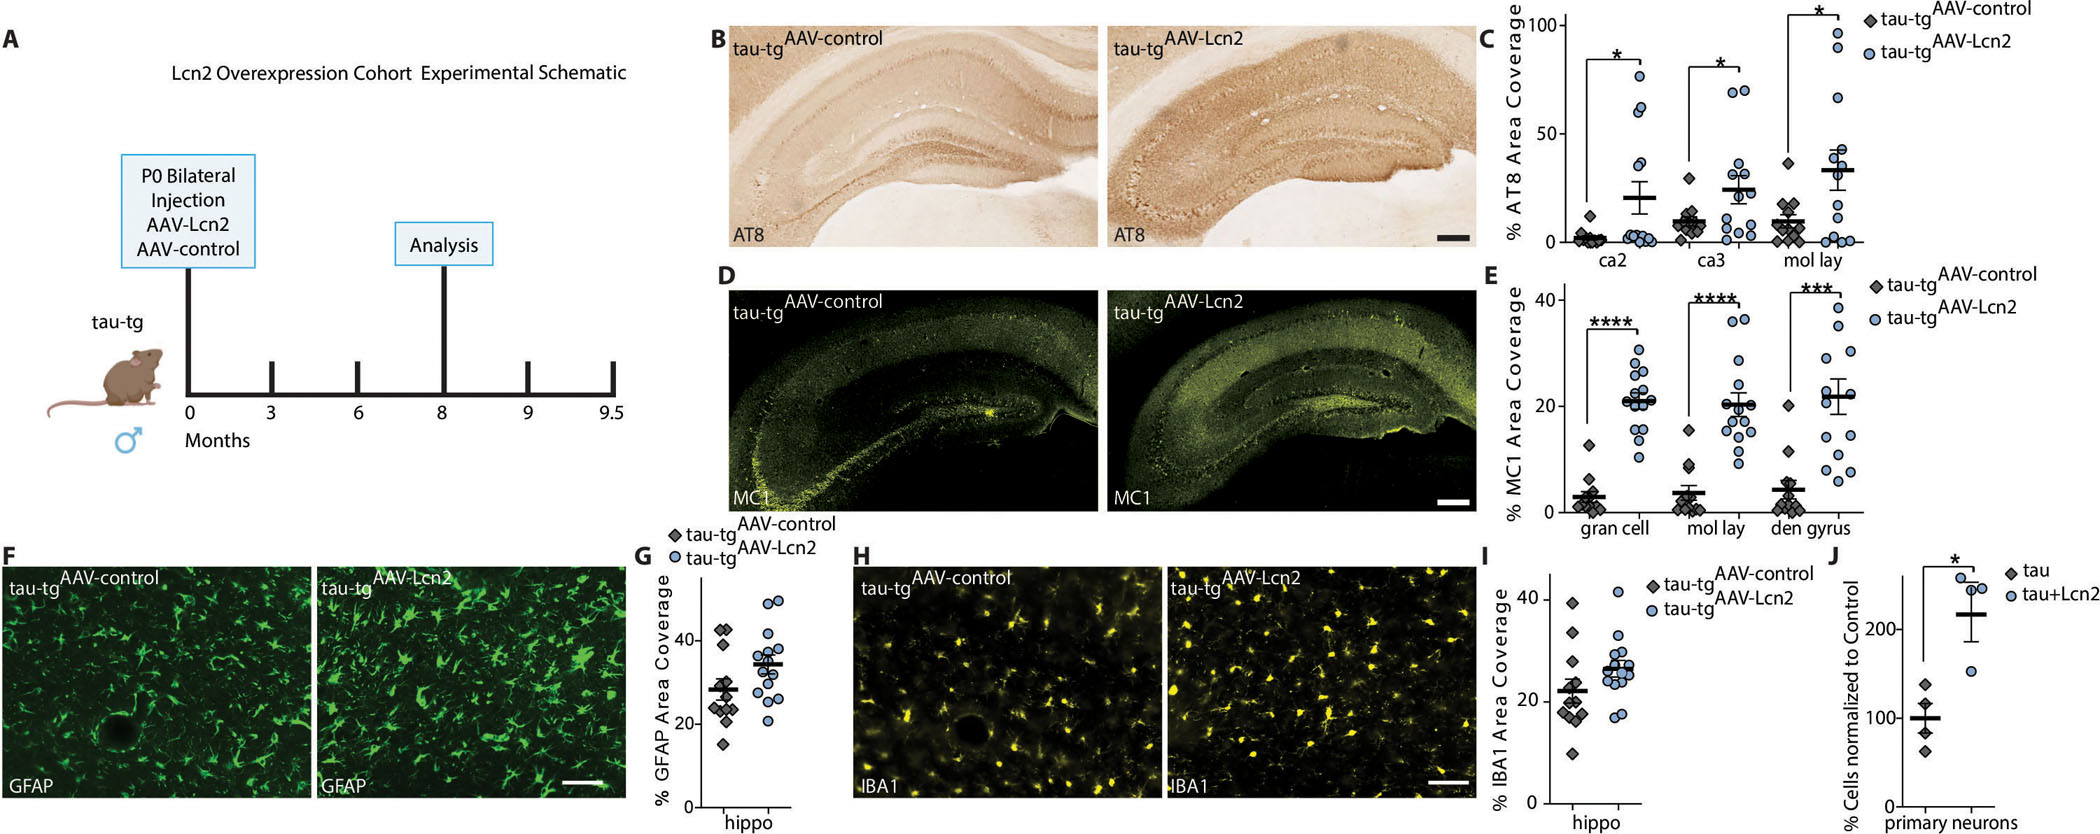
Alzheimer's disease (AD) is the most dominant form of dementia characterized by the deposition of extracellular amyloid plaques and intracellular neurofibrillary tau tangles (NFTs). In addition to these pathologies, an emerging pathophysiological mechanism that influences AD is neuroinflammation. Astrocytes are a vital type of glial cell that contribute to neuroinflammation, and reactive astrocytes, or astrogliosis, are a well-known pathological feature of AD. However, the mechanisms by which astrocytes contribute to the neurodegenerative process in AD have not been fully elucidated. Here, we showed that astrocytic α2-Na+/K+ adenosine triphosphatase (α2-NKA) is elevated in postmortem human brain tissue from AD and progressive nuclear palsy, a primary tauopathy. The increased astrocytic α2-NKA was also recapitulated in a mouse model of tauopathy. Pharmacological inhibition of α2-NKA robustly suppressed neuroinflammation and reduced brain atrophy. In addition, α2-NKA knockdown in tauopathy mice halted the accumulation of tau pathology. We also demonstrated that α2-NKA promoted tauopathy, in part, by regulating the proinflammatory protein lipocalin-2 (Lcn2). Overexpression of Lcn2 in tauopathy mice increased tau pathology, and prolonged Lcn2 exposure to primary neurons promoted tau uptake in vitro. These studies collectively highlight the contribution of reactive astrocytes to tau pathogenesis in mice and define α2-NKA as a major regulator of astrocytic-dependent neuroinflammation.


Conflict of interest statement

Competing Interests: GG and DMH are inventors on a patent # 16/817339 entitled Anti-tau Constructs licensed by Washington University to C2N Diagnostics on the therapeutic use of anti-tau antibodies. DMH co-founded and is on the scientific advisory board of C2N Diagnostics. C2N Diagnostics has licensed certain anti-tau antibodies to AbbVie for therapeutic development. DMH is on the scientific advisory board of Denali, Genentech, and Cajal Neurosciences and consults for Eli Lilly. DMH receives sponsored research agreements to Washington University from NextCure, C2N Diagnostics, and Novartis. The other authors declare that they have no competing interests.

Figures

Fig. 1.
Fig. 1.. Human tauopathies and tau-tg mice display elevated α2-NKA and inhibition with digoxin prior to overt pathology prevents tau pathology in tau-tg mice.
(A) Immunoblots of α2-NKA and GFAP relative to ERK protein from patients with confirmed AD and aged matched controls (n=4 per group) quantified in (B). (C) Immunoblot analysis of α2-NKA and GFAP in 3, 6, and 9-month diseased tau-tg mice (n=3 per group) relative to ERK protein quantified in (D). (E) Experimental schematic and timeline of digoxin infusion in preventative cohort. (F) Representative hippocampal brain sections for AT8 phosphorylated pathological tau protein in tau-tgcontrol mice (left panel) and tau-tgdigoxin mice (right panel) quantified by percent area coverage in G (n=9–12 per group). Scale bar, 200 μm. (H) Representative hippocampal brain sections for MC1 aggregated pathological tau protein in tau-tgcontrol mice (left panel) and tau-tgdigoxin mice (right panel) quantified by percent area coverage in I (n=9–12 per group). Scale bar, 200 μm. (J) Representative image of brain atrophy in tau-tgcontrol mice (left panel) and tau-tgdigoxin mice (right panel). Scale bar, 400μm. (K) Quantification of hippocampal (hippo) volume, ventricular size, and piriform cortex area in tau-tgdigoxin mice relative to tau-tgcontrol mice (n=9–12 per group). (L) Sarkosyl insoluble purification of tau protein in tau-tgdigoxin mice relative to tau-tgcontrol mice measured by ELISA (n=9–12 per group). Significance determined by unpaired, two-tailed student t-test. Error bars represent ±s.e.m. *p<0.5, **<0.01; ***p<0.001.
Fig. 2.
Fig. 2.. The inhibition or selective knockdown of α2-NKA after disease onset attenuates neuroinflammation and halts tau pathogenesis in tau-tg mice.
(A) Experimental schematic and timeline of digoxin infusion in treatment cohort. (B) Nesting activity of tau-tgdigoxin and tau-tgcontrol assessed using a published scoring criteria to assess the quality of nest construction and amount of torn nestlet (n=8–9). (C) Representative hippocampal brain sections for AT8 phosphorylated pathological tau protein in tau-tgcontrol mice (left panel) and tau-tgdigoxin mice (right panel), quantified by percent area coverage in D (n=9–10 per group). Scale bar, 200μm. (E) Representative hippocampal brain sections for MC1 aggregated pathological tau protein in tau-tgcontrol mice (left panel) and tau-tgdigoxin mice (right panel), quantified by percent area coverage in F (n=9–10 per group). Scale bar, 200μm. (G) Representative image of brain atrophy in tau-tgcontrol mice (left panel) and tau-tgdigoxin mice (right panel) Scale bar, 400μm. (H) Quantification of hippocampal (hippo), ventricular size, and piriform cortex volume in tau-tgdigoxin mice relative to tau-tgcontrol mice (n=9–10 per group). (I) Representative hippocampal sections of tau-tg mice unilaterally injected into dentate gyrus with a lentivirus encoding GFP under a GFAP promoter and shRNA targeting the knockdown of the α2-NKA (LV-ATPi, green) and the corresponding control lentivirus (LV-control, green). Scale bar. 100μm. (J) Quantification of percent area covered of pathological phosphorylated tau (AT8) of control LV-control injected relative to LV-ATPi (n=7–8 per group). Significance determined by unpaired, two-tailed student t-test. Error bars represent ±s.e.m. *p<0.5, ***p<0.001, ****p p<0.0001.
Fig. 3.
Fig. 3.. Inhibition of the α2-NKA in preventative and treatment cohort suppresses neuroinflammation.
(A) Representative immunostaining of hippocampus in the preventative cohort for astrogliosis marker GFAP (green) and microgliosis marker IBA1 (gold) in aged, matched sham non-tg (left panel), tau-tgcontrol (middle panel), and tau-tgdigoxin (right panel). Scale bars 50μm. (B) Analysis for percent area covered of GFAP (top) and IBA1 (bottom) in the hippocampus of sham non-tg mice, tau-tgcontrol mice, and tau-tgdigoxin mice (n=4–12). (C) Representative immunostaining of hippocampus in treatment cohort with GFAP (green) and IBA1 (gold) in non-tg mice (left panel), tau-tgcontrol (middle panel), and tau-tgdigoxin (right panel). Scale bars 50μm. (D) Analysis for percent area covered of GFAP (top) and IBA1 (bottom) of the hippocampus normalized to sham non-tg mice (n=4–10). (E) Assessment of chemokines and cytokines TNFα, IL-6, IL-1β/IL-1F2, IL-10, and CXCL10 in treatment cohort (n=4–10 per group). Significance determined by one-way ANOVA and Bonferonni post hoc test for both the preventative and treatment cohort and chemokines/cytokines. Error bars represent ±s.e.m. *P < 0.05, **P < 0.01, ***P < 0.001, ****P < 0.0001
Fig. 4.
Fig. 4.. Tau-tg display increased astrocytic Lcn2 that is significantly decreased with α2-NKA inhibition
(A) Immunostaining of Lcn2 (green) co-localized with GFAP (magenta) in aged tau-tg mice (bottom panels) and aged match non-tg control (top panels) quantified for percent area coverage in B and co-localization in C (n=3 per group). Scale bars 50μm. (D) ELISA measurement of Lcn2 in tau-tgdigoxin mice relative to tau-tgcontrol (n=3–10 per group). (C) Immunostaining of MAP2 (green), Lcn2 receptor SLC (red) and GFAP (magenta) in aged non-tg control and aged tau-tg (n=3 per group) quantified for co-localization in F and G. Scale bars 50μm. Significance determined by one-way ANOVA and Bonferroni post hoc test. Error bars represent ±s.e.m. ****P < 0.0001.
Fig. 5.
Fig. 5.. Global overexpression of Lcn2 increased tau pathology accumulation in vivo and induced neuronal tau uptake in vivo
(A) Experimental schematic and timeline of Lcn2 overexpression cohort. (B) Representative hippocampal brain sections for AT8 phosphorylated pathological tau protein in tau-tg AAV control (tau-tgAAV-control) mice and tau-tg mice overexpressing Lcn2 (tau-tgAAV-Lcn2) quantified by percent area coverage in C (n=12–14 per group). Scale bar, 200μm. (D) Representative hippocampal brain sections for MC1 aggregated pathological tau protein in tau-tg AAV control (tau-tgAAV-control) mice and tau-tg mice overexpressing Lcn2 (tau-tgAAV-Lcn2) quantified by percent area coverage in E. (n=12–14 per group). Scale bar, 200μm. (F) Representative immunostaining of the hippocampus of tau-tgAAV-control mice and tau-tgAAV-Lcn2 mice of GFAP, quantified by percent area coverage in G (n=12–14 per group). Scale bar, 50μm. (H) Representative immunostaining of the hippocampus of tau-tgAAV-control mice and tau-tgAAV-Lcn2 mice of IBA1, quantified by percent area coverage in I (n=12–14 per group). Scale bar, 50μm. (J) Fluorescently labeled h-tau uptake by primary neurons measured by flow cytometry (n=4). Significance determined by unpaired, two-tailed student t-test. Error bars represent ±s.e.m. *P < 0.05, ***P < 0.001, ****P < 0.0001

References

    1. Kidd M, Paired helical filaments in electron microscopy of Alzheimer’s disease. Nature 197, 192–193 (1963); published online EpubJan 12 ( - PubMed
    1. Joachim CL, Morris JH, Selkoe DJ, Kosik KS, Tau epitopes are incorporated into a range of lesions in Alzheimer’s disease. J Neuropathol Exp Neurol 46, 611–622 (1987); published online EpubNov ( - PubMed
    1. Musiek ES, Holtzman DM, Three dimensions of the amyloid hypothesis: time, space and ‘wingmen’. Nat Neurosci 18, 800–806 (2015); published online EpubJun (10.1038/nn.4018nn.4018 [pii]). - DOI - PMC - PubMed
    1. Karran E, Mercken M, De Strooper B, The amyloid cascade hypothesis for Alzheimer’s disease: an appraisal for the development of therapeutics. Nat Rev Drug Discov 10, 698–712 (2011); published online EpubAug 19 (10.1038/nrd3505nrd3505 [pii]). - DOI - PubMed
    1. Nagele RG, Wegiel J, Venkataraman V, Imaki H, Wang KC, Contribution of glial cells to the development of amyloid plaques in Alzheimer’s disease. Neurobiol Aging 25, 663–674 (2004); published online EpubMay-Jun (10.1016/j.neurobiolaging.2004.01.007S0197458004001034 [pii]). - DOI - PubMed

Publication types