. 2022 Feb 16;14(632):eabj8186.
doi: 10.1126/scitranslmed.abj8186. Epub 2022 Feb 16.

Spatial transcriptomics of dorsal root ganglia identifies molecular signatures of human nociceptors

Affiliations

Spatial transcriptomics of dorsal root ganglia identifies molecular signatures of human nociceptors

Diana Tavares-Ferreira et al. Sci Transl Med. .

Abstract

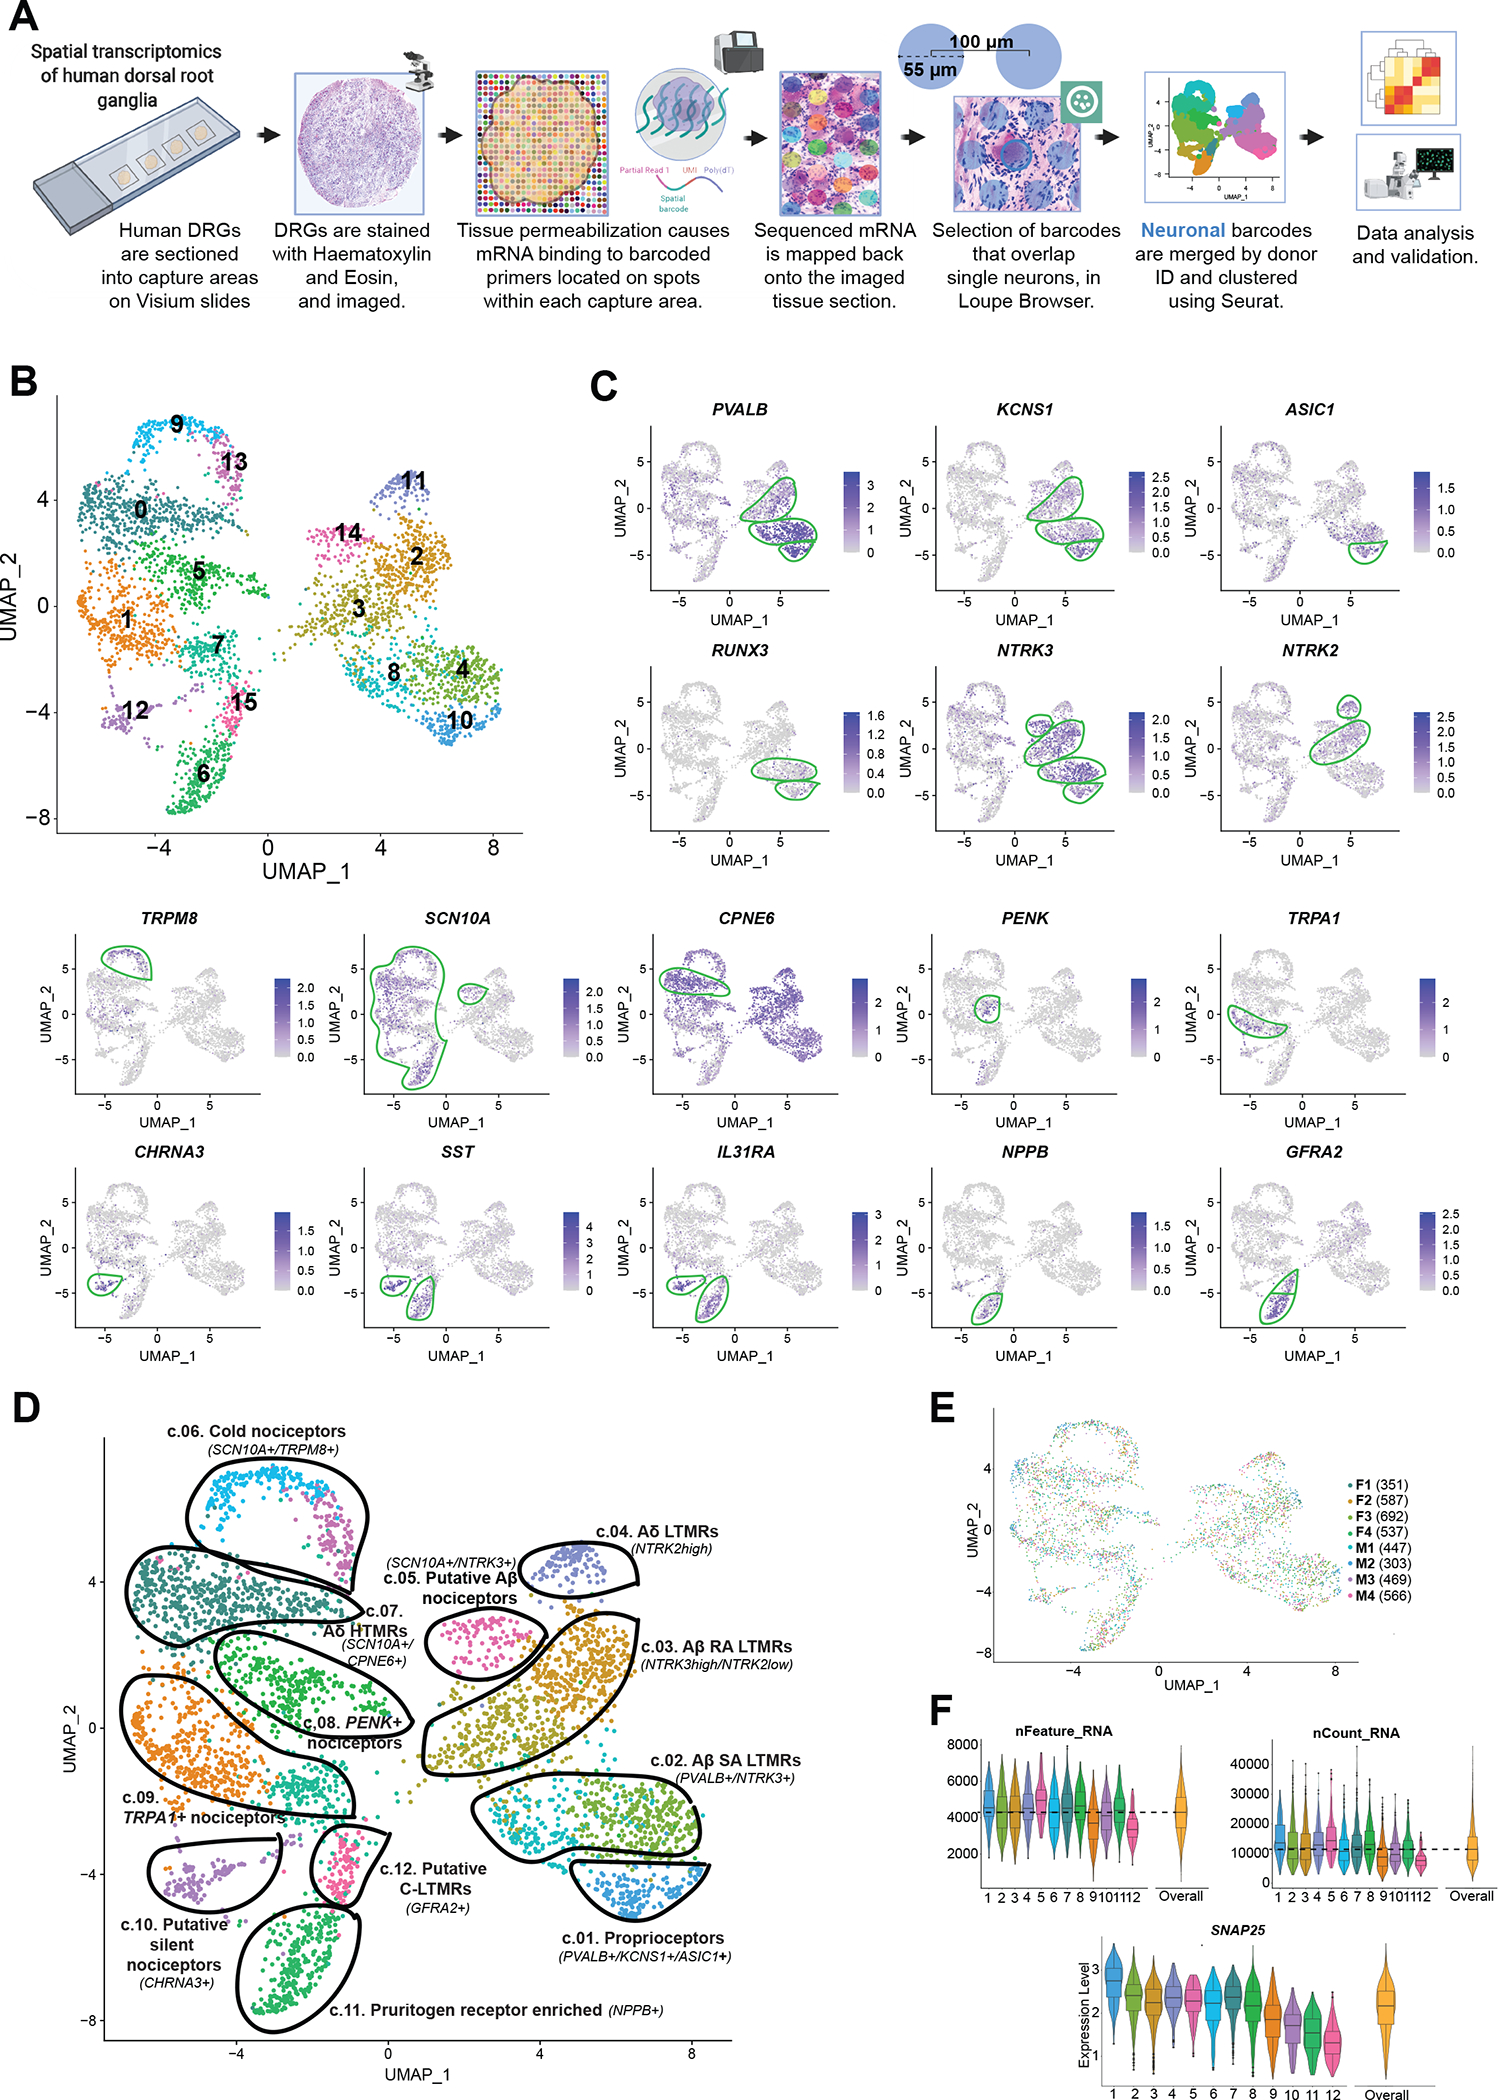
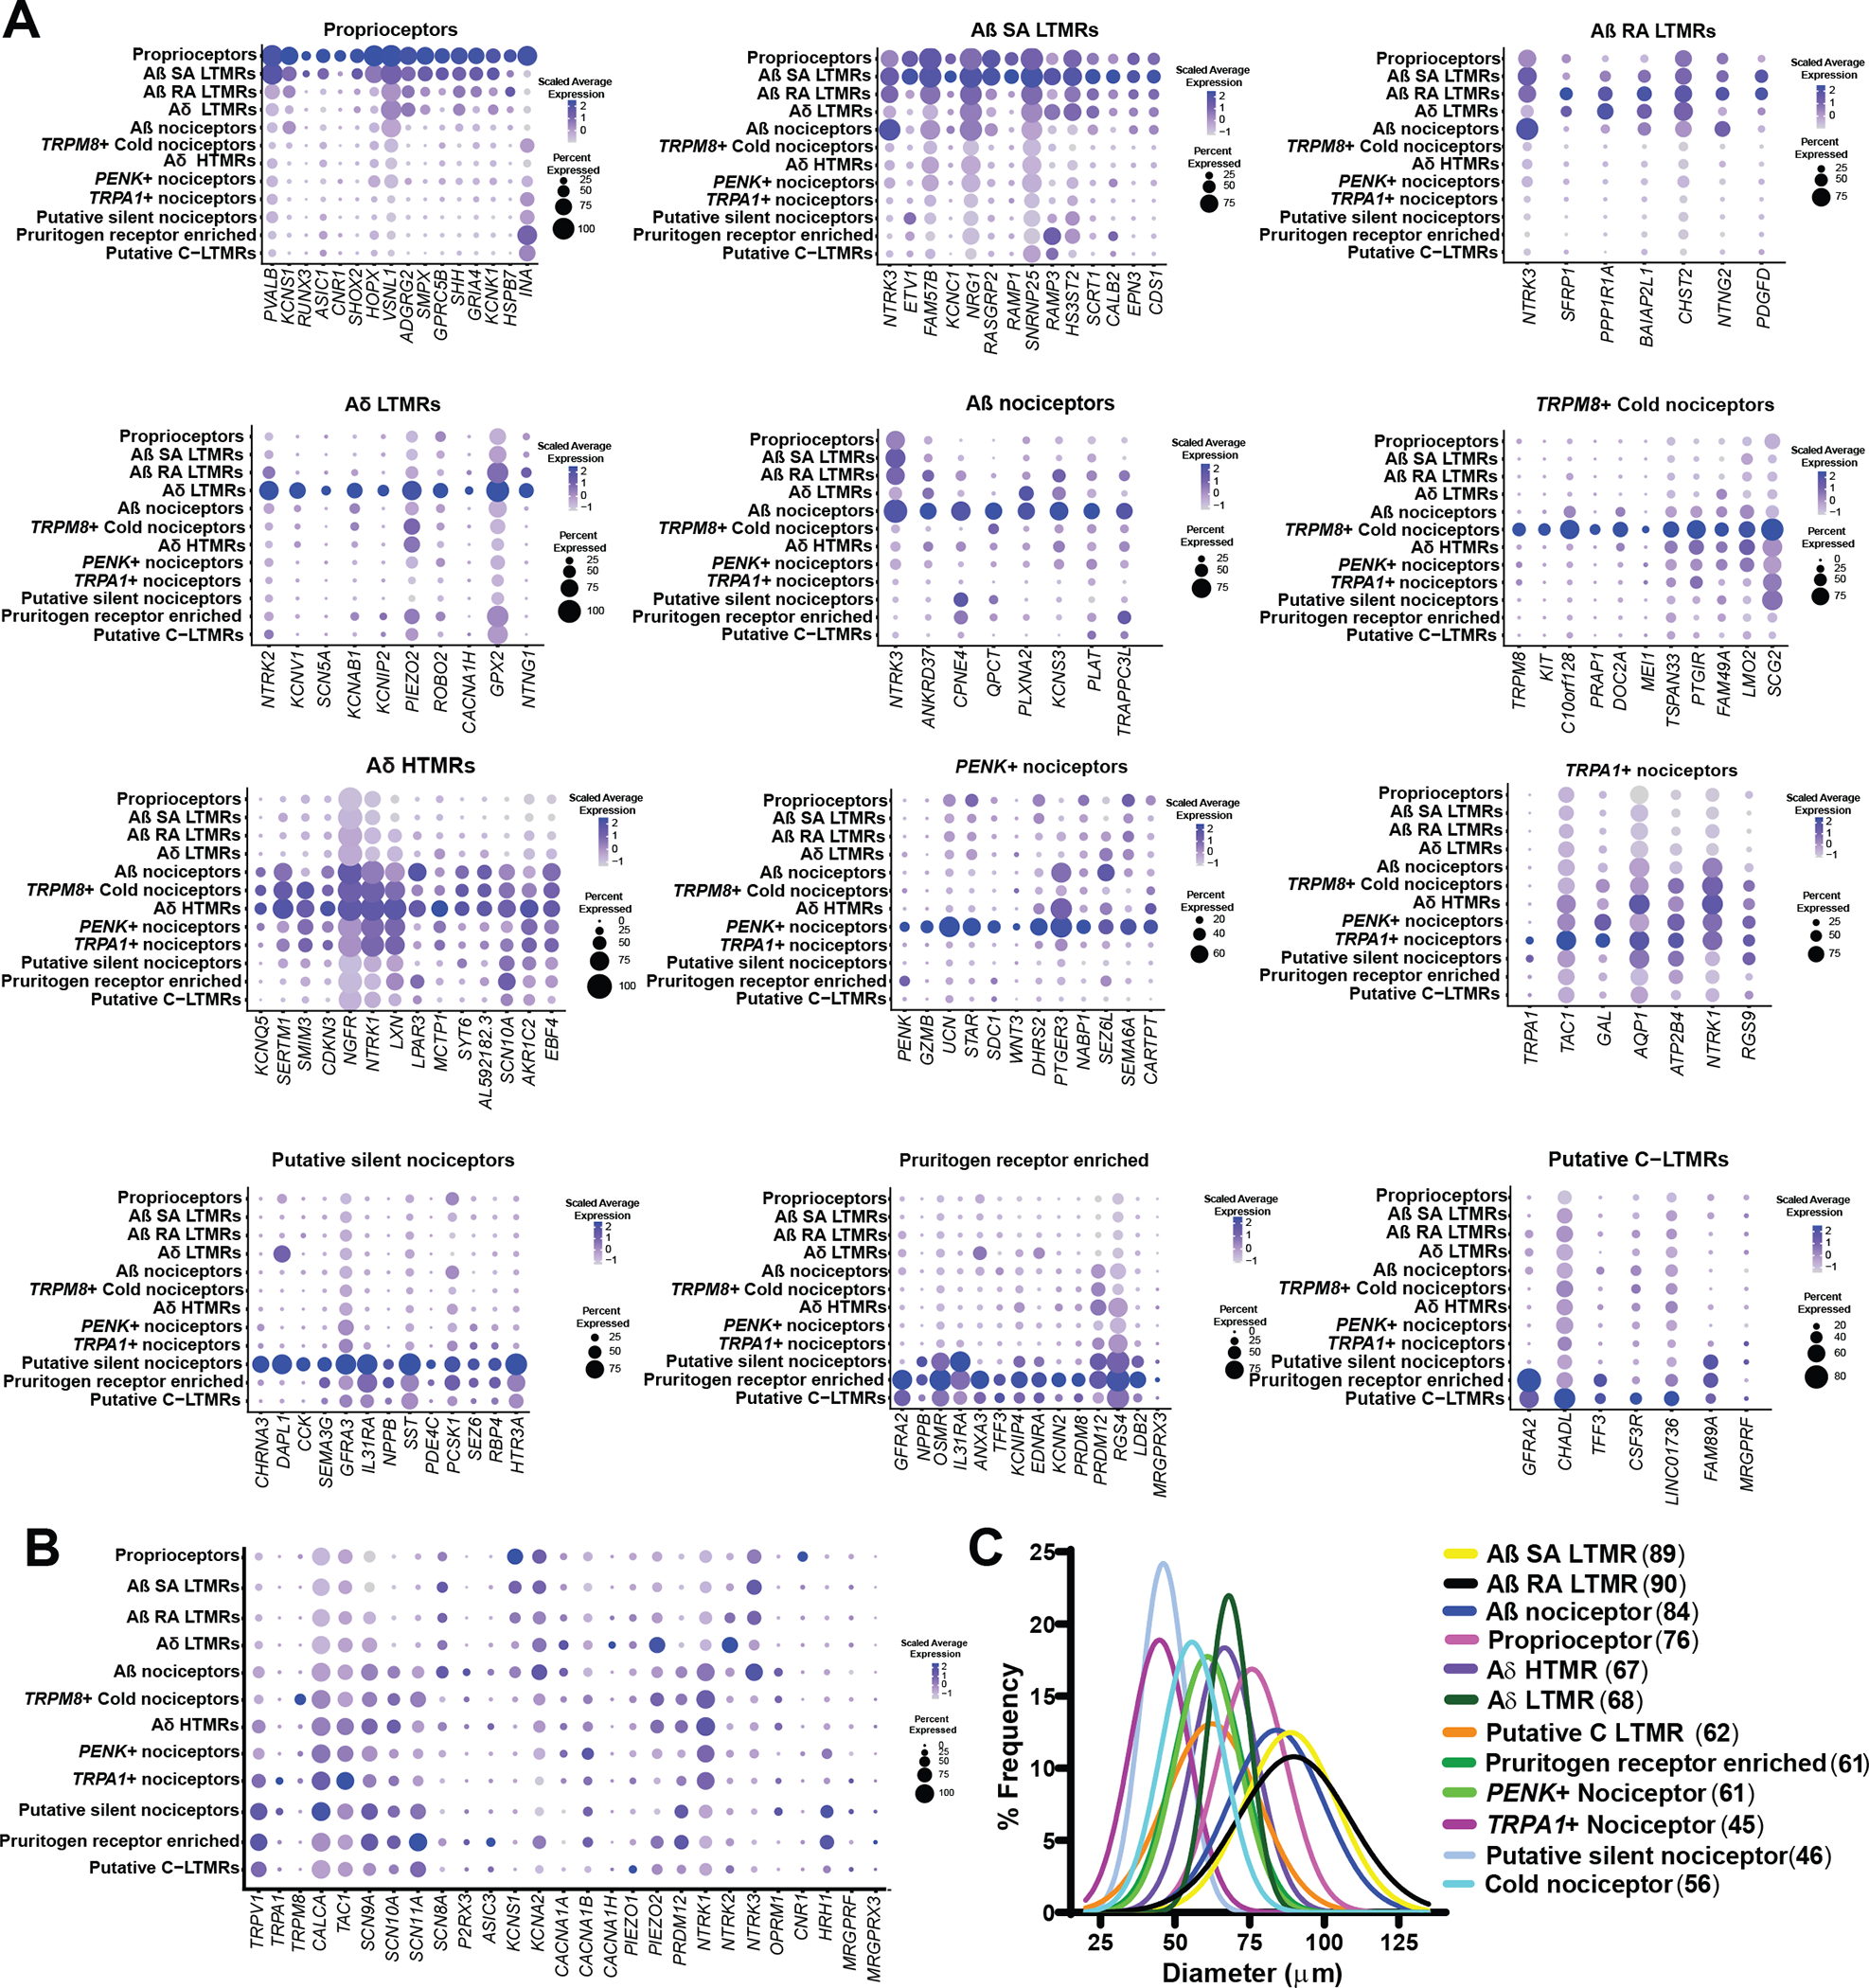
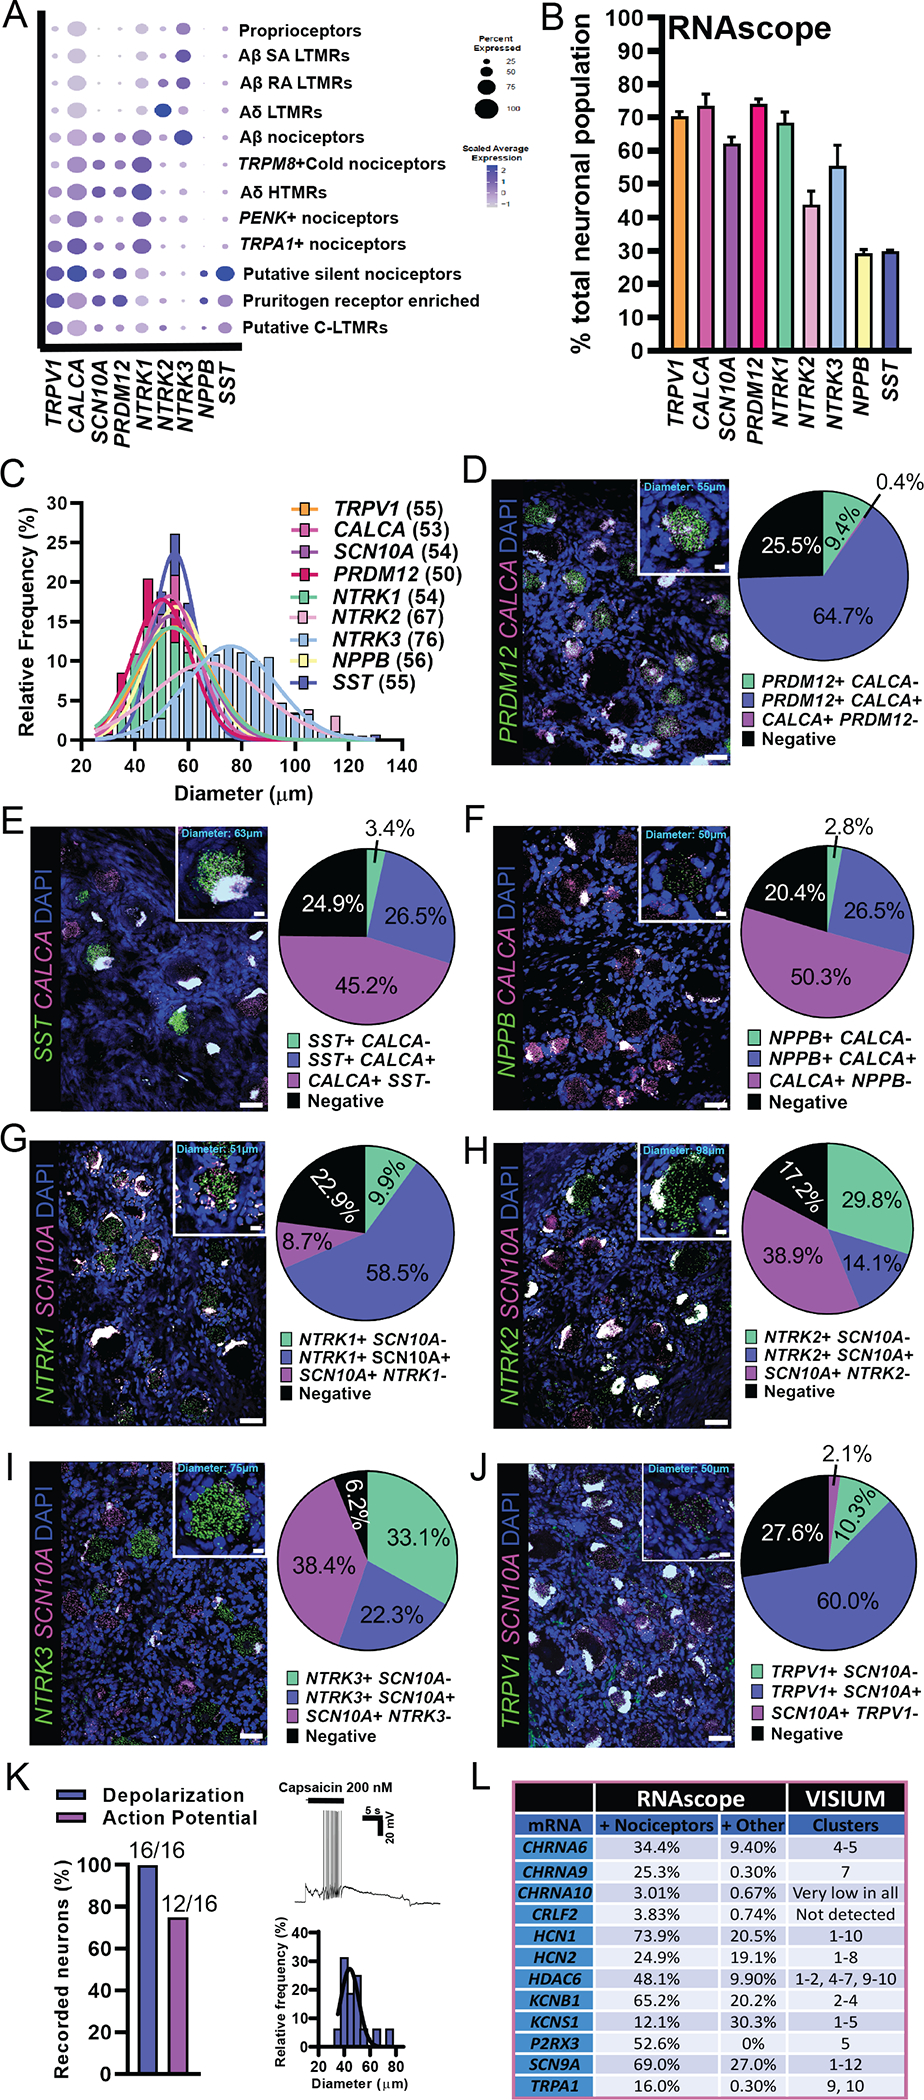
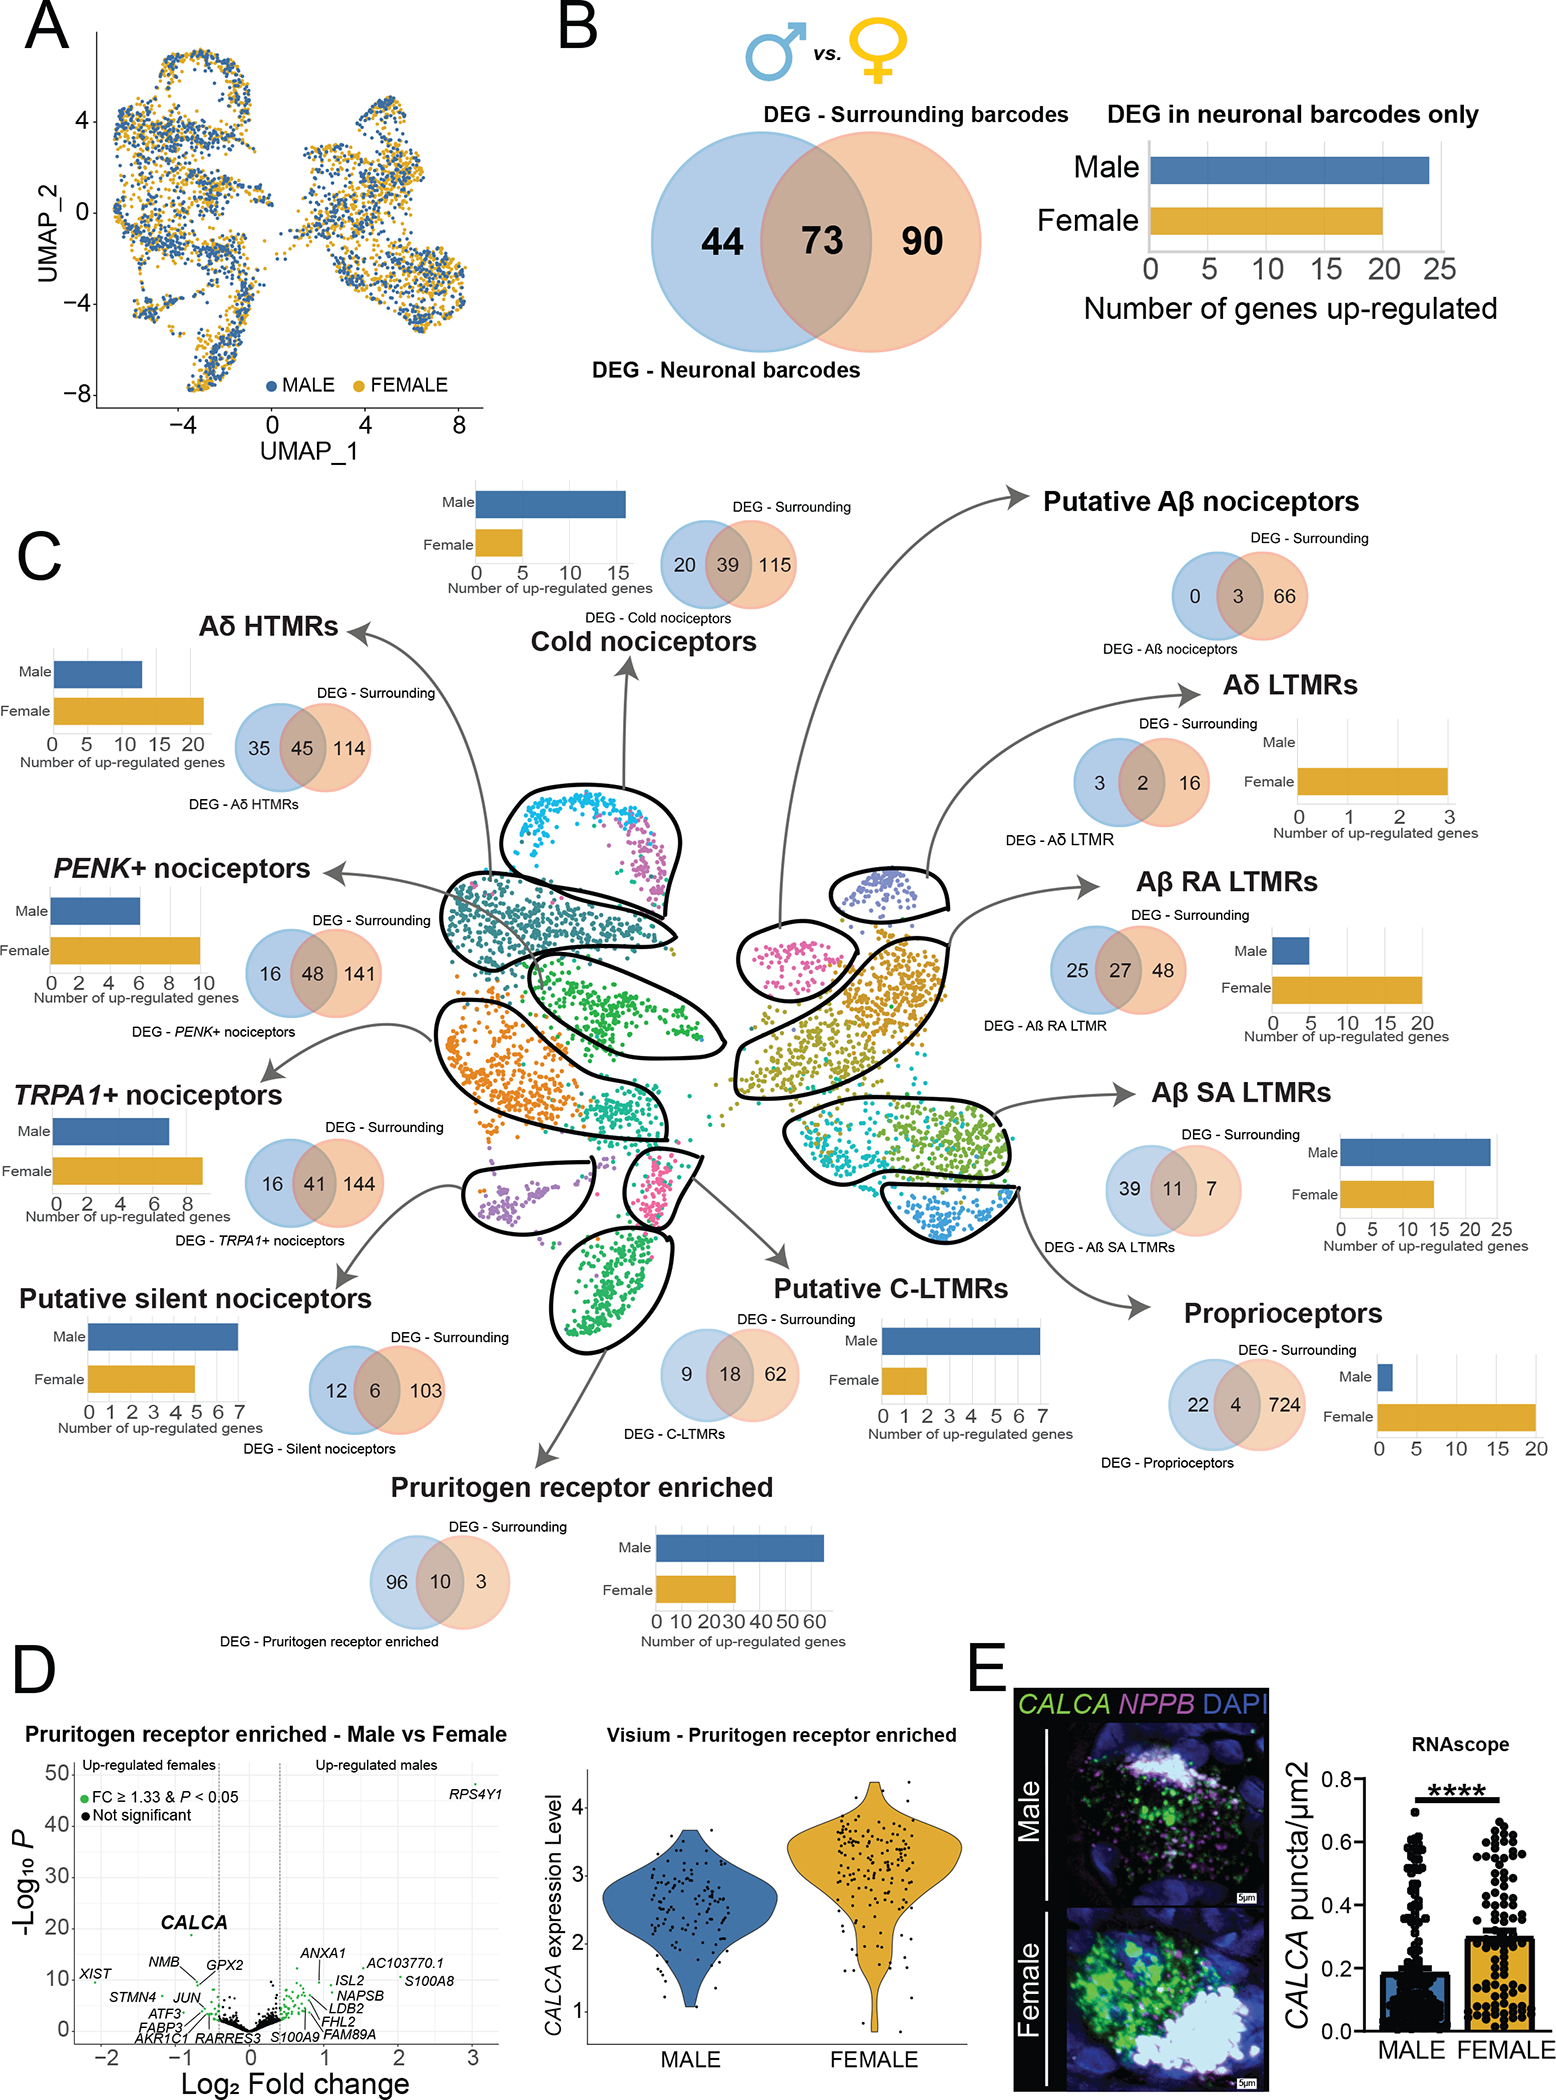
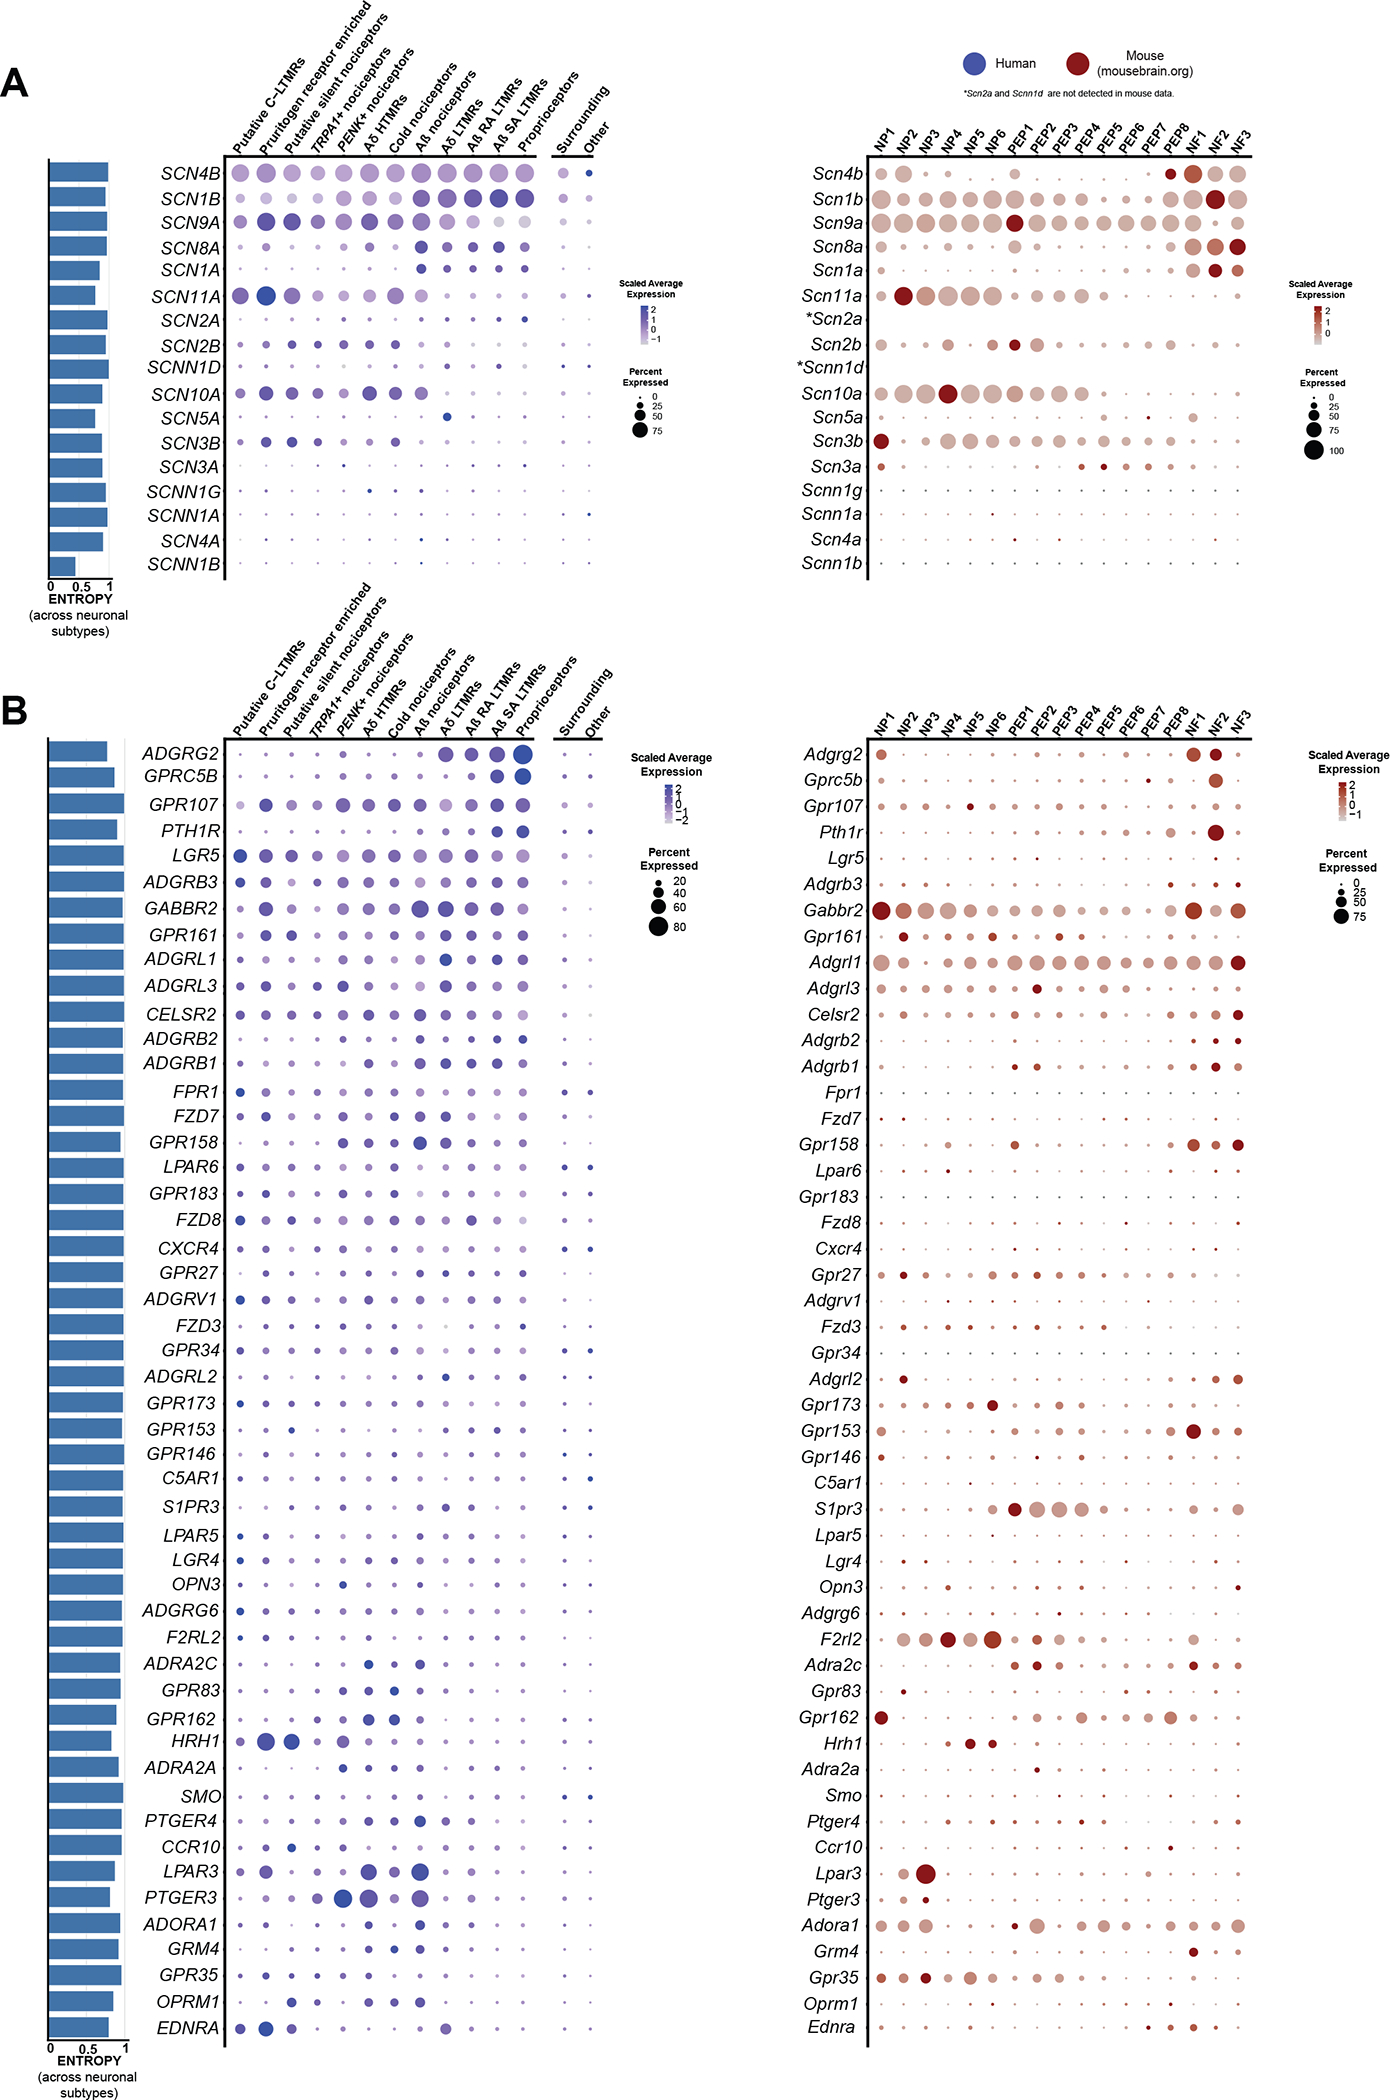
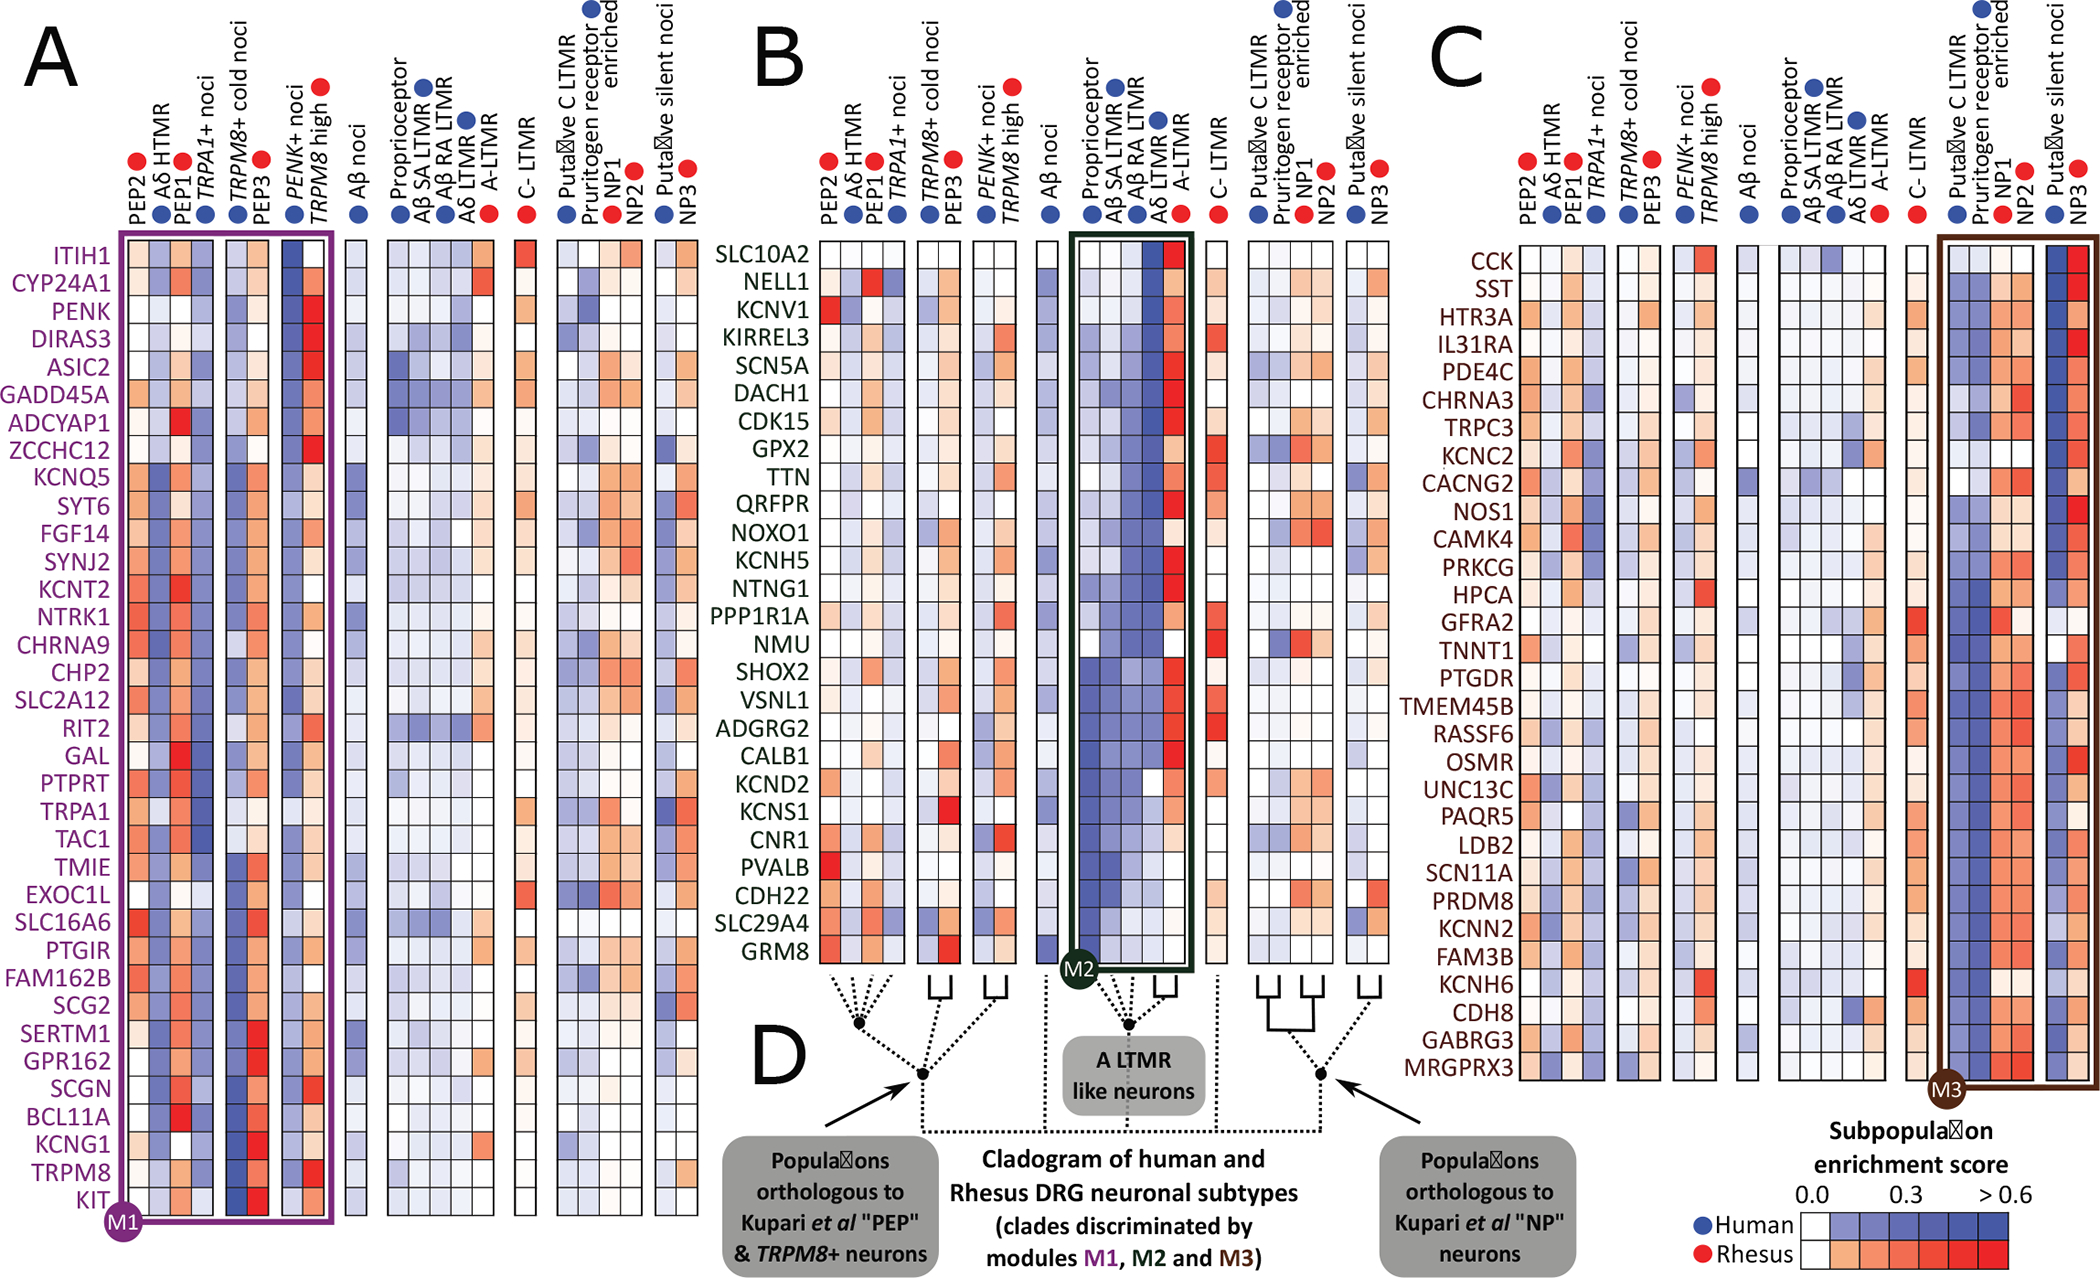
Nociceptors are specialized sensory neurons that detect damaging or potentially damaging stimuli and are found in the dorsal root ganglia (DRG) and trigeminal ganglia. These neurons are critical for the generation of neuronal signals that ultimately create the perception of pain. Nociceptors are also primary targets for treating acute and chronic pain. Single-cell transcriptomics on mouse nociceptors has transformed our understanding of pain mechanisms. We sought to generate equivalent information for human nociceptors with the goal of identifying transcriptomic signatures of nociceptors, identifying species differences and potential drug targets. We used spatial transcriptomics to molecularly characterize transcriptomes of single DRG neurons from eight organ donors. We identified 12 clusters of human sensory neurons, 5 of which are C nociceptors, as well as 1 C low-threshold mechanoreceptors (LTMRs), 1 Aβ nociceptor, 2 Aδ, 2 Aβ, and 1 proprioceptor subtypes. By focusing on expression profiles for ion channels, G protein-coupled receptors (GPCRs), and other pharmacological targets, we provided a rich map of potential drug targets in the human DRG with direct comparison to mouse sensory neuron transcriptomes. We also compared human DRG neuronal subtypes to nonhuman primates showing conserved patterns of gene expression among many cell types but divergence among specific nociceptor subsets. Last, we identified sex differences in human DRG subpopulation transcriptomes, including a marked increase in calcitonin-related polypeptide alpha (CALCA) expression in female pruritogen receptor-enriched nociceptors. This comprehensive spatial characterization of human nociceptors might open the door to development of better treatments for acute and chronic pain disorders.


Conflict of interest statement

Competing interests: D.T.-F. has an equity position in Doloromics. P.R.R. is a cofounder of Doloromics. A.W. is a cofounder of Doloromics. A.C. consults for Recens. P.M.D. consults for Grunenthal as well as Toray, Wex, and OliPass. R.W.G. is a cofounder and part owner of Neruolux. G.D. is a cofounder of Doloromics and Scientific Lead for Schedule 1 Therapeutics and consults for Abbvie. T.J.P. is a cofounder and has an equity position in Doloromics, 4E Therapeutics, and PARMedics and consults for Grunenthal. The authors declare that they have no other competing interest.

Figures

Fig. 1.
Fig. 1.. Identification of neuronal subtypes in human DRG using spatial transcriptomics.
(A) Overview of the workflow and analysis. Neuronal barcodes (barcoded spots that overlap single neurons) were manually selected in Loupe Browser and clustered using Seurat package in R. (B) UMAP plot showing the 16 clusters generated by Seurat’s workflow. (C) UMAP plots of the expression of gene markers that were used to label neuronal clusters. (D) UMAP plot showing the 12 labeled human DRG neuronal clusters that were curated from the original 16 clusters, which are still shown with color coding matching (B). (E) UMAP plot shows the contribution of each donor for cluster formation. The number of barcodes per donor used for clustering is in parenthesis. (F) Violin plots show consistent distributions of the number of detected genes (nFeature_RNA), the counts of unique RNA molecules (nCount_RNA), and the average expression for the neuronal marker SNAP25 across clusters. The numbers on the x axis correspond to cluster numbers.
Fig. 2.
Fig. 2.. Enriched gene expression in human DRG neuronal clusters and spatial visualization of neuronal subtypes.
(A) Dot plots showing the top genes for each neuronal subpopulation and how they are expressed across all clusters. The size of the dot represents the percentage of barcodes within a cluster, and the color corresponds to the average expression (scaled data) across all barcodes within a cluster for each gene shown. (B) Dot plot showing the expression of known pain genes and markers across clusters. (C) Neuronal clusters were mapped back to DRG sections to visualize neurons within the DRG. Diameters of neurons with visible nuclei were measured to ascertain and plot cell sizes for each cluster with mean diameter (in micrometers) shown in parentheses. Gaussian curve fits are shown for visualization purposes.
Fig. 3.
Fig. 3.. RNAscope in situ hybridization and functional validation on human DRG.
(A) Visualization of Visium gene expression for markers that were used for RNAscope analysis. (B) Percentage of neurons expressing each target compared to the total neuronal population. (C) Size distribution of all target-positive neurons. Gaussian mean in micrometer diameter in parentheses. (D to J) Merged image for the target of interest (green) with a nociceptor marker (magenta) and DAPI (blue) is shown. Scale bars, 50 μm. Inset for each panel shows a blowup of a single neuron. Scale bars, 10 μm. Population distribution of each neuronal marker is shown in the pie chart. (K) The TRPV1 agonist, capsaicin (200 nM), was applied to small-diameter human DRG neurons in vitro causing depolarization (100%) and action potential firing (75%). (L) RNAscope data are summarized from (8) and compared to findings from Visium sequencing. The neuronal cluster for each target is listed. Clusters: 1, proprioceptors; 2, Aβ SA LTMR; 3, Aβ RA LTMR; 4, Aδ LTMR; 5, Aβ nociceptors; 6, TRPM8+ cold nociceptors; 7, Aδ HTMR; 8, PENK+ nociceptors; 9, TRPA1+ nociceptors; 10, putative silent nociceptors; 11, pruritogen receptor enriched; 12, putative C-LTMRs.
Fig. 4.
Fig. 4.. Sex differences in gene expression within human DRG neuronal populations.
(A) UMAP showing male and female barcodes in all clusters. (B) Venn diagram showing the overlap between the number of DE genes in the overall neuronal population (blue, left) and the overall surrounding population of barcodes (beige, right). Bar plot shows the number of up-regulated genes per sex after removing genes that were also DE in surrounding barcodes. (C) Venn diagrams show the overlap between the number of DE genes in each neuronal subtype (blue, left) and the respective surrounding population (beige, right). Bar plots show the number of up-regulated genes per sex in each cluster after removing genes that were also DE in the respective surrounding barcodes. (D) Volcano plot shows DE genes in the pruritogen receptor–enriched population after removing DE genes in surrounding barcodes (we highlighted the top 10 genes in each sex ranked by log2 fold change). Violin plot shows CALCA expression in individual barcodes in males and females within the pruritogen receptor–enriched population. (E) RNAscope for CALCA mRNA colocalized with NPPB, a marker of pruritogen receptor–enriched nociceptors, with quantification of differences in expression between male and female neurons for amount of CALCA expression in the dot plot. Representative image scale bars, 5 μm. DEG, differentially expressed gene. Genes were considered to be DE if FC ≥ 1.33 and adjusted P < 0.05. ****P < 0.0001.
Fig. 5.
Fig. 5.. Expression of VGNaC channel and GPCR genes in human and mouse datasets.
(A) Dot plots showing the expression of VGNaC channel genes in human spatial transcriptomic (in blue) and mouse single-cell experiments (in red). (B) Dot plots showing the expression of GPCR genes in human spatial transcriptomic (in blue) and mouse single-cell experiments (in red). The size of the dot represents the percentage of barcodes within a cluster, and the color corresponds to the average expression (scaled data) across all barcodes within a cluster for each gene shown. Normalized entropy was used as a measure of “specificity of neuronal subtype”, where a score of 0 means a gene is specific to one neuronal subtype and 1 means that a gene has uniform distribution across neuronal subtypes.
Fig. 6.
Fig. 6.. Orthologous neuronal populations between human and macaque.
(A to C) Gene modules showing expression patterns of lineage-restricted human DRG neuronal genes that have high dynamic range of expression in macaque DRG neuronal populations (from Smart-seq2). (D) Orthology among neuronal populations based on the hDRG lineage-restricted genes, with strong orthologies indicated with solid lines.

References

    1. Scholz J, Woolf CJ, Can we conquer pain? Nat. Neurosci. 5 (Suppl), 1062–1067 (2002). - PubMed
    1. Edvinsson L, Haanes KA, Warfvinge K, Krause DN, CGRP as the target of new migraine therapies—Successful translation from bench to clinic. Nat. Rev. Neurol. 14, 338–350 (2018). - PubMed
    1. Mogil JS, The translatability of pain across species. Philos. Trans. R. Soc. Lond. B Biol. Sci. 374, 20190286 (2019). - PMC - PubMed
    1. Renthal W, Chamessian A, Curatolo M, Davidson S, Burton M, Dib-Hajj S, Dougherty PM, Ebert AD, Gereau R. W. t., Ghetti A, Gold MS, Hoben G, Menichella DM, Mercier P, Ray WZ, Salvemini D, Seal RP, Waxman S, Woolf CJ, Stucky CL, Price TJ, Human cells and networks of pain: Transforming pain target identification and therapeutic development. Neuron 109, 1426–1429 (2021). - PMC - PubMed
    1. Ray P, Torck A, Quigley L, Wangzhou A, Neiman M, Rao C, Lam T, Kim JY, Kim TH, Zhang MQ, Dussor G, Price TJ, Comparative transcriptome profiling of the human and mouse dorsal root ganglia: An RNA-seq-based resource for pain and sensory neuroscience research. Pain 159, 1325–1345 (2018). - PMC - PubMed

Publication types