. 2022 Feb 18;8(7):eabm1418.
doi: 10.1126/sciadv.abm1418. Epub 2022 Feb 16.

Thermostable ionizable lipid-like nanoparticle (iLAND) for RNAi treatment of hyperlipidemia

Affiliations

Thermostable ionizable lipid-like nanoparticle (iLAND) for RNAi treatment of hyperlipidemia

Bo Hu et al. Sci Adv. .

Abstract

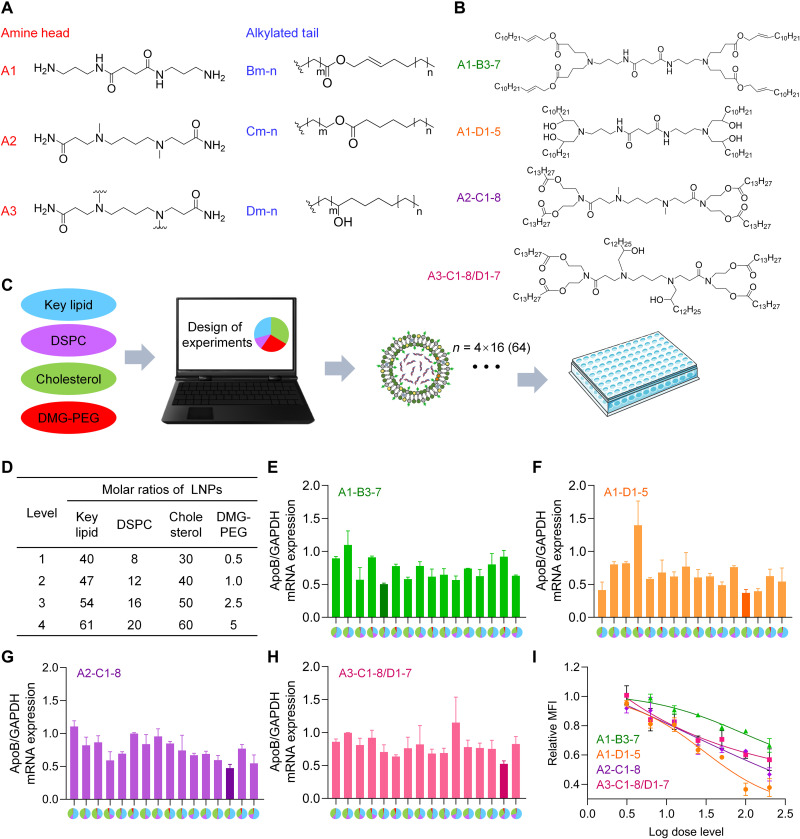
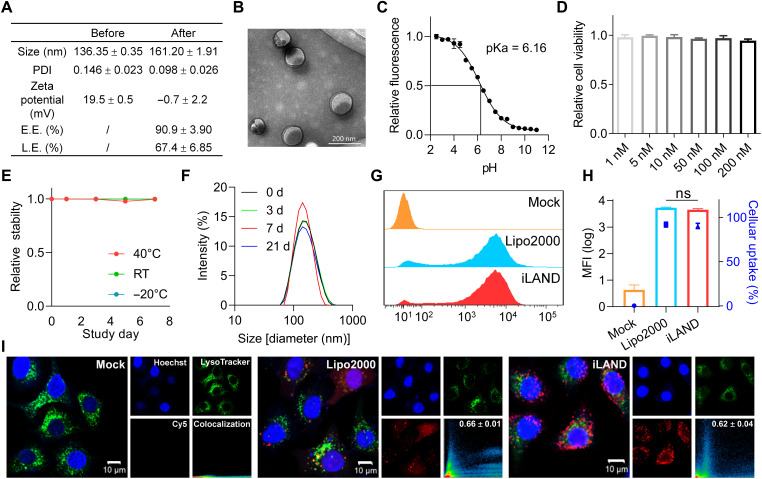
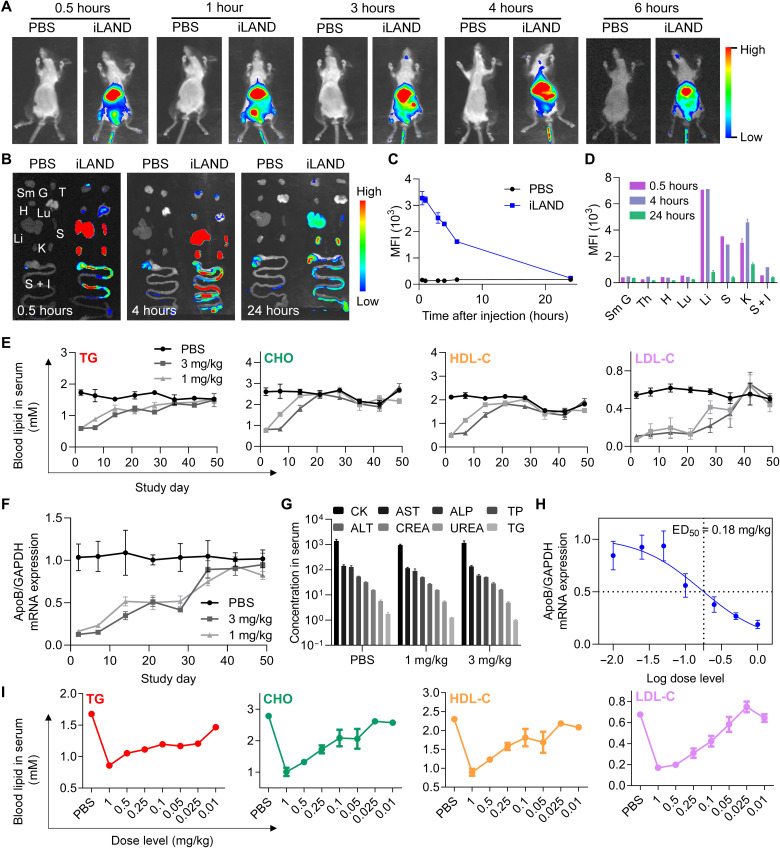
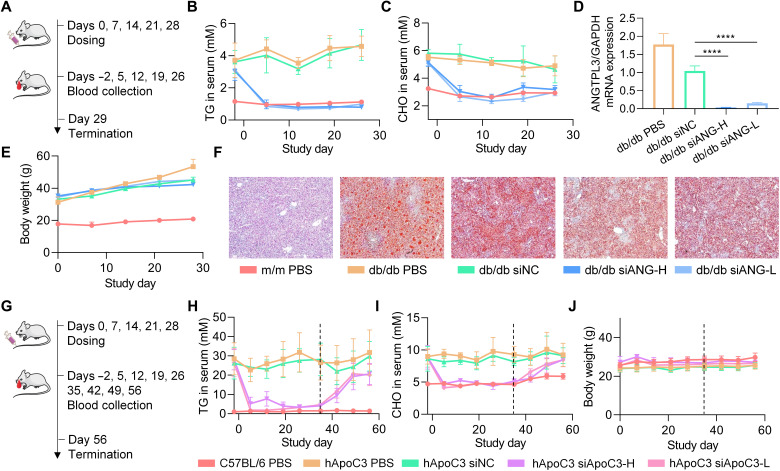
Small interfering RNA (siRNA) therapeutic is considered to be a promising modality for the treatment of hyperlipidemia. Establishment of a thermostable clinically applicable delivery system remains a most challenging issue for siRNA drug development. Here, a series of ionizable lipid-like materials were rationally designed; 4 panels of lipid formulations were fabricated and evaluated on the basis of four representative structures. The lead lipid (A1-D1-5) was stable at 40°C, and the optimized formulation (iLAND) showed dose and time dual-dependent gene silencing pattern with median effective dose of 0.18 mg/kg. In addition, potent and durable reduction of serum cholesterol and triglyceride were achieved by administering siRNAs targeting angiopoietin-like 3 or apolipoprotein C3 (APOC3) in high-fat diet-fed mice, db/db mice, and human APOC3 transgenic mice, respectively, accompanied by displaying ideal safety profiles. Therefore, siRNA@iLAND prepared with thermostable A1-D1-5 demonstrates substantial value for siRNA delivery, hyperlipidemia therapy, and prevention of subsequent metabolic diseases.


Figures

Fig. 1.
Fig. 1.. Screening and component optimization of novel iLNPs.
(A) The chemical structures of lipid building blocks, including three amine heads and three alkylated tails. (B) Chemical structures of four representative novel ionizable lipids evaluated in this study. (C) Optimization scheme of iLNPs. DOE was used to minimize the number of formulation candidates based on each lipid from 256 to 16. As a result, 64 formulations in total were prepared and evaluated in this study on the basis of four novel ionizable lipids, with 16 formulations for each ionizable lipid. (D) Levels of each component of iLNP calculated by molar ratio. (E to H) In vitro gene silencing efficiencies of 4 panels (64 in total) of formulations prepared with A1-B3-7 (E), A1-D1-5 (F) A2-C1-8 (G), and A3-C1-8/D1-7 (H), respectively. Transfection concentration of siRNA was 50 nM. Four colors in pie charts of the x axis represent four lipids used in LNP formulations. Blue, proposed ionizable lipid; purple, DSPC; green, CHO; red, DMG-PEG2000. The area percentage of each color in the pie charts represents the molar percentage of the lipid in the formulation. (I) Transfection efficiencies of four leading formulations selected from panels of (E), (F), (G), and (H), respectively. The transfections concentrations nM, respectively. GAPDH, glyceraldehyde phosphate dehydrogenase; MFI, mean fluorescence intensity.
Fig. 2.
Fig. 2.. Physicochemical property characterization of iLAND and its cellular uptake behavior.
(A) Physicochemical property characterization of iLAND before and after siRNA encapsulation, which includes the size, PDI, zeta potential, encapsulation efficiency (E.E.), and loading efficiency (L.E.). (B) TEM image of siRNA@iLAND. (C) TNS was used for pKa determination, and the pKa of iLAND was approximately 6.16. (D) Cell viabilities of siRNA@iLAND were evaluated by using HepG2 cells. n = 6. (E) Chemical stability of A1-D1-5 and (F) formulation stability of siRNA@iLAND. RT, room temperature. (G) Cellular uptake and (H) the MFI of siRNA@iLAND, comparison with siRNA@Lipo. (I) Subcellular localization of siRNA@iLAND or siRNA@Lipo2000. ns, not significant.
Fig. 3.
Fig. 3.. Mechanism exploration for iLAND-mediated siRNA transfection.
(A) Subcellular localization of Cy5-siRNA@iLAND in HepG2 cells receiving various treatments. (B) Relative MFI of Cy5-siRNA recorded in (A). (C) Cellular uptake of Cy5-siRNA@iLAND in HepG2 cells as recorded by fluorescence-activated cell sorting (FACS). (D) Quantitative analysis of (C). (E) Confocal observation of the internalization of Cy5-siRNA@iLAND in HeLa cells. ApoE and calreticulin were used to determine whether they bound with iLAND and facilitated the cellular entry of Cy5-siRNA@iLAND. DMEM, Dulbecco’s modified Eagle’s medium; FBSDMEM, DMEM containing 10% fetal bovine serum. (F) Quantitative analysis of the fluorescence intensity of siRNA as recorded in (E). (G and H) Cellular uptake of Cy5-siRNA@iLAND in HeLa cells as recorded by FACS. siRNA was transfected at a final concentration of 50 nM. Scale bars, 20 μm.
Fig. 4.
Fig. 4.. Intracellular trafficking and endosomal escape of siRNA@iLAND.
(A) Cellular uptake of Cy5-siRNA@iLAND in HepG2 cells at different transfection time points. (B) Intracellular fluorescence intensities of siRNA at different time points after transfection. (C) Colocalization between Cy5-siRNA and endosome or lysosome. The highest level occurred around 3 hours after transfection. (D) Influence of chloroquine and bafilomycin A1 on cellular entry and endosomal escape of siRNA@iLAND. (E and F) Colocalization analysis (E) and MFI of siRNA in cells (F) that recorded in (D). (G) Scheme of iLAND-mediated siRNA escape from endosome (or lysosome). siRNA was transfected at a final concentration of 50 nM. n = 6.
Fig. 5.
Fig. 5.. In vivo biodistribution and activity evaluation of siRNA@iLAND.
(A) Whole-body imaging of the mice at indicated time points after intravenous injection of 1× PBS or Cy5-siRNA@iLAND (2 mg/kg). (B) Fluorescent imaging of isolated organs at 0.5, 4, and 24 hours after injection. Sm G, submandibular gland; T, thymus; H, heart; Lu, lung; Li, liver; S, spleen; K, kidney; S + I, stomach and intestines. (C) Quantitative analysis of the fluorescence signal in the liver as recorded in whole-body imaging. (D) Quantitative analysis of the fluorescence signal in isolated organs at indicated time points. (E) Concentrations of TG, CHO, HDL-C, and LDL-C in serum specimens collected at indicated time points from the mice receiving a single dose of 1× PBS, 1 mg/kg siApoB@iLAND, or 3 mg/kg siApoB@iLAND. (F) ApoB mRNA expression in liver tissues collected in the assay of (E). At each time point, the animals were euthanized and the livers were collected. Then, total RNA was extracted for determination of mRNA expression. (G) Serum biochemistry analysis. Samples were collected from CD-1 mice receiving 1× PBS, 1 mg/kg siNC@iLAND, or 3 mg/kg siNC@iLAND. Eight parameters including creatine kinase (CK; U/liter), aspartate aminotransferase (AST; U/liter), alkaline phosphatase (ALP; U/liter), total protein (TP; g/liter), alanine aminotransferase (ALT; U/liter), serum creatinine (CREA; μM), urea nitrogen (UREA; μM), and TG (mM) were recorded. (H) ApoB mRNA expression in the mice receiving different doses of siApoB@iLAND complexes. The doses ranged from 0.01 to 1 mg/kg. (I) Serum lipid changes in the dose-dependent assay.
Fig. 6.
Fig. 6.. Efficacy studies of siANG@iLAND and siApoC3@iLAND in disease models.
(A) Treatment schedule of siANG@iLAND in db/db mice. (B and C) Levels of serum TG (B) and serum CHO (C) recorded during the treatment course. (D) ANGPTL3 mRNA expression determined by RT-qPCR at the end of study. (E) Body weight changes during the study. Serum specimens were collected after a 6-hour food fasting for determining the TG and CHO concentrations, and the body weights were recorded before food fasting. (F) Oil red O staining of the liver sections of each group. (G) Treatment schedule of siApoC3@iLAND in hApoC3-Tg mice. (H and I) Levels of serum TG (H) and serum CHO (I) recorded during the treatment and recovering courses. (J) Body weight changes during treatment and recovery periods.

References

    1. Yao Y. S., Li T. D., Zeng Z. H., Mechanisms underlying direct actions of hyperlipidemia on myocardium: An updated review. Lipids Health Dis. 19, 23 (2020). - PMC - PubMed
    1. Gaudet D., Alexander V. J., Baker B. F., Brisson D., Tremblay K., Singleton W., Geary R. S., Hughes S. G., Viney N. J., Graham M. J., Crooke R. M., Witztum J. L., Brunzell J. D., Kastelein J. J., Antisense inhibition of apolipoprotein C-III in patients with hypertriglyceridemia. N. Engl. J. Med. 373, 438–447 (2015). - PubMed
    1. Graham M. J., Lee R. G., Brandt T. A., Tai L. J., Fu W., Peralta R., Yu R., Hurh E., Paz E., McEvoy B. W., Baker B. F., Pham N. C., Digenio A., Hughes S. G., Geary R. S., Witztum J. L., Crooke R. M., Tsimikas S., Cardiovascular and metabolic effects of ANGPTL3 antisense oligonucleotides. N. Engl. J. Med. 377, 222–232 (2017). - PubMed
    1. Koene R. J., Prizment A. E., Blaes A., Konety S. H., Shared risk factors in cardiovascular disease and cancer. Circulation 133, 1104–1114 (2016). - PMC - PubMed
    1. Macchi C., Sirtori C. R., Corsini A., Santos R. D., Watts G. F., Ruscica M., A new dawn for managing dyslipidemias: The era of rna-based therapies. Pharmacol. Res. 150, 104413 (2019). - PubMed