

Sonoporation based on repeated vaporization of gold nanodroplets
- PMID: 35172015
- PMCID: PMC9450513
- DOI: 10.1002/mp.15544
Sonoporation based on repeated vaporization of gold nanodroplets
Abstract
Background: Gold nanodroplets (AuNDs) have been proposed as agents for photothermal therapy and photoacoustic imaging. Previously, we demonstrated that the sonoporation can be more effectively achieved with synchronized optical and acoustic droplet vaporization. By applying a laser pulse at the rarefactional phase of the ultrasound (US) pulse, the vaporization threshold can be reached at a considerably lower laser average power. However, a large loading quantity of the AuNDs may increase the risk of air embolism. The destruction of phase-shifted AuNDs at the inertial cavitation stage leads to a reduced drug delivery performance. And it also causes instability of echogenicity during therapeutic monitoring.
Purpose: In this study, we propose to further improve the sonoporation effectiveness with repeated vaporization. In other words, the AuNDs repeatedly undergo vaporization and recondensation so that sonoporation effects are accumulated over time at lower energy requirements. Previously, repeated vaporization has been demonstrated as an imaging contrast agent. In this study, we aim to adopt this repeated vaporization scheme for sonoporation.
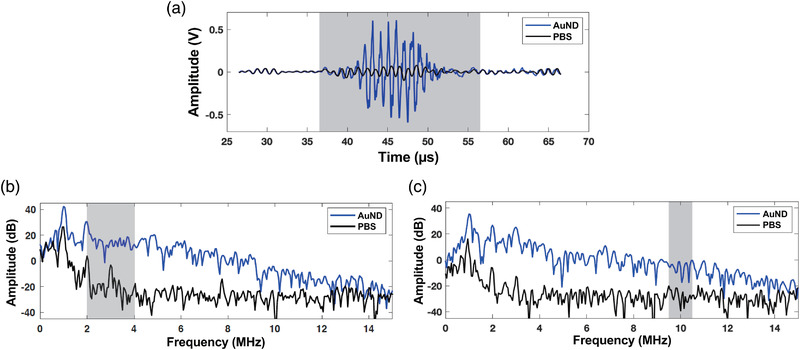
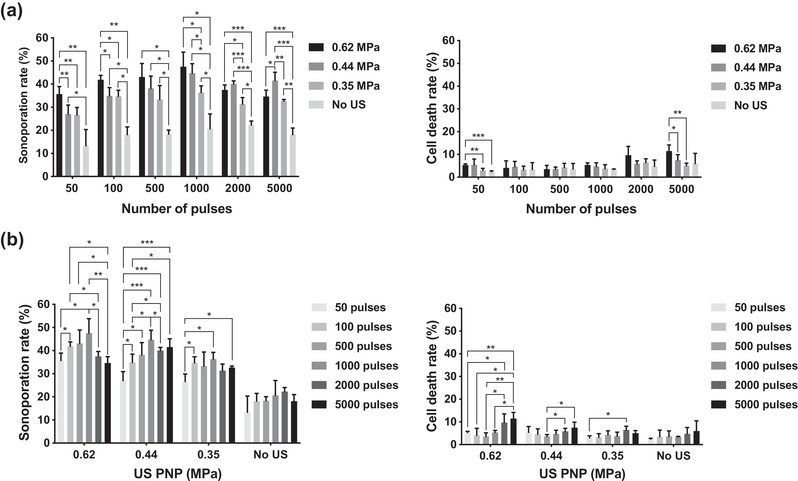
Methods: Perfluoropentane NDs with a shell made of human serum albumin were used as the US contrast agents. Laser pulses at 808 nm and US pulses of 1 MHz were delivered for triggering vaporization and inertial cavitation of NDs. We detected the vaporization and cavitation effects under different activation firings, US peak negative pressures (PNPs), and laser fluences using 5- and 10-MHz focused US receivers. Numbers of calcein-AM and propidium iodide signals uptake by BNL hepatocarcinoma cancer cells were used to evaluate the sonoporation and cell death rate of the cells.
Results: We demonstrate that sonoporation can be realized based on repeatable vaporization instead of the commonly adopted inertial cavitation effects. In addition, it is found that the laser fluence and the acoustic pressure can be reduced. As an example, we demonstrate that the acoustic and optical energy for achieving a similar level of sonoporation rate can be as low as 0.44 MPa for the US PNP and 4.01 mJ/cm2 for the laser fluence, which are lower than those with our previous approach (0.53 MPa and 4.95 mJ/cm2 , respectively).
Conclusion: We demonstrated the feasibility of vaporization-based sonoporation at a lower optical and acoustic energy. It is an advantageous method that can enhance drug delivery efficiency, therapeutic safety and potentially deliver an upgraded gene therapy strategy for improved theragnosis.
Keywords: acoustic droplet vaporization; gold nanodroplets; inertial cavitation; optical droplet vaporization; sonoporation.
© 2022 The Authors. Medical Physics published by Wiley Periodicals LLC on behalf of American Association of Physicists in Medicine.
Conflict of interest statement
The authors declare no conflict of interest.
Figures


Similar articles
-
Synchronized Optical and Acoustic Droplet Vaporization for Effective Sonoporation.Pharmaceutics. 2019 Jun 14;11(6):279. doi: 10.3390/pharmaceutics11060279. Pharmaceutics. 2019. PMID: 31197090 Free PMC article.
-
Nanodroplet-Vaporization-Assisted Sonoporation for Highly Effective Delivery of Photothermal Treatment.Sci Rep. 2016 Apr 20;6:24753. doi: 10.1038/srep24753. Sci Rep. 2016. PMID: 27094209 Free PMC article.
-
Control of Acoustic Cavitation for Efficient Sonoporation with Phase-Shift Nanoemulsions.Ultrasound Med Biol. 2019 Mar;45(3):846-858. doi: 10.1016/j.ultrasmedbio.2018.12.001. Epub 2019 Jan 11. Ultrasound Med Biol. 2019. PMID: 30638968 Free PMC article.
-
Bursting bubbles and bilayers.Theranostics. 2012;2(12):1140-59. doi: 10.7150/thno.4305. Epub 2012 Dec 11. Theranostics. 2012. PMID: 23382772 Free PMC article. Review.
-
Functional ultrasound-triggered phase-shift perfluorocarbon nanodroplets for cancer therapy.Ultrasound Med Biol. 2021 Aug;47(8):2064-2079. doi: 10.1016/j.ultrasmedbio.2021.04.003. Epub 2021 May 13. Ultrasound Med Biol. 2021. PMID: 33992473 Review.
References
-
- Kripfgans OD, Fowlkes JB, Miller DL, Eldevik OP, Carson PL. Acoustic droplet vaporization for therapeutic and diagnostic applications. Ultrasound Med Biol. 2000;26(7):1177‐1189. - PubMed
-
- Kripfgans OD, Fabiilli ML, Carson PL, Fowlkes JB. On the acoustic vaporization of micrometer‐sized droplets. J Acoust Soc Am. 2004;116(1):272‐281. - PubMed
-
- Pitt WG, Singh RN, Perez KX, Husseini GA, Jack DR. Phase transitions of perfluorocarbon nanoemulsion induced with ultrasound: a mathematical model. Ultrason Sonochem. 2014;21(2):879‐891. - PubMed
MeSH terms
Substances
Grants and funding
LinkOut - more resources
Full Text Sources
Medical
Research Materials
Miscellaneous
