. 2022 Mar 9;30(3):388-399.e3.
doi: 10.1016/j.chom.2022.02.003. Epub 2022 Feb 8.

Development of a T cell-based immunodiagnostic system to effectively distinguish SARS-CoV-2 infection and COVID-19 vaccination status

Affiliations

Development of a T cell-based immunodiagnostic system to effectively distinguish SARS-CoV-2 infection and COVID-19 vaccination status

Esther Dawen Yu et al. Cell Host Microbe. .

Abstract

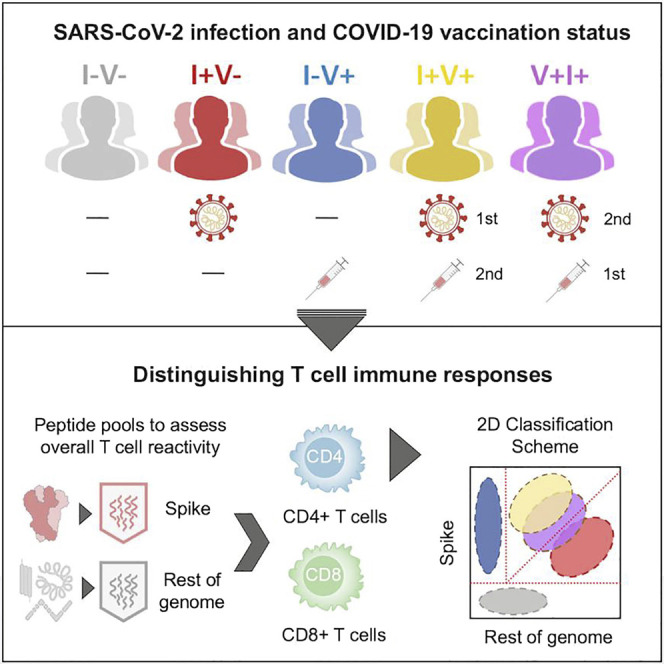
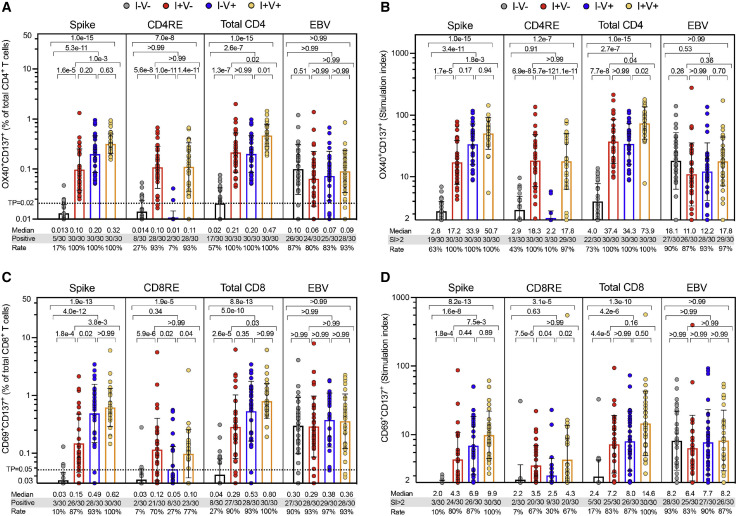
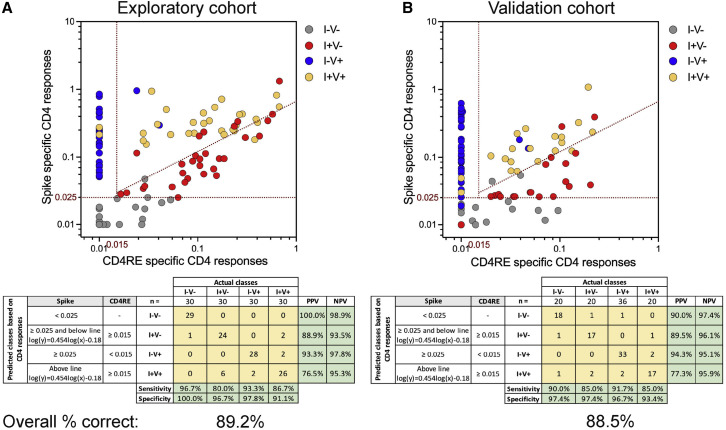
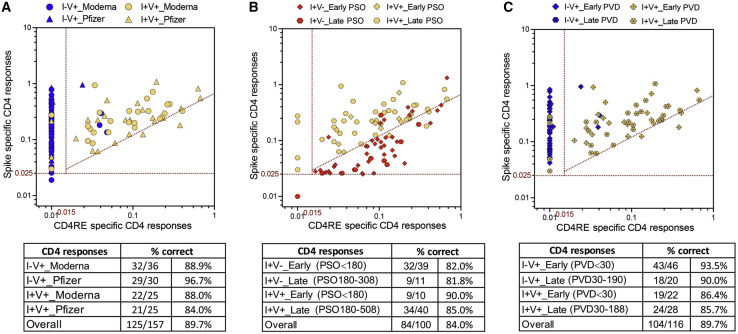
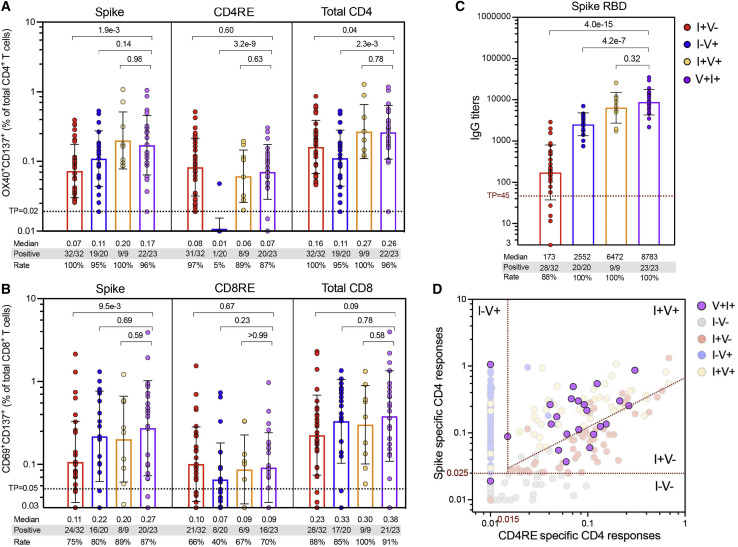
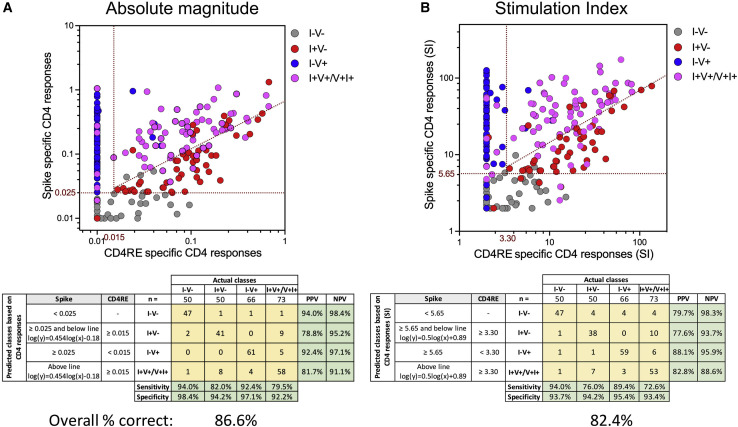
Both SARS-CoV-2 infections and COVID-19 vaccines elicit memory T cell responses. Here, we report the development of 2 pools of experimentally defined SARS-CoV-2 T cell epitopes that, in combination with spike, were used to discriminate 4 groups of subjects with different SARS-CoV-2 infection and COVID-19 vaccine status. The overall T cell-based classification accuracy was 89.2% and 88.5% in the experimental and validation cohorts. This scheme was applicable to different mRNA vaccines and different lengths of time post infection/post vaccination and yielded increased accuracy when compared to serological readouts. T cell responses from breakthrough infections were also studied and effectively segregated from vaccine responses, with a combined performance of 86.6% across all 239 subjects from the 5 groups. We anticipate that a T cell-based immunodiagnostic scheme to classify subjects based on their vaccination and natural infection history will be an important tool for longitudinal monitoring of vaccinations and for establishing SARS-CoV-2 correlates of protection.

Keywords: COVID-19; SARS-CoV-2; T cells; breakthrough infection; epitope; immunodiagnostic tool; vaccination; viruses.


Conflict of interest statement

Declaration of interests A. Sette is a consultant for Gritstone Bio, Flow Pharma, Arcturus Therapeutics, ImmunoScape, CellCarta, Avalia, Moderna, Fortress, and Repertoire. S.C. is a consultant for Avalia. La Jolla Institute for Immunology (LJI) has filed for patent protection for various aspects of SARS-CoV-2 epitope pools design. All other authors declare no conflict of interest.

Figures

None
Graphical abstract
Figure 1
Figure 1
SARS-CoV-2-specific CD4+ and CD8+ T cell responses in the study groups SARS-CoV-2-specific CD4+ and CD8+ T cell responses were measured as percentages of AIM+ (OX40+CD137+) CD4+ T cells (A and B) or AIM+ (CD69+CD137+) CD8+ T cells (C and D) after stimulation of PBMCs with peptides pools encompassing spike-only (Spike) MPs or the experimentally defined CD4RE and CD8RE MPs representing all the proteome without spike. EVB MP was used as a control. Graphs show individual response of spike, CD4RE, or CD8RE and the combination of both (total CD4+ or total CD8+) plotted as background subtracted (A and C) or as SI (B and D) against DMSO negative control. Geometric mean with standard deviation (SD) for the 4 different groups is shown. Kruskal-Wallis test adjusted with Dunn’s test for multiple comparisons was performed, and p values < 0.05 considered statistically significant. I−V−, unexposed and unvaccinated (n = 30); I+V−, infected and non-vaccinated (n = 30); I+V+, infected and then vaccinated (n = 30); I−V+, non-infected and vaccinated (n = 30). Threshold of positivity (TP) is indicated. Median response and the number or percentage of positive responding donors for each group is shown.
Figure 2
Figure 2
COVID-19 clinical classification scheme using SARS-CoV-2-specific CD4+ T cell responses CD4+ T cell responses to spike and CD4RE MPs were measured as percentage of AIM+ (OX40+CD137+) CD4+ T cells and plotted in 2 dimensions as absolute magnitude in order to discriminate the 4 study groups with known COVID-19 status of infection and/or vaccination in 2 independent cohorts: (A) exploratory cohort (n = 120) and (B) validation cohort (n = 96). I−V−, unexposed and unvaccinated (n = 30 and n = 20); I+V−, infected and non-vaccinated (n = 30 and n = 20); I+V+, infected and then vaccinated (n = 30 and n = 20); I−V+, non-infected and vaccinated (n = 30 and n = 36). Red dotted lines indicate specific cutoffs. Table inserts depict the diagnostic exam results in 4×4 matrix. Sensitivity, specificity, PPV, NPV, and overall percentage of subjects classified correctly is shown.
Figure 3
Figure 3
COVID-19 clinical classification scheme is applicable to different mRNA vaccines and different lengths of time post infection/post vaccination CD4+ T cell responses to spike and CD4RE MPs were measured as percentage of AIM+ (OX40+CD137+) CD4+ T cells and plotted in 2 dimensions as absolute magnitude in order to discriminated between (A) different types of mRNA vaccines (Moderna versus Pfzier) among vaccinated groups (I−V+ and I+V+), (B) different lengths of time post infection among infected groups (I+V− and I+V+), and (C) different lengths of time post vaccination among vaccinated groups (I−V+ and I+V+). Early infection, PSO ≤ 180; late infection, PSO > 180; early post vaccination, PVD ≤ 30; late post vaccination, PVD > 30. I−V+, non-infected and vaccinated (n = 66); I+V−, infected and non-vaccinated (n = 50); I+V+, infected and then vaccinated (n = 50). Red dotted lines indicate specific cutoffs. Table inserts depict the overall percentage of subjects classified correctly.
Figure 4
Figure 4
SARS-CoV-2 T cell and antibody response in breakthrough infection cases: comparison to other study groups (A and B) SARS-CoV-2-specific T cell responses were measured as percentage of (A) AIM+ (OX40+CD137+) CD4+ T cells or (B) AIM+ (CD69+CD137+) CD8+ T cells after stimulation of PBMCs with spike and CD4RE or CD8RE peptide pools. (C) Comparison of anti-spike RBD IgG titers in the plasma of the different study groups. For both T cell and antibody determinations, only donors matching the V+I+ intervals of vaccination and infection (55–271 and 18–93 days, respectively) were plotted. (A-C) Graph bars show geometric mean with SD. Threshold of positivity (TP), median response, and the number or percentage of positive responding donors for each group is indicated. Kruskal-Wallis test adjusted with Dunn’s test for multiple comparisons was performed, and p values < 0.05 considered statistically significant. (D) V+I+ CD4+ T cell responses plotted using the two-dimensional classification scheme with the specific cutoffs attributed to the different study groups (red dotted lines). I−V−, unexposed and unvaccinated (n = 50); I+V−, infected and non-vaccinated (n = 50); I+V+, infected and then vaccinated (n = 50); I−V+, non-infected and vaccinated (n = 66); V+I+, vaccinated and then infected (n = 23).
Figure 5
Figure 5
Overall COVID-19 clinical classification scheme (A and B) CD4+ T cell responses to spike and CD4RE MPs were measured as percentage of AIM+ (OX40+CD137+) CD4+ T cells and plotted in two dimensions as (A) SFCs per million PBMCs or (B) stimulation index (SI), in order to discriminate the 5 study groups with known COVID-19 status of infection and/or vaccination. I−V−, unexposed and unvaccinated (n = 50); I+V−, infected and non-vaccinated (n = 50); I−V+, non-infected and vaccinated (n = 66); I+V+/V+I+, infected and then vaccinated (I+V+, n = 50) merged with vaccinated and then infected (V+I+, n = 23). Red dotted lines indicate specific cutoffs. Table inserts depict the diagnostic exam results in 4×4 matrix. Sensitivity, specificity, PPV, NPV of all the subjects that participated in this study (n = 239), and overall percentage classified correctly is shown.

References

    1. Bergwerk M., Gonen T., Lustig Y., Amit S., Lipsitch M., Cohen C., Mandelboim M., Levin E.G., Rubin C., Indenbaum V., et al. Covid-19 Breakthrough Infections in Vaccinated Health Care Workers. N. Engl. J. Med. 2021;385:1474–1484. - PMC - PubMed
    1. Bertoletti A., Le Bert N., Qui M., Tan A.T. SARS-CoV-2-specific T cells in infection and vaccination. Cell. Mol. Immunol. 2021;18:2307–2312. - PMC - PubMed
    1. Carrasco Pro S., Sidney J., Paul S., Lindestam Arlehamn C., Weiskopf D., Peters B., Sette A. Automatic Generation of Validated Specific Epitope Sets. J. Immunol. Res. 2015;2015:763461. - PMC - PubMed
    1. Cohen K.W., Linderman S.L., Moodie Z., Czartoski J., Lai L., Mantus G., Norwood C., Nyhoff L.E., Edara V.V., Floyd K., et al. Longitudinal analysis shows durable and broad immune memory after SARS-CoV-2 infection with persisting antibody responses and memory B and T cells. Cell Rep Med. 2021;2:100354. - PMC - PubMed
    1. Collier A.Y., Brown C.M., McMahan K., Yu J., Liu J., Jacob-Dolan C., Chandrashekar A., Tierney D., Ansel J.L., Rowe M., et al. Immune Responses in Fully Vaccinated Individuals Following Breakthrough Infection with the SARS-CoV-2 Delta Variant in Provincetown, Massachusetts. medRxiv. 2021 doi: 10.1101/2021.10.18.21265113. Preprint at. - DOI - PMC - PubMed

Publication types