. 2022 Feb 16;21(1):51.
doi: 10.1186/s12936-022-04073-1.

5WBF: a low-cost and straightforward whole blood filtration method suitable for whole-genome sequencing of Plasmodium falciparum clinical isolates

Affiliations

5WBF: a low-cost and straightforward whole blood filtration method suitable for whole-genome sequencing of Plasmodium falciparum clinical isolates

Romain Coppée et al. Malar J. .

Abstract

Background: Whole-genome sequencing (WGS) is becoming increasingly helpful to assist malaria control programmes. A major drawback of this approach is the large amount of human DNA compared to parasite DNA extracted from unprocessed whole blood. As red blood cells (RBCs) have a diameter of about 7-8 µm and exhibit some deformability, it was hypothesized that cheap and commercially available 5 µm filters might retain leukocytes but much less of Plasmodium falciparum-infected RBCs. This study aimed to test the hypothesis that such a filtration method, named 5WBF (for 5 µm Whole Blood Filtration), may provide highly enriched parasite material suitable for P. falciparum WGS.

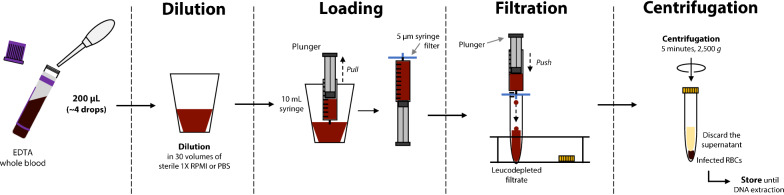
Methods: Whole blood was collected from five patients experiencing a P. falciparum malaria episode (ring-stage parasitaemia range: 0.04-5.5%) and from mock samples obtained by mixing synchronized, ring-stage cultured P. falciparum 3D7 parasites with uninfected human whole blood (final parasitaemia range: 0.02-1.1%). These whole blood samples (50 to 400 µL) were diluted in RPMI 1640 medium or PBS 1× buffer and filtered with a syringe connected to a 5 µm commercial filter. DNA was extracted from 5WBF-treated and unfiltered counterpart blood samples using a commercial kit. The 5WBF method was evaluated on the ratios of parasite:human DNA assessed by qPCR and by sequencing depth and percentages of coverage from WGS data (Illumina NextSeq 500). As a comparison, the popular selective whole-genome amplification (sWGA) method, which does not rely on blood filtration, was applied to the unfiltered counterpart blood samples.

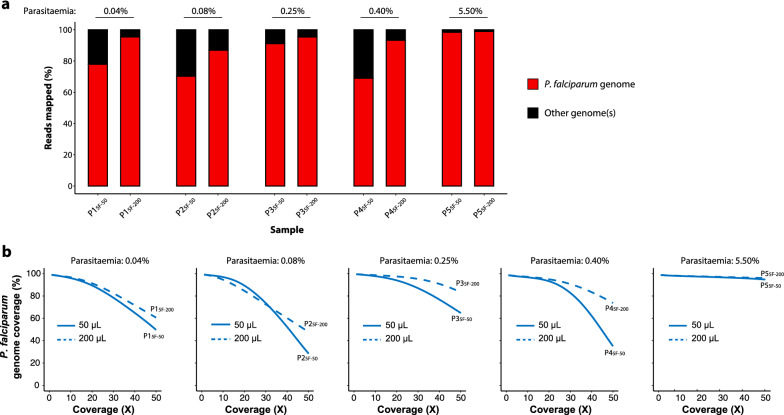
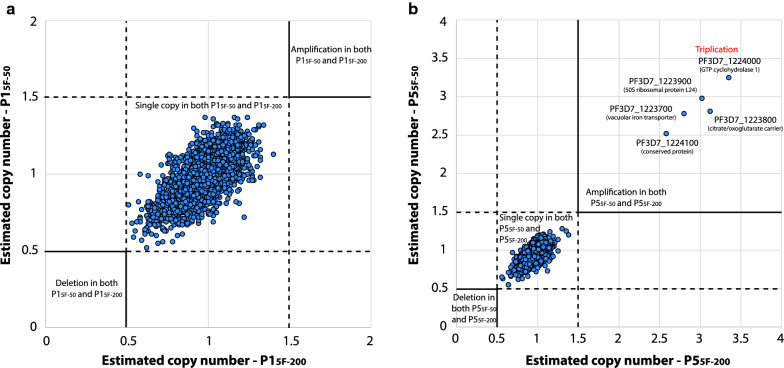
Results: After applying 5WBF, qPCR indicated an average of twofold loss in the amount of parasite template DNA (Pf ARN18S gene) and from 4096- to 65,536-fold loss of human template DNA (human β actin gene). WGS analyses revealed that > 95% of the parasite nuclear and organellar genomes were all covered at ≥ 10× depth for all samples tested. In sWGA counterparts, the organellar genomes were poorly covered and from 47.7 to 82.1% of the nuclear genome was covered at ≥ 10× depth depending on parasitaemia. Sequence reads were homogeneously distributed across gene sequences for 5WBF-treated samples (n = 5460 genes; mean coverage: 91×; median coverage: 93×; 5th percentile: 70×; 95th percentile: 103×), allowing the identification of gene copy number variations such as for gch1. This later analysis was not possible for sWGA-treated samples, as a much more heterogeneous distribution of reads across gene sequences was observed (mean coverage: 80×; median coverage: 51×; 5th percentile: 7×; 95th percentile: 245×).

Conclusions: The novel 5WBF leucodepletion method is simple to implement and based on commercially available, standardized 5 µm filters which cost from 1.0 to 1.7€ per unit depending on suppliers. 5WBF permits extensive genome-wide analysis of P. falciparum ring-stage isolates from minute amounts of whole blood even with parasitaemias as low as 0.02%.

Keywords: Filtration; Leucodepletion; Malaria; Plasmodium falciparum; Whole-genome sequencing.


Conflict of interest statement

The authors declare that they have no competing interests.

Figures

Fig. 1
Fig. 1
Main steps of 5WBF. From 50 to 400 µL of whole blood were diluted in RPMI 1640 medium or PBS 1× buffer in a large flask. The cartoon shows 200 µL of whole blood as an example. The diluted sample was loaded into a 10 mL syringe before the 5 μm filter was connected to the syringe. The blood was filtered by very gentle pressure (ideally, drop by drop) with the syringe plunger, until the plunger reached the bottom of the syringe to recover the maximum of infected RBCs. The filtration step itself is rapid and takes about 1 to 3 min. The filtrate was centrifuged at 2500g for 5 min and the supernatant was discarded. The pellet was suspended with ~ one pellet volume of RPMI 1640 or PBS 1×, transferred into a 1.5 mL tube, and stored until DNA extraction. (i) from the experiments, the filter dead volume was about 200 µL (reported as 100–150 µL by the manufacturer); (ii) even after the 2 mL optional wash with RPMI/PBS, the filter had a red colour indicating some retained RBCs or haemolysis during filtration; RBCs loss seems low although no precise quantification was done; (iii) the harder the push with the syringe plunger, the more haemolysis occurs; (iv) even with gentle push, some haemolysis can occur with some clinical samples and the filtrated pellet after centrifugation was slightly smaller, but WGS data were fine; (v) on some occasions, an air bubble could block the filter; then a slight flick at the bottom of the syringe (close to the filter) was applied; and (vi) for practical reason, a slightly different protocol was also tested in which the diluted blood sample was loaded into a 10 mL syringe after the 5 µm filter was connected to the syringe (Additional file 1: Fig. S1); similar results were obtained than with the protocol described in this Fig. 1
Fig. 2
Fig. 2
Proportions of mapped reads and P. falciparum genome coverage from mock whole blood samples. a Proportion of reads mapping to the P. falciparum nuclear and organellar genomes. Red and black colours indicate the proportion of reads mapping and not mapping to the P. falciparum genomes respectively. b Genome fraction coverage from 1× to 50× depth. Data from sWGA- and 5WBF-treated samples are indicated in dashed and solid lines, respectively. Three independent 5WBF blood filtration replicates were made for each parasitaemia
Fig. 3
Fig. 3
Comparison of gene coverage depth between M2WGA and M2-15F mock samples. a Coverage depth and gene percentage covered at ≥ 10× depth of all genes for M2-15F. Each blue point corresponds to a gene. Mitochondrial genes were discarded for ease of representation. The insert table indicates the mean coverage and the percentage of genes covered at ≥ 10× depth for five drug resistance genes. Descriptive statistics on the right table included the total number of P. falciparum (3D7) genes, the number of genes fully covered at ≥ 10× depth, the mean and median coverage of all genes, and the 5th and 95th percentiles of coverage depth. Genes were partitioned as of either nuclear, mitochondrial, or apicoplast origins. b Coverage depth of all genes for M2WGA. Description of the plot and the tables are the same as in a
Fig. 4
Fig. 4
Distribution of the reads along the 14 chromosomes of the P. falciparum nuclear genome for M2-15F and M2WGA mock samples. The three rings represent, from outermost to innermost, the 14 chromosomes of the P. falciparum nuclear genome (illustrated to scale in kb), and the average read depth within 1-kb windows for M2-15F and for M2WGA, respectively. For ease of representation, the maximum depth for M2-15F and M2WGA was fixed at 200× and 500×, respectively
Fig. 5
Fig. 5
Proportions of mapped reads and P. falciparum genome coverage from clinical samples. a Proportion of reads mapping to the P. falciparum nuclear and organellar genomes. Red and black colours respectively indicate the proportion of reads mapping and not mapping to the P. falciparum genomes. b Genome fraction coverage from 1× to 50× depth. Data from 50 µL and 200 µL of filtered whole blood are indicated in solid and dashed lines, respectively
Fig. 6
Fig. 6
Comparison of gene coverage depth between P15F-50 and P15F-200 5WBF-treated clinical samples. a Coverage depth and gene percentage covered at ≥ 10× depth of all genes for P15F-50. Each blue point corresponds to a gene. Mitochondrial genes were discarded for ease of representation. The insert table indicates the mean coverage and the percentage of gene covered at ≥ 10× depth of five drug resistance genes. Descriptive statistics on the right table included the total number of P. falciparum (3D7) genes, the number of genes fully covered at ≥ 10× depth, the mean and median coverage of all genes, and the 5th and 95th percentiles of coverage depth. Genes were partitioned as of either nuclear, mitochondrial, or apicoplast origins. b Coverage depth of all genes for P15F-200. Description of the plot and the tables are the same as in a
Fig. 7
Fig. 7
Estimation of per-gene copy number for clinical samples using WGS data and the PlasmoCNVScan program. Per-gene copy number was shown for the P15F-50 and P15F-200 samples (a), and for the P55F-50 and P55F-200 samples (b). Each point corresponds to a gene. A value < 0.5 suggests a gene deletion, while a value > 1.5 suggests a gene amplification. Values between 0.5 and 1.5 suggests a single copy gene. A positive correlation was observed for gene copy numbers estimated using 50 µL and 200 µL of blood for a same isolate (Spearman’s rank correlation: p < 0.001 and r = 0.72 for the P15F-50 and P15F-200 paired samples; p < 0.001 and r = 0.84 for the P55F-50 and P55F-200 paired samples)

References

    1. Ng PC, Kirkness EF. Whole genome sequencing. Methods Mol Biol. 2010;628:215–226. doi: 10.1007/978-1-60327-367-1_12. - DOI - PubMed
    1. Manske M, Miotto O, Campino S, Auburn S, Almagro-Garcia J, Maslen G, et al. Analysis of Plasmodium falciparum diversity in natural infections by deep sequencing. Nature. 2012;487:375–379. doi: 10.1038/nature11174. - DOI - PMC - PubMed
    1. Amambua-Ngwa A, Amenga-Etego L, Kamau E, Amato R, Ghansah A, Golassa L, et al. Major subpopulations of Plasmodium falciparum in sub-Saharan Africa. Science. 2019;365:813–816. doi: 10.1126/science.aav5427. - DOI - PubMed
    1. Ariey F, Witkowski B, Amaratunga C, Beghain J, Langlois A-C, Khim N, et al. A molecular marker of artemisinin-resistant Plasmodium falciparum malaria. Nature. 2014;505:50–55. doi: 10.1038/nature12876. - DOI - PMC - PubMed
    1. MalariaGEN Plasmodium falciparum Community Project Genomic epidemiology of artemisinin resistant malaria. Elife. 2016;5:e08714. doi: 10.7554/eLife.08714. - DOI - PMC - PubMed