

Integrating single-cell sequencing data with GWAS summary statistics reveals CD16+monocytes and memory CD8+T cells involved in severe COVID-19
- PMID: 35172892
- PMCID: PMC8851814
- DOI: 10.1186/s13073-022-01021-1
Integrating single-cell sequencing data with GWAS summary statistics reveals CD16+monocytes and memory CD8+T cells involved in severe COVID-19
Abstract
Background: Understanding the host genetic architecture and viral immunity contributes to the development of effective vaccines and therapeutics for controlling the COVID-19 pandemic. Alterations of immune responses in peripheral blood mononuclear cells play a crucial role in the detrimental progression of COVID-19. However, the effects of host genetic factors on immune responses for severe COVID-19 remain largely unknown.
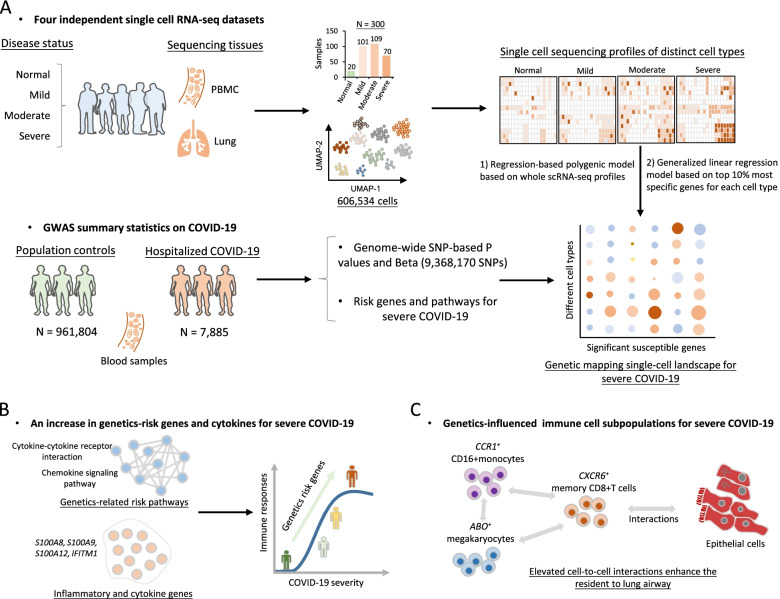
Methods: We constructed a computational framework to characterize the host genetics that influence immune cell subpopulations for severe COVID-19 by integrating GWAS summary statistics (N = 969,689 samples) with four independent scRNA-seq datasets containing healthy controls and patients with mild, moderate, and severe symptom (N = 606,534 cells). We collected 10 predefined gene sets including inflammatory and cytokine genes to calculate cell state score for evaluating the immunological features of individual immune cells.
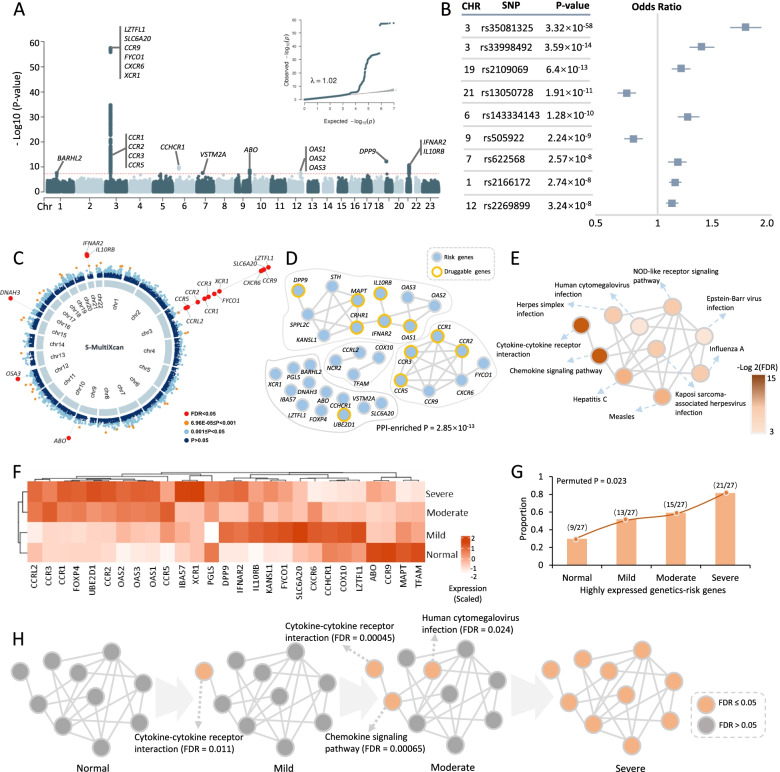
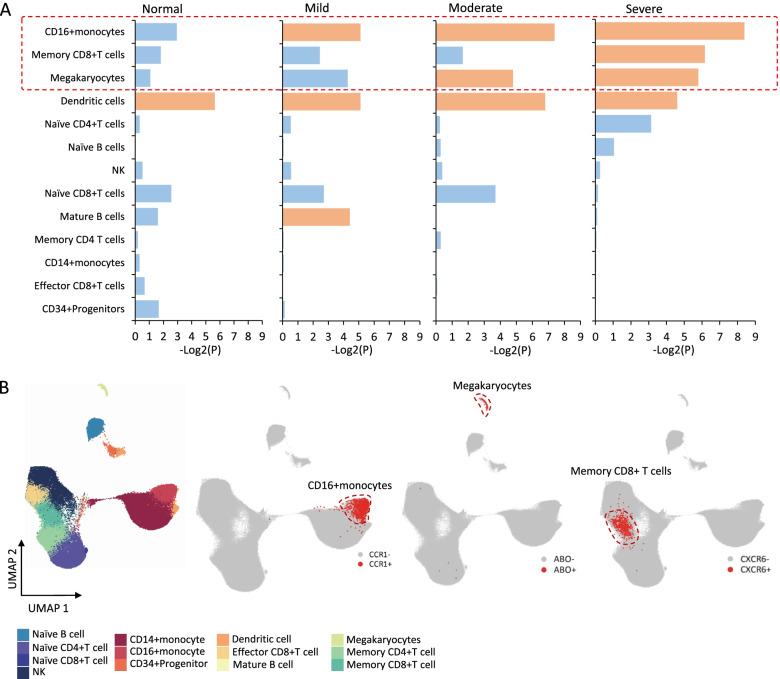
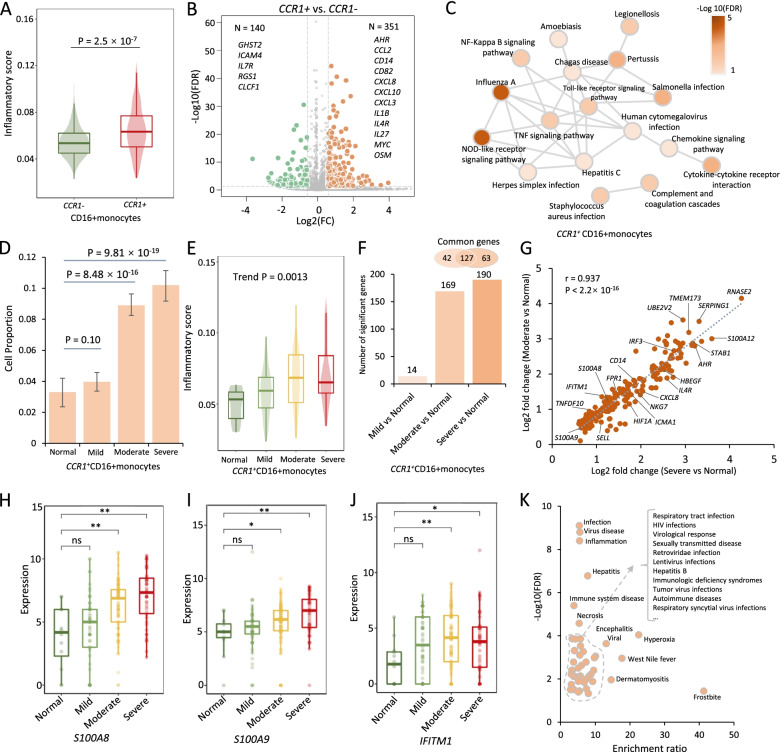
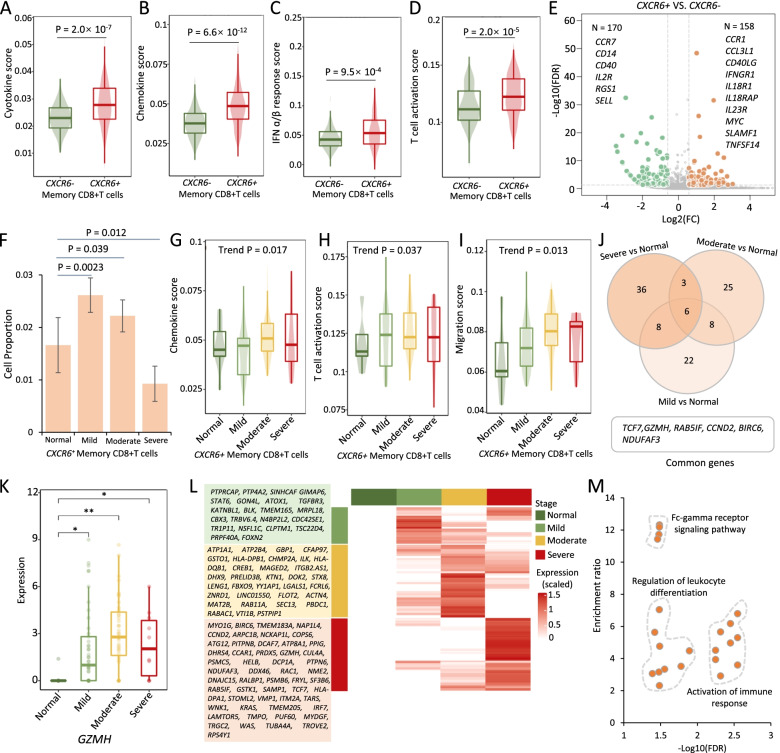
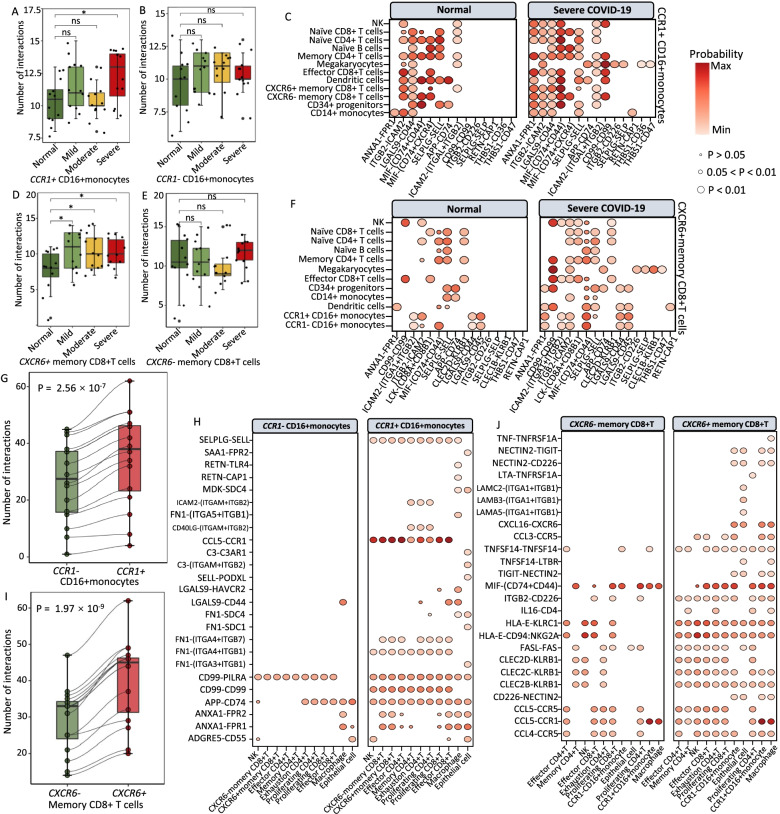
Results: We found that 34 risk genes were significantly associated with severe COVID-19, and the number of highly expressed genes increased with the severity of COVID-19. Three cell subtypes that are CD16+monocytes, megakaryocytes, and memory CD8+T cells were significantly enriched by COVID-19-related genetic association signals. Notably, three causal risk genes of CCR1, CXCR6, and ABO were highly expressed in these three cell types, respectively. CCR1+CD16+monocytes and ABO+ megakaryocytes with significantly up-regulated genes, including S100A12, S100A8, S100A9, and IFITM1, confer higher risk to the dysregulated immune response among severe patients. CXCR6+ memory CD8+ T cells exhibit a notable polyfunctionality including elevation of proliferation, migration, and chemotaxis. Moreover, we observed an increase in cell-cell interactions of both CCR1+ CD16+monocytes and CXCR6+ memory CD8+T cells in severe patients compared to normal controls among both PBMCs and lung tissues. The enhanced interactions of CXCR6+ memory CD8+T cells with epithelial cells facilitate the recruitment of this specific population of T cells to airways, promoting CD8+T cell-mediated immunity against COVID-19 infection.
Conclusions: We uncover a major genetics-modulated immunological shift between mild and severe infection, including an elevated expression of genetics-risk genes, increase in inflammatory cytokines, and of functional immune cell subsets aggravating disease severity, which provides novel insights into parsing the host genetic determinants that influence peripheral immune cells in severe COVID-19.
Keywords: COVID-19; GWAS; Immune cells; Inflammatory storm; Single-cell sequencing.
© 2022. The Author(s).
Conflict of interest statement
The authors declare that they have no competing interests.
Figures
Similar articles
-
Association of CXCR6 with COVID-19 severity: delineating the host genetic factors in transcriptomic regulation.Hum Genet. 2021 Sep;140(9):1313-1328. doi: 10.1007/s00439-021-02305-z. Epub 2021 Jun 21. Hum Genet. 2021. PMID: 34155559 Free PMC article.
-
Transcriptional Changes in CD16+ Monocytes May Contribute to the Pathogenesis of COVID-19.Front Immunol. 2021 May 24;12:665773. doi: 10.3389/fimmu.2021.665773. eCollection 2021. Front Immunol. 2021. PMID: 34108966 Free PMC article.
-
Single cell RNA-seq resolution revealed CCR1+/SELL+/XAF+ CD14 monocytes mediated vascular endothelial cell injuries in Kawasaki disease and COVID-19.Biochim Biophys Acta Mol Basis Dis. 2023 Jun;1869(5):166707. doi: 10.1016/j.bbadis.2023.166707. Epub 2023 Mar 29. Biochim Biophys Acta Mol Basis Dis. 2023. PMID: 37001702 Free PMC article.
-
ScRNA-Seq reveals T cell immunity in COVID-19 patients and implications for immunotherapy.Int Immunopharmacol. 2025 May 16;155:114663. doi: 10.1016/j.intimp.2025.114663. Epub 2025 Apr 14. Int Immunopharmacol. 2025. PMID: 40233451 Review.
-
Chemokine receptors in COVID-19 infection.Int Rev Cell Mol Biol. 2024;388:53-94. doi: 10.1016/bs.ircmb.2024.05.002. Epub 2024 Jun 30. Int Rev Cell Mol Biol. 2024. PMID: 39260938 Review.
Cited by
-
Evaluating the effects of circulating inflammatory proteins as drivers and therapeutic targets for severe COVID-19.Front Immunol. 2024 Feb 22;15:1352583. doi: 10.3389/fimmu.2024.1352583. eCollection 2024. Front Immunol. 2024. PMID: 38455043 Free PMC article.
-
Association of programmed cell death 1 (PD-1) gene polymorphism (rs10204525) with COVID-19 severity and mortality: A case-control study in the Iranian population.Int Immunopharmacol. 2023 Jun;119:110114. doi: 10.1016/j.intimp.2023.110114. Epub 2023 Mar 31. Int Immunopharmacol. 2023. PMID: 37172423 Free PMC article.
-
Identification of MKNK1 and TOP3A as ovarian endometriosis risk-associated genes using integrative genomic analyses and functional experiments.Comput Struct Biotechnol J. 2023 Feb 5;21:1510-1522. doi: 10.1016/j.csbj.2023.02.001. eCollection 2023. Comput Struct Biotechnol J. 2023. PMID: 36851918 Free PMC article.
-
Human autoimmunity at single cell resolution in aplastic anemia before and after effective immunotherapy.Nat Commun. 2025 May 30;16(1):5048. doi: 10.1038/s41467-025-60213-6. Nat Commun. 2025. PMID: 40447607 Free PMC article.
-
The causal relationship between immune cell traits and schizophrenia: a Mendelian randomization analysis.Front Immunol. 2024 Sep 27;15:1452214. doi: 10.3389/fimmu.2024.1452214. eCollection 2024. Front Immunol. 2024. PMID: 39399496 Free PMC article.
References
-
- Wu Z, McGoogan JM. Characteristics of and important lessons from the coronavirus disease 2019 (COVID-19) outbreak in China: summary of a report of 72 314 cases from the Chinese Center for Disease Control and Prevention. JAMA. 2020;323(13):1239–1242. - PubMed
-
- Berlin DA, Gulick RM, Martinez FJ. Severe Covid-19. N Engl J Med. 2020;323(13):1239–1242. - PubMed
Publication types
MeSH terms
Substances
LinkOut - more resources
Full Text Sources
Medical
Research Materials
Miscellaneous
