. 2022 Mar 15;98(11):e1137-e1150.
doi: 10.1212/WNL.0000000000200040. Epub 2022 Feb 16.

Cerebrospinal Fluid Biomarkers in Autopsy-Confirmed Alzheimer Disease and Frontotemporal Lobar Degeneration

Affiliations

Cerebrospinal Fluid Biomarkers in Autopsy-Confirmed Alzheimer Disease and Frontotemporal Lobar Degeneration

Niklas Mattsson-Carlgren et al. Neurology. .

Abstract

Background and objectives: To determine how fully automated Elecsys CSF immunoassays for β-amyloid (Aβ) and tau biomarkers and an ultrasensitive Simoa assay for neurofilament light chain (NFL) correlate with neuropathologic changes of Alzheimer disease (AD) and frontotemporal lobar degeneration (FTLD).

Methods: We studied 101 patients with antemortem CSF and neuropathology data. CSF samples were collected a mean of 2.9 years before death (range 0.2-7.5 years). CSF was analyzed for Aβ40, Aβ42, total tau (T-tau), tau phosphorylated at amino acid residue 181 (P-tau), P-tau/Aβ42 and Aβ42/Aβ40 ratios, and NFL. Neuropathology measures included Thal phases, Braak stages, Consortium to Establish a Registry for Alzheimer's Disease (CERAD) scores, AD neuropathologic change (ADNC), and primary and contributory pathologic diagnoses. Associations between CSF biomarkers and neuropathologic features were tested in regression models adjusted for age, sex, and time from sampling to death.

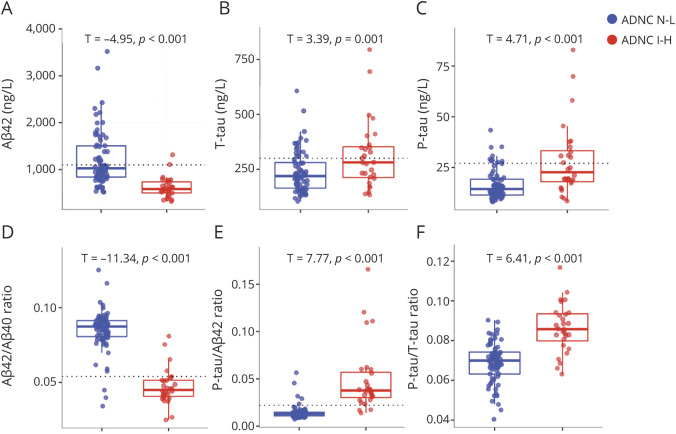
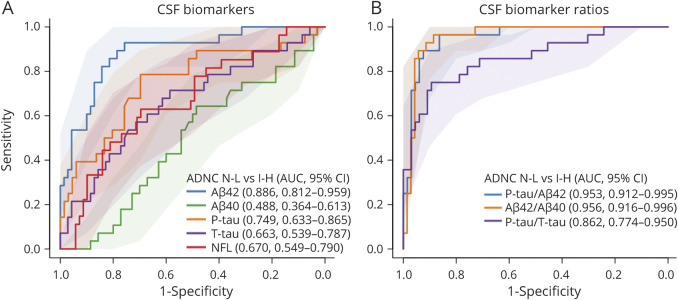
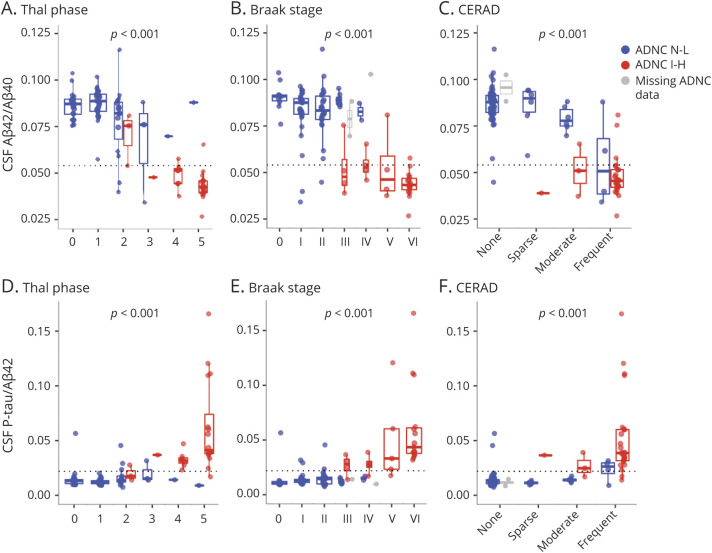
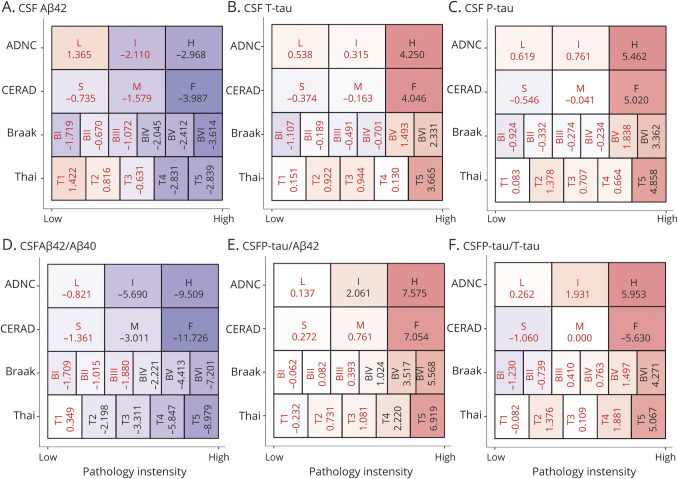
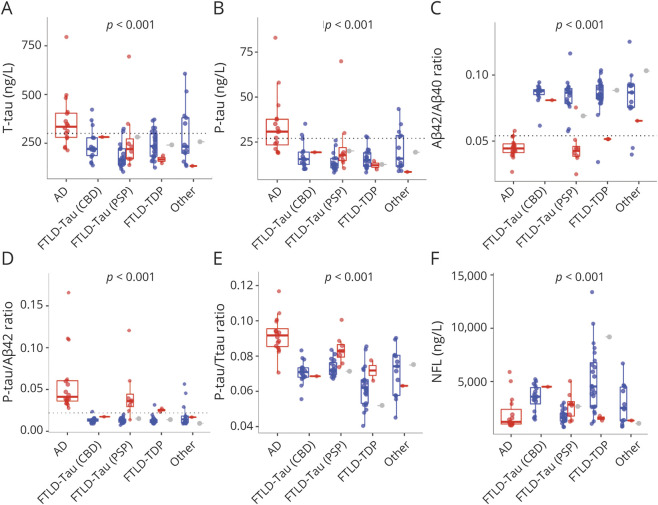
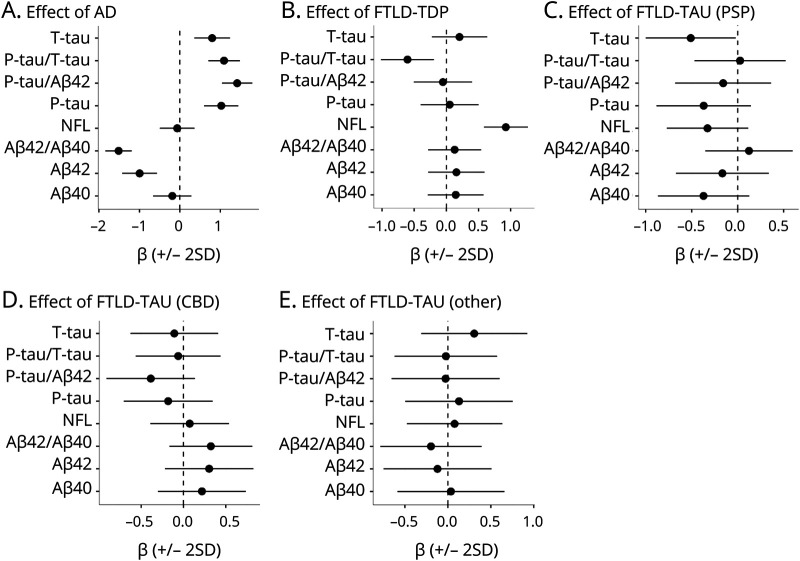
Results: CSF biomarkers were associated with neuropathologic measures of Aβ (Thal, CERAD score), tau (Braak stage), and overall ADNC. The CSF P-tau/Aβ42 and Aβ42/Aβ40 ratios had high sensitivity, specificity, and overall diagnostic performance for intermediate-high ADNC (area under the curve range 0.95-0.96). Distinct biomarker patterns were seen in different FTLD subtypes, with increased NFL and reduced P-tau/T-tau in FTLD-TAR DNA-binding protein 43 and reduced T-tau in progressive supranuclear palsy compared to other FTLD variants.

Discussion: CSF biomarkers, including P-tau, T-tau, Aβ42, Aβ40, and NFL, support in vivo identification of AD neuropathology and correlate with FTLD neuropathology.

Classification of evidence: This study provides Class II evidence that distinct CSF biomarker patterns, including for P-tau, T-tau, Aβ42, Aβ40, and NFL, are associated with AD and FTLD neuropathology.


Figures

Figure 1
Figure 1. CSF Biomarkers by ADNC N-L vs I-H
(A–F) Biomarkers are shown as unadjusted raw data in the groups of Alzheimer disease neuropathologic change (ADNC) none-low (N-L; blue) and intermediate-high (I-H; red). T values and p values are shown for group differences, adjusted for age, sex, and lag between lumbar puncture and death. Reference lines are shown for a priori cut points for β-amyloid (Aβ)42, total tau (T-tau), phosphorylated tau (P-tau), Aβ42/Aβ40, and P-tau/Aβ42, as defined previously. Aβ40 and neurofilament light biomarkers are shown in eFigure 3, links.lww.com/WNL/B777.
Figure 2
Figure 2. CSF Biomarkers for ADNC Classification
Performance of logistic regression models for individual biomarkers (A) and biomarker ratios (B), to distinguish between Alzheimer disease neuropathologic change (ADNC) none-low (N-L) and ADNC intermediate-high (I-H). Legends show overall area under the receiver operating curve characteristics (AUC) with 95% CI from a bootstrap procedure. Aβ = β-amyloid; NFL = neurofilament light; P-tau = phosphorylated tau; T-tau = total tau.
Figure 3
Figure 3. CSF Biomarkers by AD Neuropathologic Scores
Biomarker ratios (β-amyloid [Aβ]42/Aβ40 and phosphorylated tau [P-tau]/Aβ42) are shown as unadjusted raw data by neuropathologic scores for spread of Aβ pathology (Thal phase 0–5), tau pathology (Braak stage 0–VI), and presence/frequency of neuritic plaques (Consortium to Establish a Registry for Alzheimer's Disease [CERAD] score). eFigure 5, links.lww.com/WNL/B777 gives Alzheimer disease (AD) neuropathologic change (ADNC) data. The p values are for the overall associations (from likelihood ratio tests of models with and without including the neuropathologic score as a predictor) between the neuropathologic scores and CSF biomarker levels, adjusted for age, sex, and time between lumbar puncture and death. A reference line is shown for an a priori cut point for Aβ42/Aβ40. Color coding refers to ADNC class (blue = ADNC none-low [N-L], red = ADNC intermediate-high [I-H], gray = missing ADNC data).
Figure 4
Figure 4. CSF Biomarker Changes at Different Levels of Pathology
This figure shows how different biomarkers are altered at different levels of pathology compared to the lowest levels of respective pathology. Presented data are T statistics (black = significant at p < 0.05, red = nonsignificant). Box colors are related to the magnitude of the T statistics (red colors = positive, violet = negative). Data are presented for each biomarker (A–F) and the pathologic scores Thal phase (categories range from Thal phase 1–5), Braak stage (categories range from stage I–IV), Consortium to Establish a Registry for Alzheimer's Disease (CERAD) score (sparse [S], medium [M], frequent [F]), and Alzheimer disease neuropathologic change (ADNC) (low [L], intermediate [I], high [H]). For each score, biomarkers were compared between each category and the reference category (Thal phase 0, Braak stage 0, CERAD none, and ADNC no, respectively). The T statistics are from linear regression models, adjusted for age, sex, and time between lumbar puncture and death. For example, CSF β-amyloid (Aβ)42/Aβ40 (D) was significantly reduced at ADNC intermediate, CERAD moderate, Braak stage IV, and Thal phase 2 (and all greater levels of pathology). eFigure 8, links.lww.com/WNL/B777 gives results for Aβ40 and neurofilament light.
Figure 5
Figure 5. CSF Biomarkers by Primary Pathologic Diagnosis
Biomarkers (A–F) are shown as unadjusted raw data by primary neuropathologic diagnosis. The p values are shown for overall significance of neuropathologic diagnosis, adjusted for age, sex, and time between lumbar puncture and death. eFigure 12, links.lww.com/WNL/B777 gives results for β-amyloid (Aβ)40 and Aβ42. eTable 6 gives pairwise comparisons between different diagnoses. Reference lines are shown for a priori cut points for total tau (T-tau), phosphorylated tau (P-tau181), Aβ42/Aβ40, and P-tau/Aβ42, as defined previously. Color coding refers to Alzheimer disease neuropathologic change (ADNC) class (blue = ADNC none-low, red = ADNC intermediate-high, gray = missing ADNC data). AD = Alzheimer disease; CBD = corticobasal degeneration; FTLD = frontotemporal lobar degeneration; PSP = progressive supranuclear palsy; TDP = TAR DNA binding protein 43.
Figure 6
Figure 6. CSF Biomarkers vs Primary and Contributory Neuropathology Diagnoses
Effects are plotted for each neuropathologic class (A–E) from linear regression models adjusted age, sex, and time between lumbar puncture and death. Coefficients represent the average difference in biomarkers between patients who were positive for a neuropathology (e.g., AD in panel A, also if only present as a copathology) compared to the remaining patients. AD = Alzheimer disease; CBD = corticobasal degeneration; FTLD = frontotemporal lobar degeneration; NFL = neurofilament light; P-tau = phosphorylated tau; PSP = progressive supranuclear palsy; T-tau = total tau; TDP = TAR DNA binding protein 43.

References

    1. Beach TG, Monsell SE, Phillips LE, Kukull W. Accuracy of the clinical diagnosis of Alzheimer disease at National Institute on Aging Alzheimer's disease centers, 2005-2010. J Neuropathol Exp Neurol. 2012;71(4):266-273. - PMC - PubMed
    1. Harris JM, Gall C, Thompson JC, et al. Classification and pathology of primary progressive aphasia. Neurology. 2013;81(21):1832-1839. - PubMed
    1. Mackenzie IRA, Neumann M, Baborie A, et al. A harmonized classification system for FTLD-TDP pathology. Acta Neuropathol. 2011;122(1):111-113. - PMC - PubMed
    1. Jack CR, Bennett DA, Blennow K, et al. NIA-AA Research Framework: toward a biological definition of Alzheimer's disease. Alzheimers Dement. 2018;14(4):535-562. - PMC - PubMed
    1. Clark CM, Pontecorvo MJ, Beach TG, et al. Cerebral PET with florbetapir compared with neuropathology at autopsy for detection of neuritic amyloid-beta plaques: a prospective cohort study. Lancet Neurol. 2012;11:669-678. - PubMed

Publication types

MeSH terms