. 2022 Dec;71(12):2551-2560.
doi: 10.1136/gutjnl-2021-326350. Epub 2022 Feb 16.

PD-L1 blockade liberates intrinsic antitumourigenic properties of glycolytic macrophages in hepatocellular carcinoma

Affiliations

PD-L1 blockade liberates intrinsic antitumourigenic properties of glycolytic macrophages in hepatocellular carcinoma

Li-Gong Lu et al. Gut. 2022 Dec.

Abstract

Objective: Patients with increased PD-L1+ host cells in tumours are more potent to benefit from antiprogrammed death-1/programmed death ligand-1 (PD-L1) treatment, but the underlying mechanism is still unclear. We aim to elucidate the nature, regulation and functional relevance of PD-L1+ host cells in hepatocellular carcinoma (HCC).

Design: A total of untreated 184 HCC patients was enrolled randomly. C57BL/6 mice are given injection of Hepa1-6 cells to form autologous hepatoma. ELISpot, flow cytometry and real-time PCR are applied to analyse the phenotypic characteristics of PD-L1+ cells isolated directly from HCC specimens paired with blood samples or generated from ex vivo and in vitro culture systems. Immunofluorescence and immunohistochemistry are performed to detect the presence of immune cells on paraffin-embedded and formalin-fixed samples. The underlying regulatory mechanisms of metabolic switching are assessed by both in vitro and in vivo studies.

Results: We demonstrate that PD-L1+ host macrophages, which constructively represent the major cellular source of PD-L1 in HCC tumours, display an HLA-DRhighCD86high glycolytic phenotype, significantly produce antitumourigenic IL-12p70 and are polarised by intrinsic glycolytic metabolism. Mechanistically, a key glycolytic enzyme PKM2 triggered by hepatoma cell derived fibronectin 1, via a HIF-1α-dependent manner, concurrently controls the antitumourigenic properties and inflammation-mediated PD-L1 expression in glycolytic macrophages. Importantly, although increased PKM2+ glycolytic macrophages predict poor prognosis of patients, blocking PD-L1 on these cells eliminates PD-L1-dominant immunosuppression and liberates intrinsic antitumourigenic properties.

Conclusions: Selectively modulating the 'context' of glycolytic macrophages in HCC tumours might restore their antitumourigenic properties and provide a precise strategy for anticancer therapy.

Keywords: cancer immunobiology; glucose metabolism; hepatoma; immunotherapy; macrophages.


Conflict of interest statement

Competing interests: None declared.

Figures

Figure 1
Figure 1
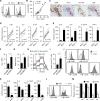
Glycolysis triggers PD-L1 on macrophages in human HCC tumours. (A) Confocal microscopy analysis of CD68+PD-L1+ cells in HCC tumours (n=10). Scale bar=100 µm. (B) FACS analysis of PD-L1 on monocytes/macrophages from HCC samples paired with blood samples (n=9). (C–H) Analysis of metabolic gene expression (C and D, n=3 for each), extracellular acidification rate (ECAR) (E, n=4), GLUT-1 expression (F, n=5), 2NBDG incorporation (G, n=5) and 20-hour lactate production (H, n=6) in PD-L1+ and PD-L1 macrophages purified from human HCC tumours. (I) Effects of metabolic inhibitors 2-deoxyglucose (2-DG), etomoxir (ETO) and oligomycin (Oym) on ex vivo PD-L1 expression in macrophages from human HCC tumours (n=5). (J and K) Mice bearing Hepa1-6 hepatoma for 15 days were injected with PBS or 2-DG intraperitoneally as described (J). PD-L1 expression on tumour macrophages was determined by FACS (K, n=6). *P<0.05, **p<0.01, ***p<0.001. HCC, hepatocellular carcinoma; PD-L1, programmed death ligand-1.
Figure 2
Figure 2
Glycolytic macrophages show intrinsic antitumourigenic properties. (A) IFN-γ detection by ELISpot in HCC tumour-derived T cells cultured alone or with PD-L1 or PD-L1+ macrophages (Mφ), or with those cells pre-treated with 2-DG, anti-PD-L1 antibody, or IgG1 as shown in online supplemental figure 2A (n=5). (B) cytotoxic effects of tumour T cells on CFSE-labelled autologous mouse Hepa1-6 hepatoma cells in the presence or absence of tumour Mφ that were left untreated or pre-treated with 2-DG, anti-PD-L1 antibody, or IgG1 as shown in online supplemental figure 2B (n=6). propidium iodide+ Hepa1-6 cells were measured by FACS. results are expressed as mean±SEM of three independent experiments. *p<0.05, **p<0.01, ***p<0.001.
Figure 3
Figure 3
PD-L1+ macrophages show a proinflammatory activated phenotype. (A) FACS analysis of CD86 and HLA-DR on PD-L1+ and PD-L1 macrophages from HCC tumours (n=11). (B) Correlation between PD-L1 and HLA-DR expression in macrophages from human HCC tumours (n=11). (C) Immunohistochemistry analysis of CD68, PD-L1, HLA-DR and CD8 expression in HCC tumours (n=8). (D and E) Analysis of transcriptional and translational levels of IL-1β, IL-6, IL-12 and TNF-α in PD-L1+ and PD-L1 macrophages from HCC tumours (n=7). (F–I) Analysis of glut-1 expression (F), 2NBDG incorporation (G), ECAR (H) and 20-hour lactate production (I) in HLA-DRhigh and HLA-DRlow macrophages purified from human HCC tumours (n=5). (J and K) Effects of 2-DG on CD86, HLA-DR, CD206, CD23 and CD163 expression (J), as well as cytokine production (K), in macrophages from HCC tumours (n=4). (L and M) Mice (n=6) bearing Hepa1-6 hepatoma were injected with PBS or 2-DG as described in figure 1J. CD86 and I-A/I-E expression (L), as well as cytokine expression (M), in tumour macrophages were determined by FACS and real-time PCR, respectively. Results are expressed as mean±SEM of at least three independent experiments. *P<0.05, **p<0.01, ***p<0.001. 2-DG, 2-deoxyglucose; ECAR, extracellular acidification rate; HCC, hepatocellular carcinoma; PD-L1, programmed death ligand-1.
Figure 4
Figure 4
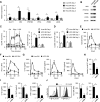
Inflammatory cytokines induce PD-L1 in tumour macrophages. (A) Twenty-four-hour blockade of IL-1β or TNF-α reduced PD-L1 expression in macrophages from human HCC tumours (n=5). (B) Exposure of blood CD14+ cells to IL-1β and/or TNF-α for 24 hours led to PD-L1 upregulation (n=5). (C–G) Mice bearing Hepa1-6 hepatoma were injected intraperitoneally with PBS or anti-IL-1β antibody plus anti-TNF-α antibody as shown (C, each n=6). Tumour macrophage PD-L1 expression (D), tumour size (E), CD8+ cell infiltration and function (F) and tumour macrophage Il12a expression (G) were determined. Results are expressed as mean±SEM of at least three independent experiments. *P<0.05, **p<0.01, ***p<0.001. HCC, hepatocellular carcinoma; PD-L1, programmed death ligand-1.
Figure 5
Figure 5
Hepatoma environments facilitate glycolysis and PD-L1 expression in macrophages. (A–G) Exposure of blood CD14+ cells to primary HCC-SN, but not liver-SN, led to marked increases of glycolytic metabolic enzymes (A and B), ECAR (C), lactate production (D), HLA-DR expression (E), PD-L1 expression (F) and inflammatory cytokine production (G) after 24 hours but returned to a normal level after 3 days (n=7 for each). (H–J) Treatment of 2-DG for 24 hours suppressed HCC-SN-mediated upregulation of lactate production (H), inflammatory cytokine production (I) and HLA-DR and PD-L1 expression (J) in CD14+ cells (n=7 for each). Results are expressed as mean±SEM of three independent experiments. *P<0.05, **p<0.01. 2-DG, 2-deoxyglucose; ECAR, extracellular acidification rate; HCC-SN, supernatants from cultures of primary HCC cells; PD-L1, programmed death ligand-1.
Figure 6
Figure 6
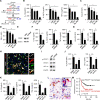
Glycolysis upregulates PD-L1 on macrophages via PKM2/HIF-1α axis-dependent manner. (A–D) Effects of 3-BP (an hK2 inhibitor), 3-PO (a PFKEB3 inhibitor) or ML-265 (a PKM2 inhibitor) (A) on inflammatory cytokine production (B), HLA-DR expression (C) and PD-L1 expression (D) by CD14+ cells exposing to primary HCC-SN for 24 hours (n=5). (E–G) Transfection of siPKM2 (E) suppressed cytokine production (F), as well as HLA-DR and PD-L1 expression (G), by CD14+ cells exposing to primary HCC-SN for 24 hours (n=5). (H) Confocal microscopy analysis of CD68, PKM2 and PD-L1 distribution in HCC tumours (n=5). Scale bar=100 µm. (I) Transfection of siPKM2 suppressed STAT3 activation and HIF-1α expression by CD14+ cells exposing to primary HCC-SN (n=5). (J and K) Effects of STAT3 and HIF-1α inhibition on HLA-DR and PD-L1 expression (J), as well as inflammatory cytokine production (K), by CD14+ cells exposing to primary HCC-SN for 24 hours (n=5). (L and M) Immunohistochemical analysis of PKM2+CD68+ cell distribution in HCC tumours (L, n=91). Patients were further divided into two groups according to the median value of the PKM2+CD68+ cell density in the tumour regions (less PKM2high macrophages, ≤90 cells (n=46); more PKM2high macrophages, >90 cells (n=45)). The disease-free survival rate of these patients was analysed with the Kaplan-Meier method and log-rank test (M). Scale bar=100 µm. Results are expressed as mean±SEM of at least four experiments. *P<0.05, **p<0.01. HCC, hepatocellular carcinoma; HCC-SN, supernatants from cultures of primary HCC cells; PD-L1, programmed death ligand-1.
Figure 7
Figure 7
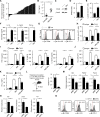
Tumour-derived FN1 facilitated sequential glycolysis, inflammatory cytokine production and PD-L1 expression in macrophages. (A) Relative expression of FN1 in tumour tissue and paired non-tumoural liver tissue (n=33). (B) FN1 concentrations in liver-SN and HCC-SN (n=5). (C–G) Treatment of FN1 led to increases of PKM2 expression (C), 2-NBDG incorporation (D), lactate production (E), inflammatory cytokine production (F), as well as CD86, HLA-DR and PD-L1 expression (G), in blood CD14+ cells. (H–K) Effect of TLR4 blockade on FN1-elicited or HCC-SN-elicited lactate production (H), cytokine production (I), HLA-DR expression (J) and PD-L1 expression (K) in blood CD14+ cells (each n=4). (L–O) Knock-down of Fn1 (L) in Hepa1-6 hepatoma suppressed glycolytic enzyme expression (M), inflammatory cytokine expression (N), as well as CD86, IA-IE and PD-L1 expressions (O), in tumour macrophages (each n=5). Results are expressed as the mean±SEM. *P<0.05, **p<0.01, ***p<0.001. 2-NBDG, 2-(N-[7-nitrobenz-2-oxa-1,3-diazol-4-yl] amino)-2-deoxyglucose; FN1, fibronectin 1; HCC-SN, supernatants from cultures of primary HCC cells; PD-L1, programmed death ligand-1.

References

    1. Chen L, Han X. Anti-Pd-1/Pd-L1 therapy of human cancer: past, present, and future. J Clin Invest 2015;125:3384–91. 10.1172/JCI80011 - DOI - PMC - PubMed
    1. Zou W, Wolchok JD, Chen L. Pd-L1 (B7-H1) and PD-1 pathway blockade for cancer therapy: mechanisms, response biomarkers, and combinations. Sci Transl Med 2016;8:328rv324. 10.1126/scitranslmed.aad7118 - DOI - PMC - PubMed
    1. Jia L, Zhang Q, Zhang R. Pd-1/Pd-L1 pathway blockade works as an effective and practical therapy for cancer immunotherapy. Cancer Biol Med 2018;15:116–23. 10.20892/j.issn.2095-3941.2017.0086 - DOI - PMC - PubMed
    1. Han Y, Liu D, Li L. Pd-1/Pd-L1 pathway: current researches in cancer. Am J Cancer Res 2020;10:727–42. - PMC - PubMed
    1. Keir ME, Butte MJ, Freeman GJ, et al. . Pd-1 and its ligands in tolerance and immunity. Annu Rev Immunol 2008;26:677–704. 10.1146/annurev.immunol.26.021607.090331 - DOI - PMC - PubMed

Publication types