. 2022 Feb 22;119(8):e2115139119.
doi: 10.1073/pnas.2115139119.

Beneficial effects of citrulline enteral administration on sepsis-induced T cell mitochondrial dysfunction

Affiliations

Beneficial effects of citrulline enteral administration on sepsis-induced T cell mitochondrial dysfunction

Florian Reizine et al. Proc Natl Acad Sci U S A. .

Abstract

Severe sepsis induces a sustained immune dysfunction associated with poor clinical behavior. In particular, lymphopenia along with increased lymphocyte apoptosis and decreased lymphocyte proliferation, enhanced circulating regulatory T cells (Treg), and the emergence of myeloid-derived suppressor cells (MDSCs) have all been associated with persistent organ dysfunction, secondary infections, and late mortality. The mechanisms involved in MDSC-mediated T cell dysfunction during sepsis share some features with those described in malignancies such as arginine deprivation. We hypothesized that increasing arginine availability would restore T cell function and decrease sepsis-induced immunosuppression. Using a mouse model of sepsis based on cecal ligation and puncture and secondary pneumonia triggered by methicillin-resistant Staphylococcus aureus inoculation, we demonstrated that citrulline administration was more efficient than arginine in increasing arginine plasma levels and restoring T cell mitochondrial function and proliferation while reducing sepsis-induced Treg and MDSC expansion. Because there is no specific therapeutic strategy to restore immune function after sepsis, we believe that our study provides evidence for developing citrulline-based clinical studies in sepsis.

Keywords: T cell; citrulline; mitochondria; sepsis.


Conflict of interest statement

The authors declare no competing interest.

Figures

Fig. 1.
Fig. 1.
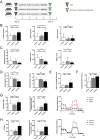
The impact of sepsis on immune functions, metabolic disturbances, and mitochondrial properties. (A) Animals underwent CLP or sham laparotomy and received antibiotic therapy and fluid resuscitation to create a clinically relevant sepsis model. The immune dysfunction following sepsis was studied 5 d after surgery. (B) T cell apoptosis was assessed by flow cytometry as the percentage of AnnexinVpos/DAPIneg CD3pos cells in peripheral blood (Left; Sham n = 19; CLP n = 20) and spleen (Right, Sham n = 11; CLP n = 11). (C) Peripheral blood T cell growth was determined by the incorporation of [3H] thymidine after 48 h of in vitro stimulation by anti-CD3/anti-CD28 antibodies. The data are expressed as the ratios of the counts per minute (cpm) obtained with stimulated versus nonstimulated T cells (Sham n = 19; CLP n = 20). (D) Spleen T cell proliferation was determined by CFSE dilution under in vitro stimulation by anti-CD3/anti-CD28 antibodies. The data are expressed as the proportion (%) of proliferative T cells among living T cells (Sham n = 11; CLP n = 11). (E) Peripheral blood CD3pos T cell mitochondrial mass was analyzed by flow cytometry using MitoTracker probe (Left, Sham n = 20; CLP n = 11) while maximal mitochondrial OCR was determined using Seahorse XF-24 extracellular flux analyzer (Right, Sham n = 5; CLP n = 5). (F) Spleen CD3pos T cell ATP production (Left) and maximal mitochondrial OCR (Right) were defined by CellTiter-Glo Luminescent Cell viability assay and Seahorse XF-24 extracellular flux analyzer, respectively (Sham n = 7; CLP n = 7). (G) The quantification of Treg (Sham n = 20; CLP n = 13) and monocytic and granulocytic myeloid-derived suppressor cells (M-MDSC and G-MDSC, Sham n = 11; CLP n = 11) by flow cytometry within peripheral blood of CLP versus sham mice. (H) Plasmatic amino acid concentrations were assessed by high-performance liquid chromatography (HPLC). Arginase activity was defined by the ornithine-to-arginine ratio (Sham n = 10; CLP n = 14). *P < 0.05; **P < 0.01; ***P < 0.001; ns: nonsignificant.
Fig. 2.
Fig. 2.
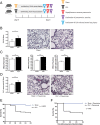
The impact of CLP on ALI and secondary infection severity. (A) Animals underwent CLP or sham laparotomy and received antibiotic therapy and fluid resuscitation to create a clinically relevant sepsis model. Sepsis-induced ALI was evaluated 5 d after surgery. The second set of experiments studied the severity of a secondary infection following sepsis (MRSA-induced pneumonia). The severity of the secondary infection was evaluated 12 h after pneumonia initiation. (B) The ALI score was determined by pathological examination of lung tissues 5 d after surgery in CLP and sham mice, and representative images of lung tissues show the differences between sham and septic mice (Sham n = 6; CLP n = 6). (Scale bar, 100 µm.) (C) Bacterial counts were determined 12 h after the tracheal instillation of MRSA in sham and CLP mice by quantitative cultures of BALF (Sham n = 12; CLP n = 9), spleen, and kidney (Sham n = 14; CLP n = 10) homogenates for 24 h. (D) The ALI score was determined by pathological examination of lung tissues 12 h after MRSA instillation in mice that underwent CLP or sham procedure (Sham n = 7; CLP n = 7). (Scale bar, 100 µm.) (E and F) The Kaplan–Meier survival curves of CLP versus sham mice without (Left, Sham n = 107; CLP = 109) and with secondary pneumonia induction (Right, Sham n = 12; CLP n = 11). *P < 0.05; **P < 0.01; ***P < 0.001; ns: nonsignificant.
Fig. 3.
Fig. 3.
The effects of citrulline administration on post-septic immunoparalysis and mitochondrial dysfunctions. (A) The animals underwent CLP and received antibiotic therapy and fluid resuscitation. From day 0 to 5, the mice were enterally fed by citrulline (150 mg/kg/day), arginine (150 mg/kg/day), or an isonitrogenous placebo. The immune dysfunctions were studied 5 d after surgery. (B) Plasmatic amino acid concentrations were assessed by HPLC. Arginase activity was defined by the ornithine-to-arginine ratio (Sham n = 10; CLP n = 14) (Placebo n = 10, Arginine n = 13, and Citrulline n = 13). (C) The quantification of Treg and M-MDSC and G-MDSC by flow cytometry within peripheral blood of CLP mice (Placebo n = 14, Arginine n = 12, and Citrulline n = 14). (D) T cell apoptosis was assessed by flow cytometry as the percentage of AnnexinVpos/DAPIneg CD3pos cells in peripheral blood (Placebo n = 15, Arginine n = 15, and Citrulline n = 15) and spleen (Placebo n = 8, Arginine n = 8, and Citrulline n = 8) of CLP mice. (E) Peripheral blood T cell growth was determined by the incorporation of [3H] thymidine after 48 h of in vitro stimulation by anti-CD3/anti-CD28 antibodies. The data are expressed as the ratios of the counts per minute (cpm) obtained with stimulated versus nonstimulated T cells (Placebo n = 6, Arginine n = 7, and Citrulline n = 12). (F) Spleen T cell proliferation was determined by CFSE dilution under in vitro stimulation by anti-CD3/anti-CD28 antibodies. The data are expressed as the proportion (%) of proliferative T cells among living T cells. (Placebo n = 8, Arginine n = 8, and Citrulline n = 8). (G) Peripheral blood CD3pos T cell mitochondrial mass was analyzed by flow cytometry using MitoTracker probe (Left, Placebo n = 7, Arginine n = 4, and Citrulline n = 8), while maximal mitochondrial OCR was determined using Seahorse XF-24 extracellular flux analyzer (Right, Placebo n = 4, Arginine n = 4, and Citrulline n = 4). (H) Spleen CD3pos T cell ATP production (Left) and maximal mitochondrial OCR (Right) were defined by CellTiter-Glo Luminescent Cell viability assay and Seahorse XF-24 extracellular flux analyzer, respectively (Placebo n = 7, Arginine n = 7, and Citrulline n = 7). *P < 0.05; **P < 0.01; ***P < 0.001; ns: nonsignificant.
Fig. 4.
Fig. 4.
Citrulline mediated ALI‘s protection and improvement in secondary infection severity. (A) The animals underwent CLP or sham laparotomy and received antibiotic therapy and fluid resuscitation to create a clinically relevant sepsis model. From day 0 to 5, the mice were enterally fed by citrulline (150 mg/kg/day), arginine (150 mg/kg/day), or an isonitrogenous placebo. Sepsis-induced ALI was evaluated 5 d after surgery. The second set of experiments studied the severity of a secondary infection following sepsis (MRSA-induced pneumonia). The severity of the secondary infection was evaluated 12 h after pneumonia initiation. (B) The ALI score determined by pathological examination of lung tissues 5 d after CLP, and representative images of lung tissues show the differences between the three groups of mice (Placebo n = 9, Arginine n = 7, and Citrulline n = 9) (Sham n = 6; CLP n = 6). (Scale bar, 100 µm.) The ALI scores were higher in placebo and arginine mice than in citrulline mice. (C) Bacterial counts were determined 12 h after the instillation of MRSA in mice by quantitative cultures of BALF, spleen, and kidney homogenates at 24 h was performed. Bacteriological secondary pneumonia severity assessment showed lower MRSA concentrations in BALF (Placebo n = 8, Arginine n = 13, and Citrulline n = 13), spleen, and kidneys (Placebo n = 15, Arginine n = 21, and Citrulline n = 20) of citrulline-fed mice. (D) The ALI score was determined by the pathological examination of lung tissues 12 h after the secondary infection initiation, and representative images of lung tissues show the differences between the three groups of mice (Placebo n = 7, Arginine n = 8, and Citrulline n = 10). (Scale bar, 100 µm.) The ALI scores were higher in placebo and arginine mice than in citrulline mice. *P < 0.05, ***P < 0.001; ns, nonsignificant.

Comment in

References

    1. Angus D. C., van der Poll T., Severe sepsis and septic shock. N. Engl. J. Med. 369, 840–851 (2013). - PubMed
    1. Delano M. J., Ward P. A., Sepsis-induced immune dysfunction: Can immune therapies reduce mortality? J. Clin. Invest. 126, 23–31 (2016). - PMC - PubMed
    1. Benjamim C. F., Hogaboam C. M., Kunkel S. L., The chronic consequences of severe sepsis. J. Leukoc. Biol. 75, 408–412 (2004). - PubMed
    1. Daviaud F., et al. , Timing and causes of death in septic shock. Ann. Intensive Care 5, 16 (2015). - PMC - PubMed
    1. Venet F., Monneret G., Advances in the understanding and treatment of sepsis-induced immunosuppression. Nat. Rev. Nephrol. 14, 121–137 (2018). - PubMed

MeSH terms