. 2022 Feb 16;13(1):896.
doi: 10.1038/s41467-022-28524-0.

Proteomic analysis of archival breast cancer clinical specimens identifies biological subtypes with distinct survival outcomes

Affiliations

Proteomic analysis of archival breast cancer clinical specimens identifies biological subtypes with distinct survival outcomes

Karama Asleh et al. Nat Commun. .

Abstract

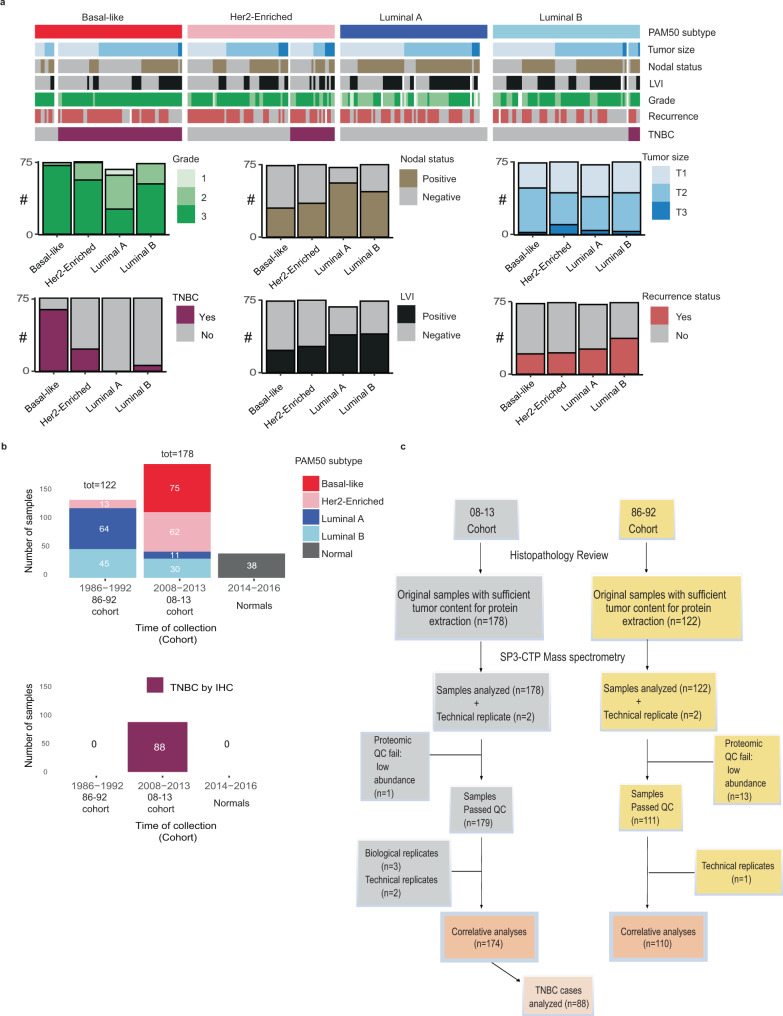
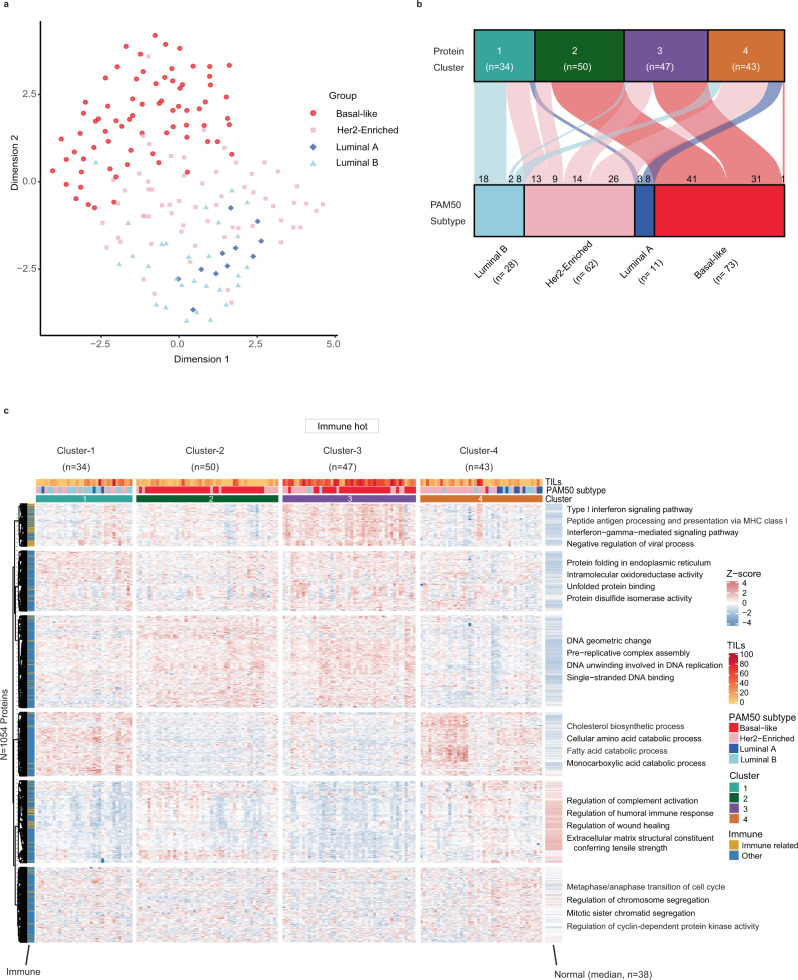
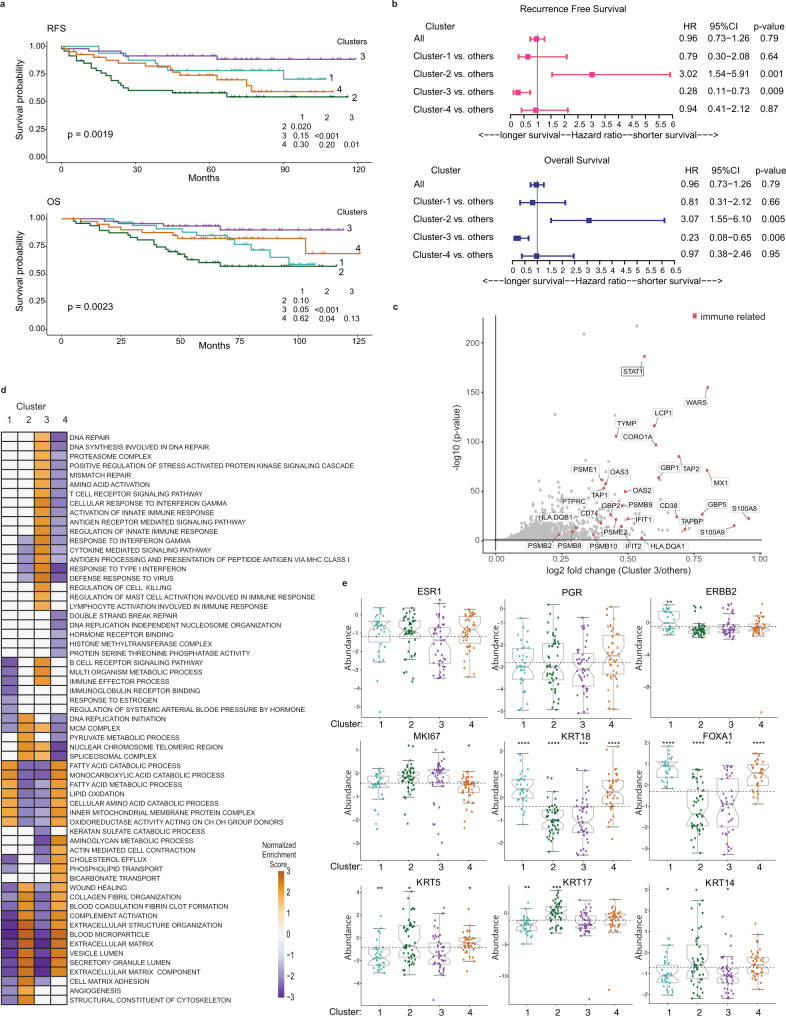
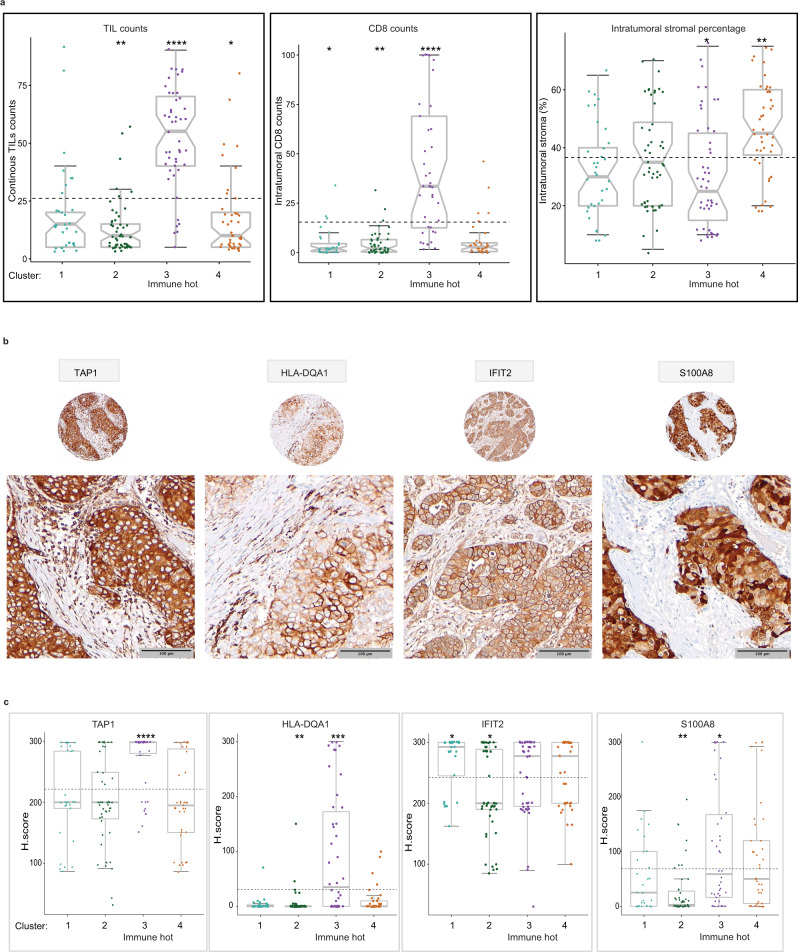
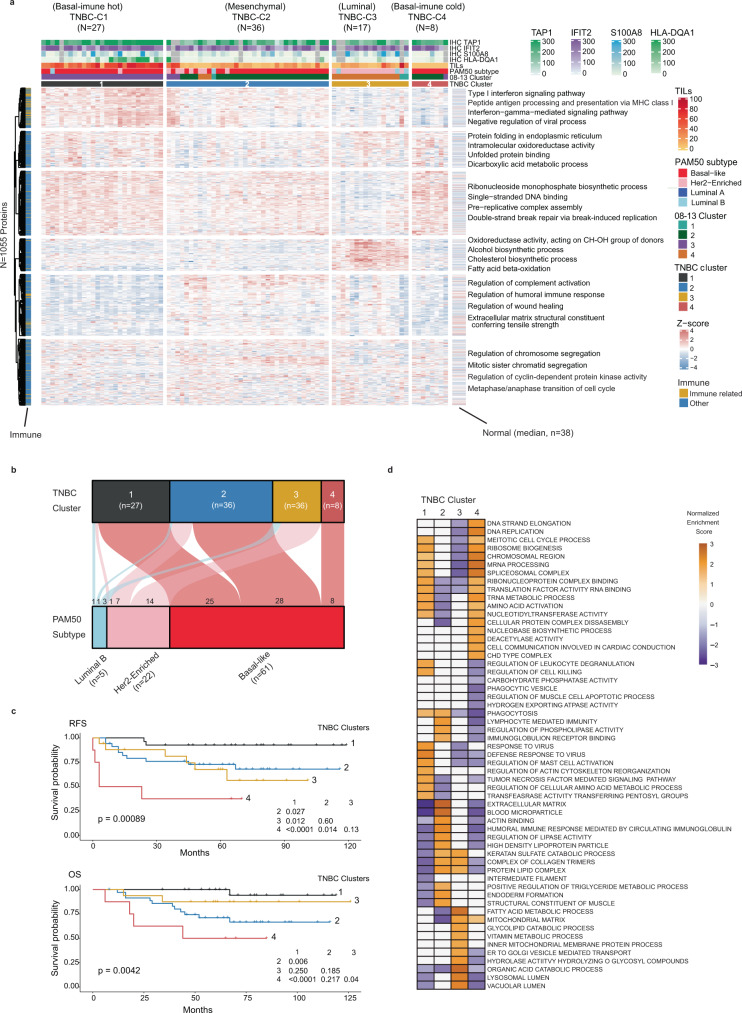
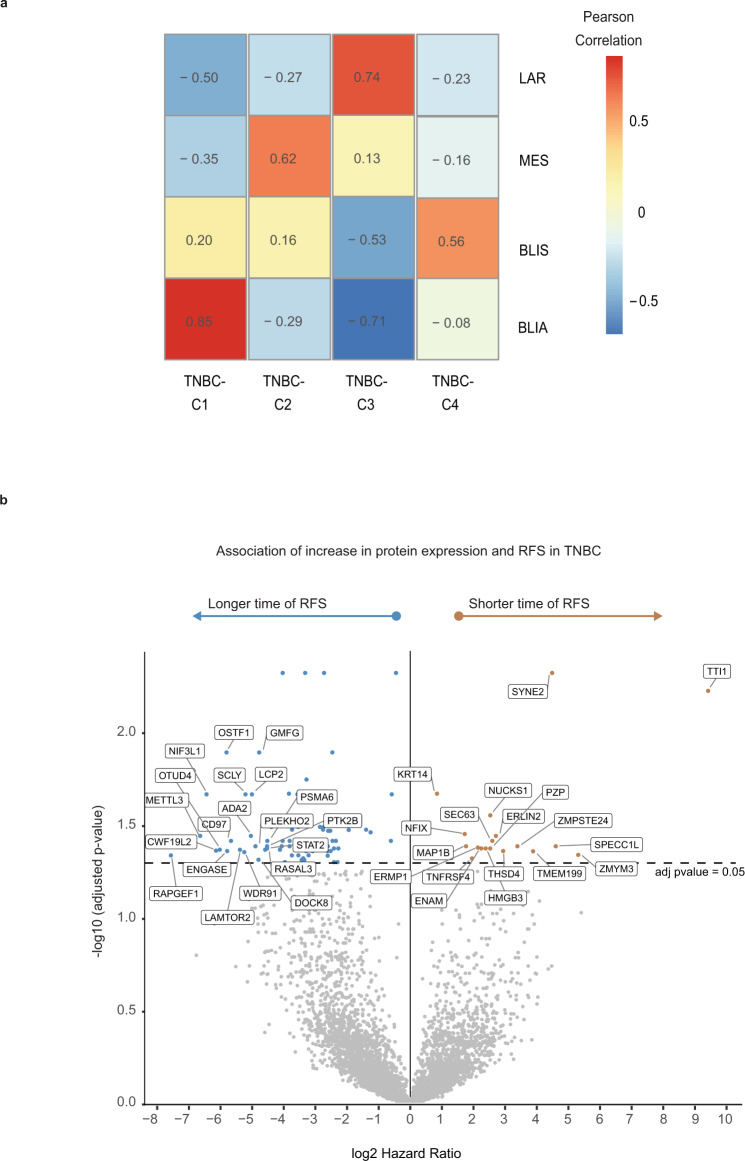
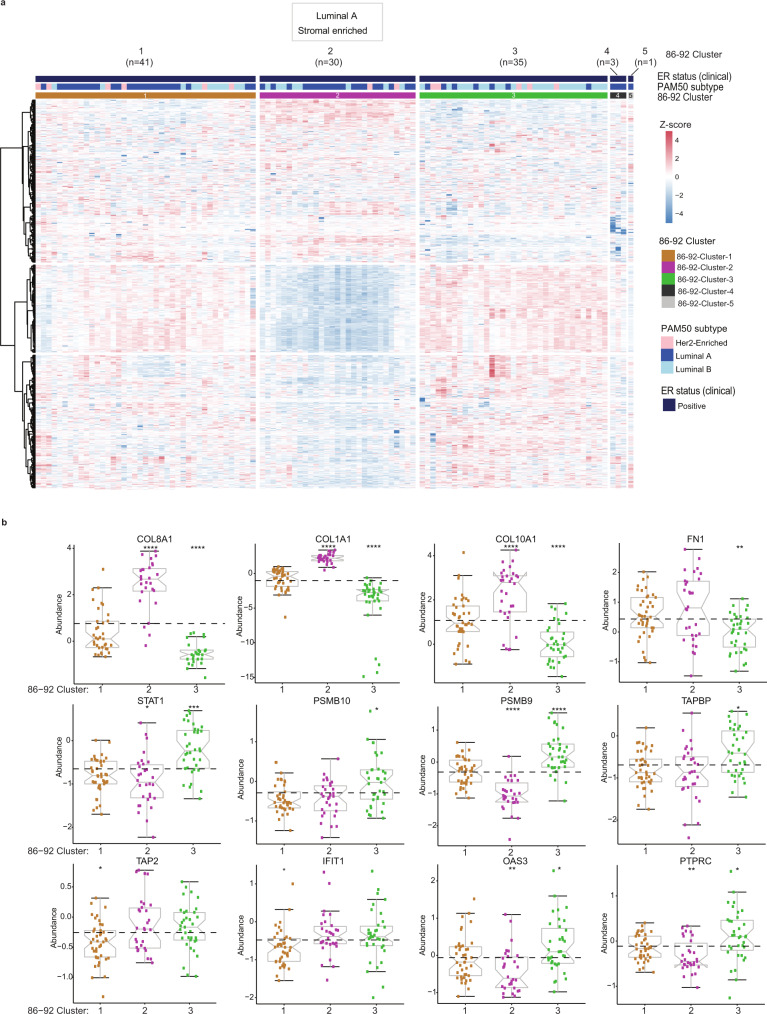
Despite advances in genomic classification of breast cancer, current clinical tests and treatment decisions are commonly based on protein level information. Formalin-fixed paraffin-embedded (FFPE) tissue specimens with extended clinical outcomes are widely available. Here, we perform comprehensive proteomic profiling of 300 FFPE breast cancer surgical specimens, 75 of each PAM50 subtype, from patients diagnosed in 2008-2013 (n = 178) and 1986-1992 (n = 122) with linked clinical outcomes. These two cohorts are analyzed separately, and we quantify 4214 proteins across all 300 samples. Within the aggressive PAM50-classified basal-like cases, proteomic profiling reveals two groups with one having characteristic immune hot expression features and highly favorable survival. Her2-Enriched cases separate into heterogeneous groups differing by extracellular matrix, lipid metabolism, and immune-response features. Within 88 triple-negative breast cancers, four proteomic clusters display features of basal-immune hot, basal-immune cold, mesenchymal, and luminal with disparate survival outcomes. Our proteomic analysis characterizes the heterogeneity of breast cancer in a clinically-applicable manner, identifies potential biomarkers and therapeutic targets, and provides a resource for clinical breast cancer classification.


Conflict of interest statement

S.K.L.C. reports receiving consulting fees from Novartis Pharma, Pfizer, Hoffman LaRoche, Merck, AstraZeneca, Eli Lilly. T.O.N. played a role in the development of the PAM50 gene expression classifier, which has been licensed to Veracyte Technologies. The other authors declare no competing interests.

Figures

Fig. 1
Fig. 1. Proteomic analysis of FFPE breast cancer tissue samples.
a The clinical features of the 300-tumor study cohort across the four PAM50 breast cancer subtypes. Samples were assembled from patients diagnosed with invasive breast cancer using tissue obtained prior to adjuvant systemic therapy in 2008–2013 (n = 178; the 08–13 cohort) and 1986–1992 (n = 122; the 86–92 cohort). The MS data were obtained with the 08–13 and 86–92 samples intermixed (see Fig. S1b batch design), however these two cohorts were analyzed separately. Pathological primary tumor size was defined as (T1 ≤ 2 cm), (T2 2–5 cm), (T3 > 5 cm); recurrence, (local, regional, distant). The feature list is in Supplementary Data 1c. LVI lymphovascular invasion, TNBC triple-negative breast cancer. b The distribution of the PAM50 subtypes for the 300 tumor samples described in a across the 86–92 and 08–13 cohorts. The study also included 38 normal breast reduction mammoplasty samples. Within the 08–13 cohort, a set of 88 cases were classified as TNBC by IHC and were analyzed as a separate cohort. c CONSORT flow diagram depicting the workflow numbers for the cases included in the study cohorts. TNBC triple-negative breast cancer. Source data are provided as a Source Data file.
Fig. 2
Fig. 2. Proteome unsupervised consensus clustering reveals distinct breast cancer subtypes.
a Uniform Manifold Approximation and Projection of the 08–13 cohort for the basal-like, luminal A, luminal B, and Her2-Enriched PAM50 subtypes based on all proteins quantified in every sample (4214). b Alluvial plot shows the relationship between PAM50 subtypes and the four proteomic consensus clusters in the 08–13 cohort. c Consensus clustering of 174 cases, based on the relative abundance of 1054 most variant proteins. Immune related is defined based on the protein function as involved in immune-response biological process and for each protein cluster, the most representative terms displayed on the heatmap were selected based on g:profiler enrichment analysis. Source data are provided as a Source Data file.
Fig. 3
Fig. 3. Key characteristics of the different proteomic breast cancer clusters in the 08–13 cohort.
a Kaplan Meier plots show RFS and OS for the four proteomic clusters. b Forest plots for multivariate survival analyses of RFS and OS in the four proteomic clusters. The error bars represent 95% confidence interval (CI) with hazard ratio (HR) result displayed as a plotted box. Results are derived from Cox regression models and stratified log-rank tests with 2-sided p-values at a significance level of 0.05. Results are unadjusted for multiple comparisons. c Volcano plot showing differentially expressed proteins between Cluster-3 (immune hot) vs. the other clusters. Immune-related proteins with log2 fold > 0.2 and adjusted BH p < 0.05 are highlighted red. Results are derived from peptide-level expression-change averaging (PECA) analysis, using modified t-test adjusted for multiple comparisons using the Benjamini–Hochberg method. d Gene set enrichment analysis (GSEA) of selected significant biological processes between the four proteomic clusters (adjusted p < 0.05). The enriched processes are listed in Supplementary Data 2. e Relative protein abundance of key subtype specific breast cancer proteins across the four proteomic clusters. Boxplots show the median (center bar), and the third and first quartiles (upper and lower edges, respectively) of protein expression. Horizontal dotted line is the base mean. Boxplot whiskers range extends to the most extreme data point which is no more than 1.5 times the interquartile range from the box. Asterisks show the pairwise significance of the mean in each group against “all” as a reference: (*p < 0.05), (**p < 0.01), (***p < 0.001), (****p < 0.0001). Results are derived from a 2-sided t-test of the means of each cluster compared to all. Protein abundance values are based on log2 ratio for PSMs abundances divided by the relative PIS value in each TMT plex. For each protein, the median ratio of the 5 most abundant PSMs was used as relative abundance. See also Supplementary Fig. 6c. Source data are provided as a Source Data file.
Fig. 4
Fig. 4. Morphological expression of key immune biomarkers characterizes the proteome immune hot cluster in the 08–13 cohort.
a Intratumoral percentage distribution of stromal TILs by H&E (left panel), CD8+ TILs by IHC (middle panel), and stroma by H&E (right panel) for tumor sections. The horizontal dotted line is the base mean. Boxplots show the median (center bar), and the third and first quartiles (upper and lower edges, respectively). Boxplot whiskers range extends to the most extreme data point which is no more than 1.5 times the interquartile range from the box. Asterisks show the pairwise significance of the mean in each group against “all” as a reference: (*p < 0.05), (**p < 0.01), (***p < 0.001), (****p < 0.0001). Results are derived from a Wilcoxon test with 2-sided p-value. b Representative images of IHC expression of four proteins highly expressed in the immune hot cluster at ×20 and ×40 magnification. Scale bar = 100 µm. c Verification of proteomic expression of four proteins highly expressed in Cluster-3 (immune hot) by immunohistochemistry. Scores use the H scoring system (intensity × positivity) for cytoplasmic staining in the invasive tumor cells. Boxplots show the median (center bar), and the third and first quartiles (upper and lower edges, respectively). Boxplot whiskers range extends to the most extreme data point which is no more than 1.5 times the interquartile range from the box. Asterisks show the pairwise significance of the mean in each group against “all” as a reference: (*p < 0.05), (**p < 0.01), (***p < 0.001), (****p < 0.0001). TILs tumor infiltrating lymphocytes. Source data are provided as a Source Data file.
Fig. 5
Fig. 5. Proteomic analysis reveals four clinically important subtypes in TNBC within the 08–13 cohort.
a Consensus clustering of 88 IHC-defined TNBC cases, based on the relative abundance of 1055 most variant proteins. Immune related is defined based on the protein function as involved in immune-response biological process and for each protein cluster, the most representative terms displayed on the heatmap were selected based on g:profiler enrichment analysis. b Alluvial plot shows the distribution of PAM50 subtypes across the TNBC clusters. c Kaplan Meier plots for RFS and OS across the TNBC clusters. d GSEA of selected significant biological processes between the TNBC clusters. Results are derived from normalized enrichment scores for most enriched pathways for each cluster compared to others with adjusted p < 0.05. IHC immunohistochemistry, RFS recurrence-free survival, OS overall survival. The enriched processes are listed in Supplementary Data 4. Source data are provided as a Source Data file.
Fig. 6
Fig. 6. RNA-protein correlated stratification of biological subgroups and clinical outcomes in TNBC.
a Comparison between TNBC proteomic clusters with published RNA-based TNBC subgroups. BLIA basal-immune activated, BLIS basal-immune suppressed, MES mesenchymal, LAR luminal androgen receptor. 35 cognate proteins identified from the 80 gene TNBC RNA classifier were used to generate the correlation heatmap based on the median expression of proteins for each TNBC subgroup. b Volcano plot showing proteins significantly associated with RFS in TNBC. Results are based on a Cox regression hazard model with a 2-sided log-rank p-value. Results were adjusted for multiple comparison using the Benjamini–Hochberg method. The x-axis is log2 hazard ratio (HR) and the y-axis is −log10 (p-value). Low (blue) and high (orange) HR’s indicate proteins associated with longer and shorter survival, respectively. The horizontal and vertical lines indicate p < 0.05, and log2HR > 0 or <0, respectively. The proteins and HR’s are listed in Supplementary Data 4. For visibility reasons only the top 20 proteins showing the lowest HR and highest HR with adjusted p-value < 0.05 were included in the plot. TNBC triple-negative breast cancer, RFS recurrence-free survival. Source data are provided as a Source Data file.
Fig. 7
Fig. 7. Proteomic signatures capture the biologic heterogeneity in luminal breast cancers in the 86–92 cohort.
a Consensus clustering of 110 evaluable cases, based on the relative abundance of 1054 most variant proteins. Four cases formed two separate clusters. b The expression levels of selected proteins in the 3 main clusters. Boxplots show the median (center bar), and the third and first quartiles (upper and lower edges, respectively) of protein expression. Each data point is one case. Boxplot whiskers range extends to the most extreme data point which is no more than 1.5 times the interquartile range from the box. Asterisks show the pairwise significance of the mean in each group against “all” as a reference: (*p < 0.05), (**p < 0.01), (***p < 0.001), (****p < 0.0001). Results are derived from a 2-sided t-test of the means of each cluster compared to all. Source data are provided as a Source Data file.

References

    1. Perou CM, et al. Molecular portraits of human breast tumours. Nature. 2000;406:747–752. - PubMed
    1. Sorlie T, et al. Repeated observation of breast tumor subtypes in independent gene expression data sets. Proc. Natl Acad. Sci. USA. 2003;100:8418–8423. - PMC - PubMed
    1. Sørlie T, et al. Gene expression patterns of breast carcinomas distinguish tumor subclasses with clinical implications. Proc. Natl Acad. Sci. USA. 2001;98:10869–10874. - PMC - PubMed
    1. Parker JS, et al. Supervised risk predictor of breast cancer based on intrinsic subtypes. J. Clin. Oncol. 2009;27:1160–1167. - PMC - PubMed
    1. Wallden B, et al. Development and verification of the PAM50-based Prosigna breast cancer gene signature assay. BMC Med Genomics. 2015;8:54. - PMC - PubMed

Publication types

MeSH terms

Grants and funding