. 2022 Feb 16;13(1):884.
doi: 10.1038/s41467-022-28506-2.

Early alveolar macrophage response and IL-1R-dependent T cell priming determine transmissibility of Mycobacterium tuberculosis strains

Affiliations

Early alveolar macrophage response and IL-1R-dependent T cell priming determine transmissibility of Mycobacterium tuberculosis strains

Arianne Lovey et al. Nat Commun. .

Abstract

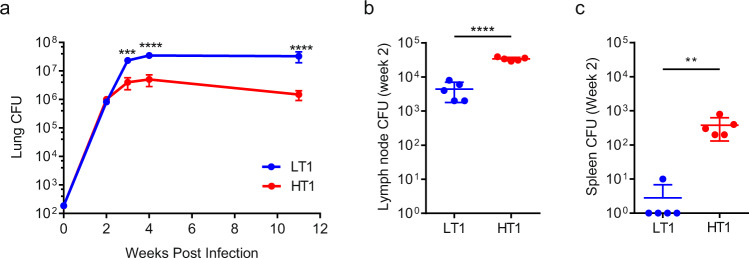
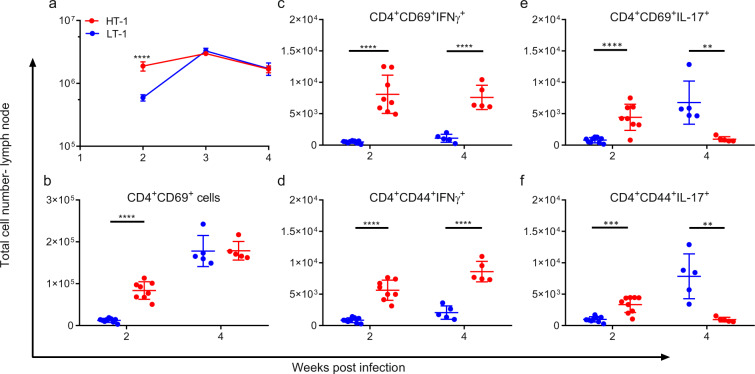
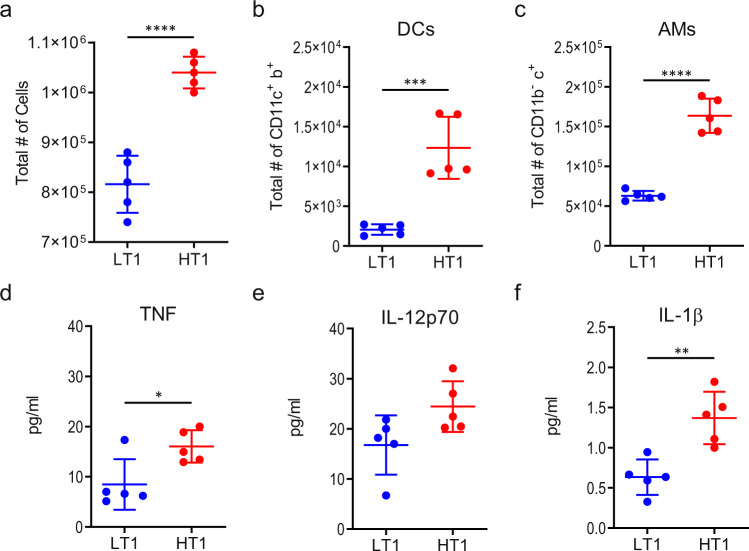
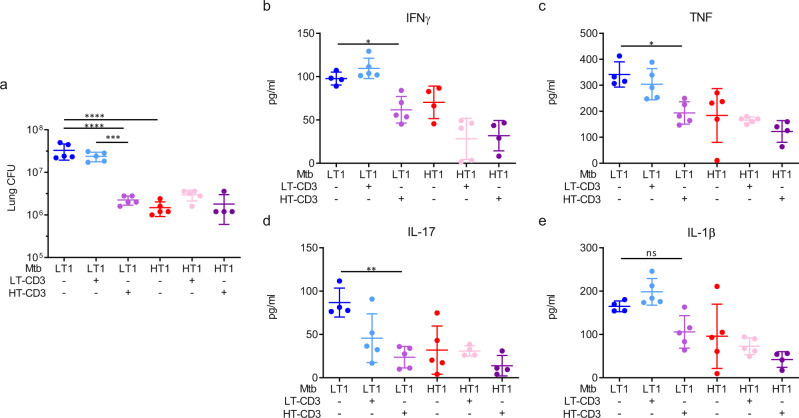
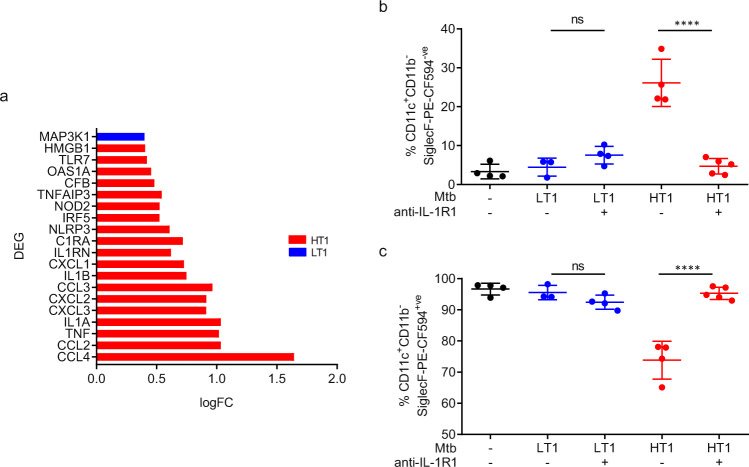
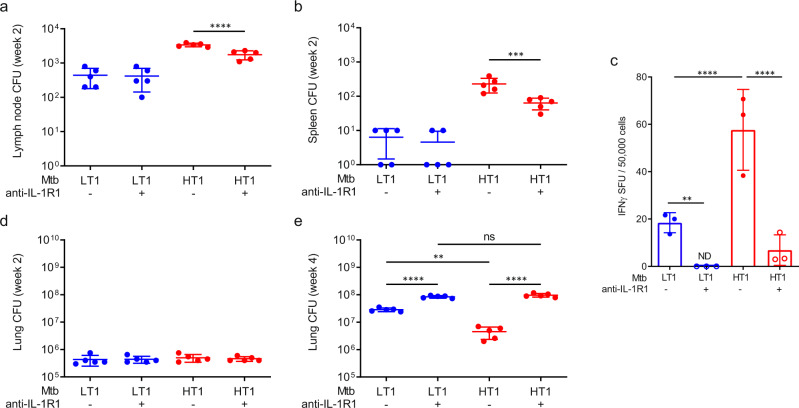
Mechanisms underlying variability in transmission of Mycobacterium tuberculosis strains remain undefined. By characterizing high and low transmission strains of M.tuberculosis in mice, we show here that high transmission M.tuberculosis strain induce rapid IL-1R-dependent alveolar macrophage migration from the alveolar space into the interstitium and that this action is key to subsequent temporal events of early dissemination of bacteria to the lymph nodes, Th1 priming, granulomatous response and bacterial control. In contrast, IL-1R-dependent alveolar macrophage migration and early dissemination of bacteria to lymph nodes is significantly impeded in infection with low transmission M.tuberculosis strain; these events promote the development of Th17 immunity, fostering neutrophilic inflammation and increased bacterial replication. Our results suggest that by inducing granulomas with the potential to develop into cavitary lesions that aids bacterial escape into the airways, high transmission M.tuberculosis strain is poised for greater transmissibility. These findings implicate bacterial heterogeneity as an important modifier of TB disease manifestations and transmission.


Conflict of interest statement

The authors declare no competing interests.

Figures

Fig. 1
Fig. 1. Increased dissemination of Mtb to lymph node and spleen in Mtb-HT1 infected mice.
C3HeB/FeJ mice were infected with ~100 CFU of the indicated strain via Glas-Col aerosol exposure. At the indicated time following infection, mice were sacrificed and CFU was determined in lung (a), draining lymph nodes (b) and spleen (c). Sample size of n = 5 mice were included for each strain and for each time point. Data are presented as mean values +/− SD. Significance was determined using two-way ANOVA with Bonferroni post-test (a) and unpaired t tests (b and c). ** P = 0.0095, ****P < 0.0001. The data are representative of one of two individual experiments with Mtb-HT1 and Mtb-LT1 and was repeated with Mtb-HT2 and Mtb-LT2. Source data are provided as a Source Data file.
Fig. 2
Fig. 2. Increased dissemination in conjunction with early Th1 priming in the lymph nodes of Mtb-HT infected mice.
C3HeB/FeJ mice were infected with ~100 CFU of the indicated strain via Glas-Col aerosol exposure. At the indicated time post infection mice were sacrificed and mediastinal lymph nodes were isolated. Single cells were stimulated for 3 h with Mtb-H37Rv lysate and mycobacterial ESAT-6 and CFP-10 peptide pools and stained with a panel of cell surface antibodies, fixed and permeabilized, and then stained with a panel of intracellular antibodies. Cellular recruitment to the lymph node presented as absolute number (a) and percent of activated CD4+ T cells in the lymph nodes (b) was evaluated in Mtb-LT1 and Mtb-HT1 infected mice at weeks 2, 3, and 4 post infection. Percent of CD69+ (c) and CD44+ (d) CD4+ T cells expressing IFNγ+ and percent of CD69+ (e) and CD44+ (f) CD4+ T cells expressing IL-17 evaluated in the lymph nodes at weeks 2 and 4 post infection. Data are presented as mean values +/− SD. Source data are provided as a Source Data file. Sample size of n = 8 mice were included for 2-week time point and n = 5 mice for week 3 and 4 time points. Significance was determined using two-way ANOVA with Bonferroni post-test (a) and unpaired t test (bf). **P = 0.0026 in panel (e), **P = 0.0056 in panel (f), ***p < 0.001, ****p < 0.0001. The experiment was repeated with Mtb-HT2 and Mtb-LT2.
Fig. 3
Fig. 3. Different microenvironments present in the lungs of Mtb-HT and Mtb-LT infected mice at week 2 post infection.
af C3HeB/FeJ mice were infected with ~100 CFU of the indicated strain via Glas-Col aerosol exposure. At the indicated time post infection mice were sacrificed and single cell suspensions and total number of recruited cells (a) cDCs (CD3-CD19-CD11c+MHCII+) (b) and AMs (CD3-CD19-CD11b-CD11c+SiglecF+ (c) were calculated following acquisition on LSRFortessa X-20 and FlowJo analysis. MSD ELISA of lung lysates was used to determine TNFα (d), IL-12 (e), and IL-1β (f) protein levels. Data are presented as mean values +/− SD. Source data are provided as a Source Data file. Sample size of n = 5 mice was included in each group. Significance was determined using unpaired t test. *P = 0.0217, **P = 0.0031, ***P < 0.001, ****P < 0.0001. The experiment was repeated with Mtb-HT2 and Mtb-LT2.
Fig. 4
Fig. 4. T cell response is skewed towards Th17 in Mtb-LT infection. C3HeB/FeJ mice were infected with ~100 CFU of the indicated strain via Glas-Col aerosol exposure.
IFNγ (a) and IL-17A (b) protein expression at weeks 2, 3, and 4 post infection was determined by ELISA. Single cell suspensions prepared from the lungs were stimulated for 3 h with Mtb-H37Rv lysate and mycobacterial ESAT-6 and CFP-10 peptide pools and stained with a panel of cell surface antibodies, fixed and permeabilized, and then stained with a panel of intracellular antibodies. Data are presented as percent of IFNγ+CD4+ (c) or IL-17+CD4+ (d) T cells. In a separate experiment Mtb-HT1, Mtb-LT1, and dual Mtb-HT1/LT1 infected mice were evaluated for IFNγ T cells at week 4 post infection (e). Data are presented as mean values +/− SD. Source data are provided as a Source Data file. Sample size of n = 5 mice was included in each group. Significance was determined using two-way ANOVA with Bonferroni post-test (a and b), unpaired t test (c and d) or one-way ANOVA with Tukey’s correction (e) *P = 0.0134 (panel e), **P = 0.0011 (panel b), **P = 0.0052 (panel c) and P = 0.0011 (panel e), ***P < 0.001, ****P < 0.0001. The experiment was repeated with Mtb-HT2 and Mtb-LT2.
Fig. 5
Fig. 5. Effector T cells from Mtb-HT infected mice reduce bacterial burden and inflammation in Mtb-LT infected mice.
Three days prior to infection naïve mice were retro-orbitally injected with PBS or 2 × 106 CD3+ T cells isolated from 6 to 7-week Mtb-LT1 or Mtb-HT1 infected mice. On the day of infection, half of the mice in each group were infected with Mtb-HT1 and the other half with Mtb-LT1 via Glas-Col aerosol exposure. At 11 weeks post-infection, lung bacterial burden was determined and presented as CFU (a) and protein levels of IFNγ (b), TNF (c), IL-17 (d), and IL-1β (e) was measured in lung lysates by ELISA. Data are presented as mean values +/− SD. Source data are provided as a Source Data file. Sample size of n = 5 mice was included in each group. Significance was determined using one-way ANOVA with Tukey’s correction *P = 0.0421 (IFNγ panel b), **P = 0.0013 (IL-17, panel c) *P = 0.0132 (TNF, panel b), ***P < 0.001, ****P < 0.0001. The experiment was repeated with Mtb-HT2 and Mtb-LT2.
Fig. 6
Fig. 6. IL-1R dependent migration of alveolar macrophages in Mtb-HT infection. C3HeB/FeJ mice were infected with ~100 CFU of Mtb-LT1 or Mtb-HT1 via Glas-Col aerosol exposure.
At 13 days post infection, fluorescent-labeled anti-SiglecF antibody was intratracheally administered 30 min prior to sacrifice to stain and sort airway resident cells. Differential gene expression analysis by NanoString was performed on airway-resident AMs (CD11b-CD11c+SiglecF+) sorted from single cell lung suspensions pooled from five Mtb-HT1 and five Mtb-LT1 infected mice and the data are presented to show log fold change (logFC) of top DEG (Y-axis, P < 0.05) (a). For IL-1R dependent AM migration, groups of infected mice were administered intra-peritoneally on days 8, 10, and 12 post infection with either 200 μg α-IL-1R1 antibody or isotype control. Data are presented as airway-resident AMs (CD11b-CD11c+SiglecF+) (b) and AMs migrated into the interstitium (CD11b-CD11c+SiglecF−) (c). Data are presented as mean values +/− SD (panels b and c). Source data are provided as a Source Data file. Sample size of n = 4 mice were included for the first 4 groups and sample size of n = 5 mice for group 5 for panels (b, c). Significance was determined using one-way ANOVA with Tukey’s correction. ****P < 0.0001. The data are representative of one of two individual experiments with Mtb-HT1 and Mtb-LT1 and was repeated with Mtb-HT2 and Mtb-LT2.
Fig. 7
Fig. 7. Rapid T cell priming and control of bacterial replication in Mtb-HT infection is dependent on IL-1R1 signaling.
C3HeB/FeJ mice were infected with ~100 CFU of the indicated strain via Glas-Col aerosol exposure. On days 8, 10, and 12 post infection 200μg of α-IL-1R1 antibody (+) or isotype control (−) was administered to the mice. Bacterial burden was determined at 2 weeks in the mediastinal lymph nodes (a), spleen (b), and lung (d) and at 4 weeks in the lung (e). At 2 weeks of infection, the frequency of IFNγ-secreting T cells was measured by ELISPOT, and data are presented as spot forming units (SFU)/50,000 LN cells. Data are presented as mean values +/− SD. Source data are provided as a Source Data file. Sample size of n = 5 mice were included for panels (a, b, d, e) and sample size of n = 3 mice was included for panel (c). Significance was determined using one-way ANOVA with Tukey’s correction. **P = 0.0064 (panel c), **P = 0.0032 (panel e), **P < 0.01, ***P < 0.001, ****P < 0.0001. The data are representative of one of two individual experiments with Mtb-HT1 and Mtb-LT1.
Fig. 8
Fig. 8. Transient inhibition of IL-1R signaling results in increased pathology in Mtb-HT infected mice.
C3HeB/FeJ mice were infected with ~100 CFU of the indicated strain via Glas-Col aerosol exposure. On days 8, 10, and 12 post infection 200ug α-IL-1R1 (+) or isotype control (−) was administered to the mice. At 4 weeks post infection mice were sacrificed and the right middle and inferior lung lobes were isolated to obtain single cells. Following perfusion, the left lobe was formalin-fixed, paraffin-embedded, and hematoxylin and eosin staining were carried out. Data are presented as percent of neutrophils (a) and inflammatory monocytes (b). Data are presented as mean values +/− SD. Source data are provided as a Source Data file. Representative H&E-stained lung sections for the indicated strains at week 4 post infection with and without transient IL-1R signaling. Scale bars: 5 mm (c). Five mice were included in each group. Significance was determined using one-way ANOVA with Tukey’s correction. ****P < 0.0001.

References

    1. World Health Organisation. Global tuberculosis Report 2020 1–232 (World Health Organisation, 2020).
    1. Riley RL, Wells WF, Mills CC, Nyka W, McLean RL. Air hygiene in tuberculosis: Quantitative studies of infectivity and control in a pilot ward. Am. Rev. Tuberc. 1957;75:420–431. - PubMed
    1. Riley RL. Aerial dissemination of pulmonary tuberculosis. Am. Rev. Tuberc. 1957;76:931–941. - PubMed
    1. Riley RL, et al. Aerial dissemination of pulmonary tuberculosis. A two-year study of contagion in a tuberculosis ward. 1959. Am. J. Epidemiol. 1995;142:3–14. - PubMed
    1. Dharmadhikari AS, et al. Natural infection of guinea pigs exposed to patients with highly drug-resistant tuberculosis. Tuberculosis. 2011;91:329–338. - PMC - PubMed

Publication types

MeSH terms

Substances