. 2022 Feb 16;12(1):2580.
doi: 10.1038/s41598-021-04487-y.

The natural reduction of threat in selected systems of old buildings containing asbestos

Affiliations

The natural reduction of threat in selected systems of old buildings containing asbestos

Andrzej Obmiński. Sci Rep. .

Abstract

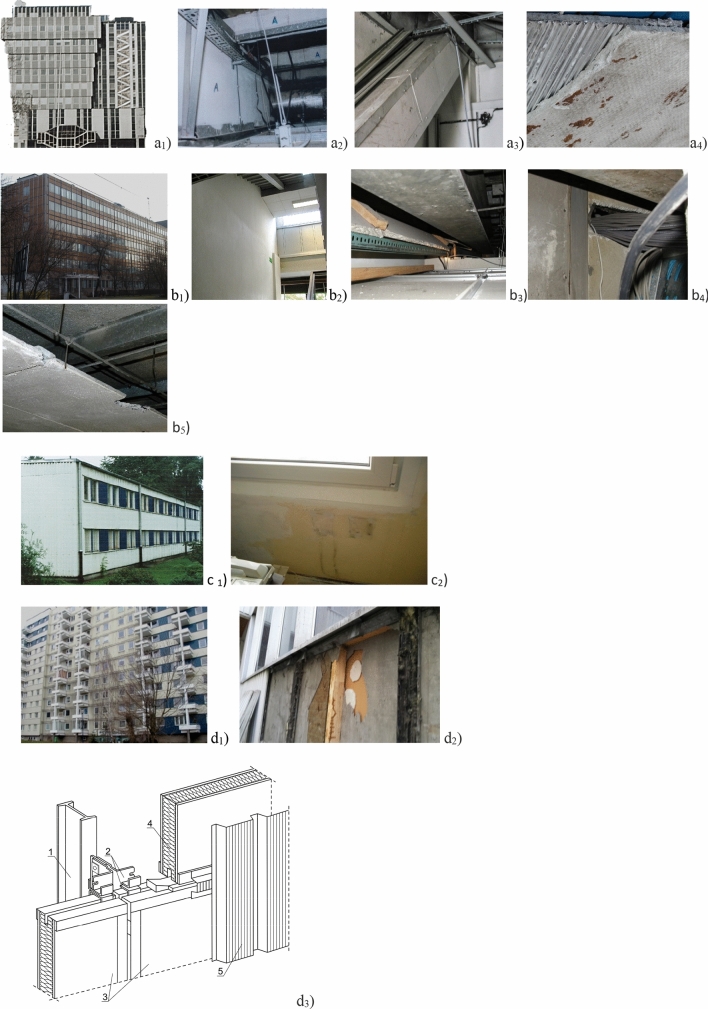
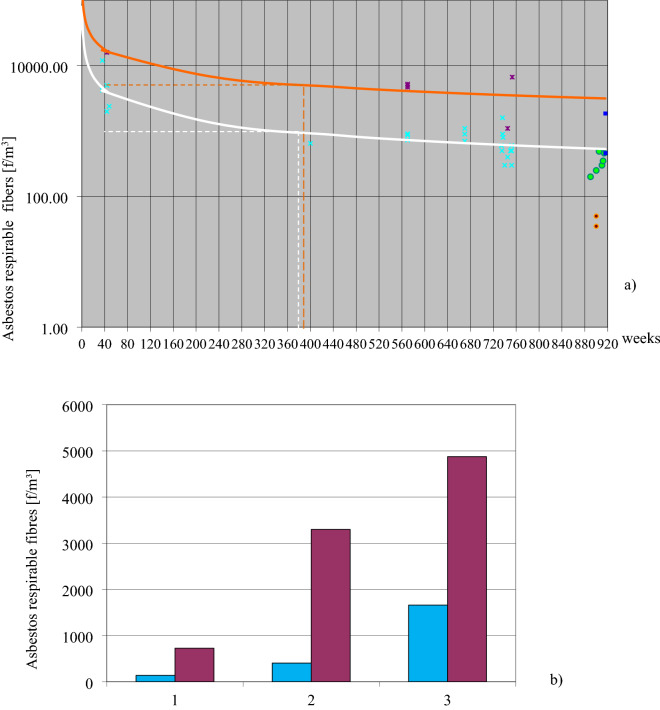
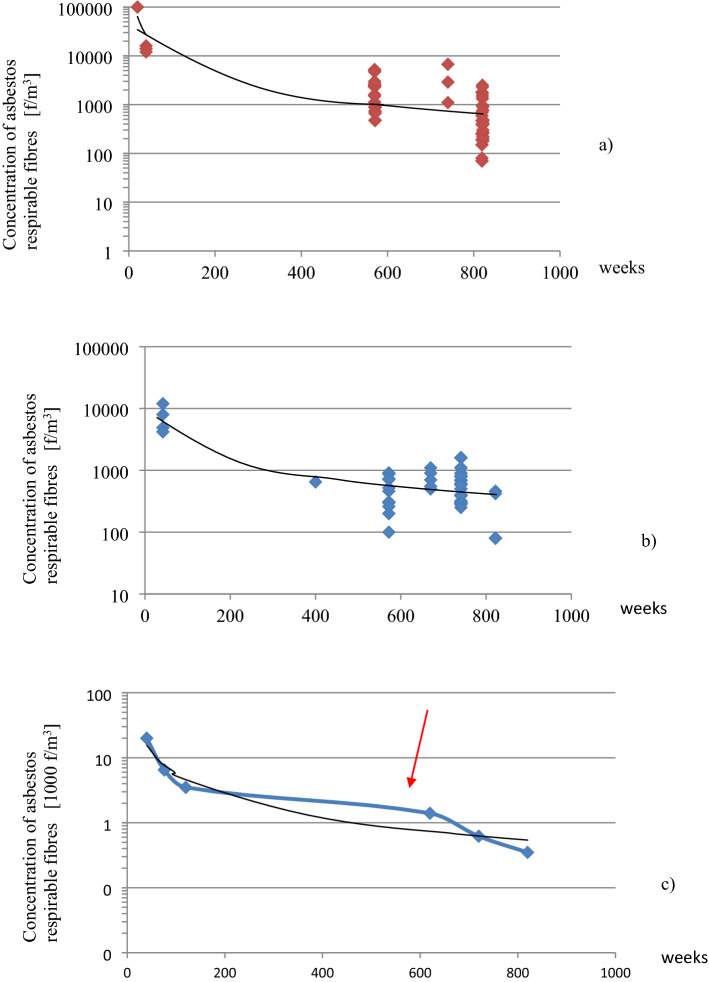
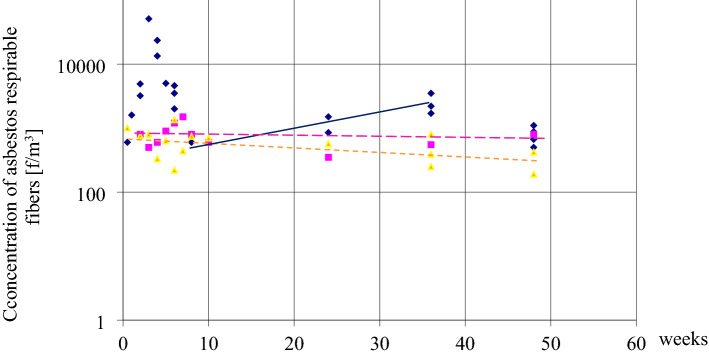
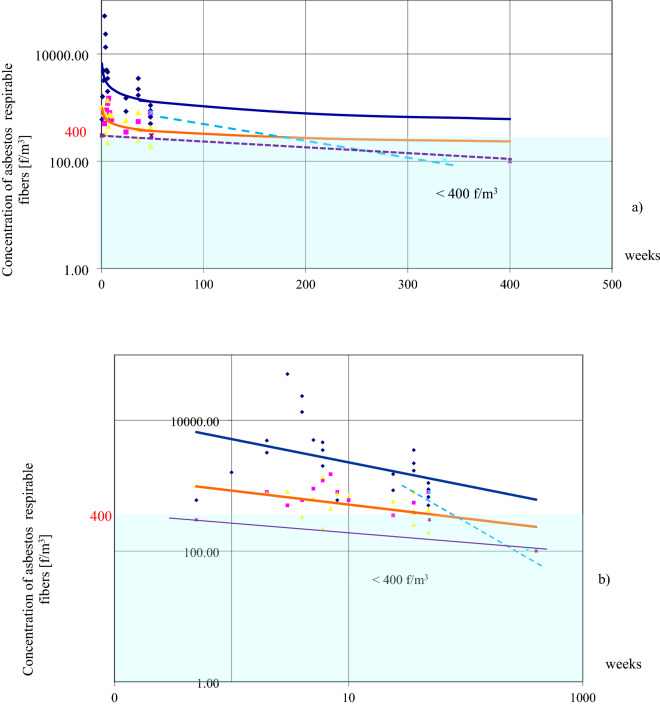
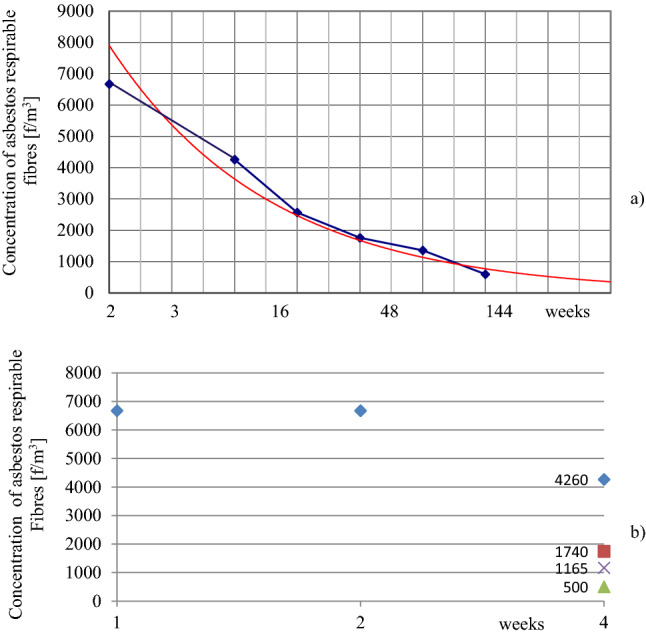
The aim of this study was to measure changes in asbestos dust concentrations over extended use in old building systems. Buildings from different systems during their service lifetimes and after asbestos removal were tested. Asbestos dust concentrations decreased in all building systems due to air exchange and other phenomena in the absence of new active dust sources. Currently, with proper use of those buildings, average values of dust concentrations did not exceed 300-400 f/m3 with a downward trend to < 300 f/m3. The results of these studies were obtained with a modified optical microscopy technique, verified by SEM and TEM methods. The graphical trends in concentration changes over longer periods illustrate the potency of opposing factors reducing and increasing indoor air pollution. If removal asbestos work was not carried out carefully, single measurements conducted in the short-term and mandated immediately after asbestos removal may not detect hazards that appear over time. Monitoring buildings over longer periods allows detection of significant contamination changes. In many cases, the minimal air contamination undermines the desirability of removing asbestos in old buildings.


Conflict of interest statement

The author declares no competing interests.

Figures

Figure 1
Figure 1
The figures show examples of non-rigid (ac) and rigid (d) structures. All photographs relate to the buildings and their contamination presented in the article. (a1) View of the “BOLETICE” from CSRS, front sandwich wall with glass facade. Elevation of one of the twin towers of the building; (a2) Fire protection of walls and structures made of “PYRAL” panels—friable ACM (marked "A"), visible from the technical space, above the suspended ceiling of the utility room; (a3) Fire protection of the diagonal structure made of "PYRAL" board; (a4) "PYRAL", a fireproof chrysotile asbestos board used in the “BOLETICE” building. The two layers of the board are bonded with a fine-wave aluminium foil; (b1) “LIPSK” from DDR, building facade. Under the facade there are the “GLAGIT” hard asbestos cement plates contain 13% asbestos; (b2) Internal walls in the stairwell of the building type “LIPSK” contain “SOKALIT”, soft plates (20% asbestos, "friable" ACM as fire—proof product); (b3) Space above the suspended ceiling. The fireproof "SOKALIT" panel is used to shield the electrical cables (in the photo in an oblique position); (b4) Operational damage to "SOKALIT" panels caused by modernization and cabling of the building with a computer network. The picture shows a hole in the panel through which the wiring harness passes; (b5) Damaged "SOKALIT" panels used as a suspended ceiling; (c1) System “BERLIN” from DDR; (c2) Operational damage to the "SOKALIT" panels caused by incorrectly conducted renovation work in the BERLIN building. (Detailed description in the main text). (d1) Different buildings type of “BISTYP” (Polish system): existing as office, hospital and residential on the photograph. (d2) A fragment of the “BISTYP” building wall after removal of the corrugated sheet metal (a facade). Visible layers of PW3/A board to which a cartoon-gypsum board was glued from the inside; (d3) Construction of “BISTYP” sandwich wall with PW3/A or PŻ3W panel. Description of drawing elements: (1) Steel pole, (2) Steel connector, (3) PW3/A or PŻW3/A, sandwich panel with a mineral wool core, faced on both sides with (3)—asbestos cement flat panels, (4) Mineral wool thermal insulation core of PW/3A board, (5) Wall facade made of corrugated sheet steel.
Figure 2
Figure 2
Differences in the asbestos dust concentrations in the air (a) The trend of changes in asbestos dust concentrations in the “BOLETICE” system building. Dark purple times: The determination of air samples taken in a dynamic way (one point means the average of two measurements made at the same time and in the same room). Concentration change trends at such samplings were marked as an orange curve. Light blue times: The averaged values of dust concentration obtained during normal building use (standard user activity, working central ventilation, without cabinet fans). Concentration change trends were presented as the white color curve. Measurements made 12 months after the building was no longer in use (after approximately 19 years). The tests were carried out in the same rooms during its operation. Green circle: Test conditions: mechanical ventilation and heating excluded in the building, no operational vibrations related to the use of the building. Dynamic air sampling (analogous to earlier techniques: activities to run dust seated on horizontal surfaces). Blue square: Measurements made at the same time in rooms with fresh, large damage to the sandwich wall created after the building was no longer in use: exposed, damaged, soft products (friable) – “PYRAL” board. Dynamic air sampling: the average asbestos dust concentration was 1200 f./m3. Red circle: Measurements made outdoors at ~ 8 m from the building. The mean concentration was < 100 f/m3. (b) The asbestos dust concentration differences in the air of the three rooms with different levels of dust concentration. Turquoise—static sampling, magenta—dynamic sampling. Approximately two years before the end of the measurements, the building was taken out of use. The overall changes are illustrated by the curve based on average sample values taken statically and dynamically in Fig. 3. This figure shows the same individual 80 measurements, depending on the sampling method, separately and after combining all values into one chart (Fig. 3c). Figures 2 and 3 should be analyzed together because they are shown in the same coordinate system (Y—fiber concentration, X—time in weeks) and present results that complement each other.
Figure 3
Figure 3
Analysis of changes in asbestos concentration in the BOLETICE building. (a) Results of dust concentration in the building during dynamic sampling. (b) Results of dust concentration in the building during static sampling. (c) Averaged concentration values from static and dynamic sampling in the BOLETICE building as a blue curve. The trend of change is represented by the black curve. The red arrow marks the end of building use.
Figure 4
Figure 4
Changes in air pollution of three buildings “LIPSK” within 48 weeks. Dark blue diamond: Building (1) asbestos removal: Changes in asbestos dust concentrations from the commencement of asbestos dismantling, realization, and completion. During removal, dust leaked out of the work zone and increased its concentration during the first three weeks, up to the 5th week, up to 51,000 f/m3. The dark blue line indicates an increase in contamination that would not have been detected under the conditions of standard acceptance of the dismantling work and measurements immediately after the completed work. Pink square: Building (2), normal room operation. Yellow triangle: Building (3), normal room operation. After the tenth week of research, special operating rules were introduced in this building (room ventilation, wet mopping of surfaces, daily vacuuming with a HEPA filter, ACM marking, and prohibition of work that violates these products). The dotted orange line indicates a slight downward trend in pollution.
Figure 5
Figure 5
Contamination comparison in rigid (“BISTYP”) and non-rigid structures (“LIPSK”). (a) The reduction of the rate of change in the concentration of asbestos dust over a period of time, after reaching a concentration of < 400 f/m3. This applies to objects operated in the same way for longer periods of time without damaging the ACM. The vertical axis corresponds to dust concentrations on a logarithmic scale. The horizontal axis denotes the time when measurements were taken (weeks) on a linear scale. (b) The same data as in (a). Time of measurements [weeks] on a log scale (on the horizontal axis). The figure shows a steady decline in asbestos concentrations in all cases over an extended period.
Figure 6
Figure 6
Fiber concentrations in the “BERLIN” building after its interrupted renovation. (a) Fiber concentration in the “BERLIN” building during renovation, recorded to the 144th week after the work was stopped (this work was conducted without knowledge of ACM in the building). Average sample values taken on the same day of sampling in different rooms (a time in a logarithmic scale). (b) Analysis, including measurements in rooms with increased ventilation and room airing. Green triangle: renovated rooms after 20 days of ventilation. Purple times: rooms not renovated, in use. Brown square: renovated rooms, not in use. Blue diamond: normal use after renovation.

Similar articles

Cited by

References

    1. Upton, A. C. Asbestos in Public and Commercial Buildings—A Literature Revive and Synthesis of Current Knowledge. HEI Health Effect Institute—Asbestos Research, Special Report https://www.healtheffects.org/publication/asbestos-public-and-commercial... (1991).
    1. Gaualtieri AF, et al. Ambient monitoring of asbestos in selected Italian living areas. J. Environ. Manag. 2009;90(11):3540–3552. doi: 10.1016/j.jenvman.2009.06.007. - DOI - PubMed
    1. SRC, Inc. Summary of Published Measurements of Asbestos Levels In Ambient Air. Denver, Colorado: SRC Report prepared for US EPA Region 8, 05//20/2013 https://vdocuments.site/summary-of-published-measurements-of-asbestos-le... (2013).
    1. Kadlewicz K. Testing of the asbestos fibres concentration in the atmosphere at workstations and in the environment. Res. Rep. Min. Environ. Q. 2009;4:19–40.
    1. Burdett GJ, Dewberry K, Staff J. Airborne Asbestos exposures from warm air heating systems in schools. Ann. Occup. Hyg. 2016;60(1):27–39. doi: 10.1093/annhyg/mev062. - DOI - PMC - PubMed