. 2022 Feb 16;12(1):2630.
doi: 10.1038/s41598-022-05822-7.

A machine learning model for predicting deterioration of COVID-19 inpatients

Affiliations

A machine learning model for predicting deterioration of COVID-19 inpatients

Omer Noy et al. Sci Rep. .

Abstract

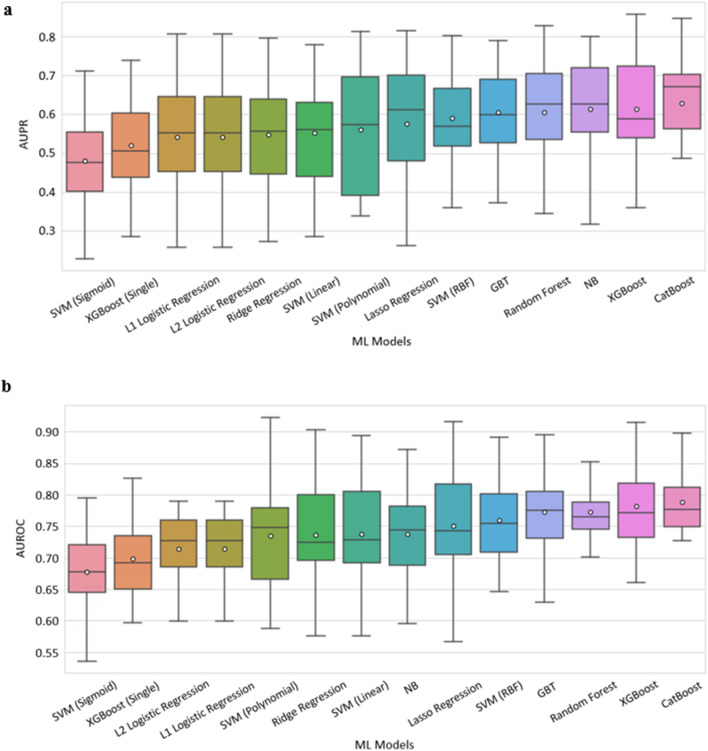
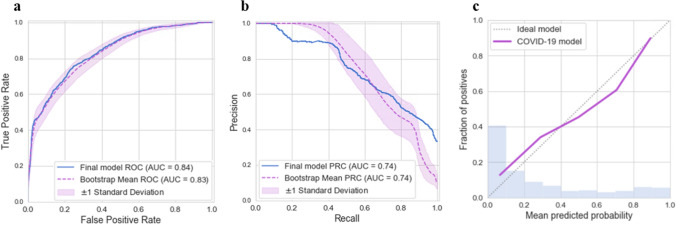
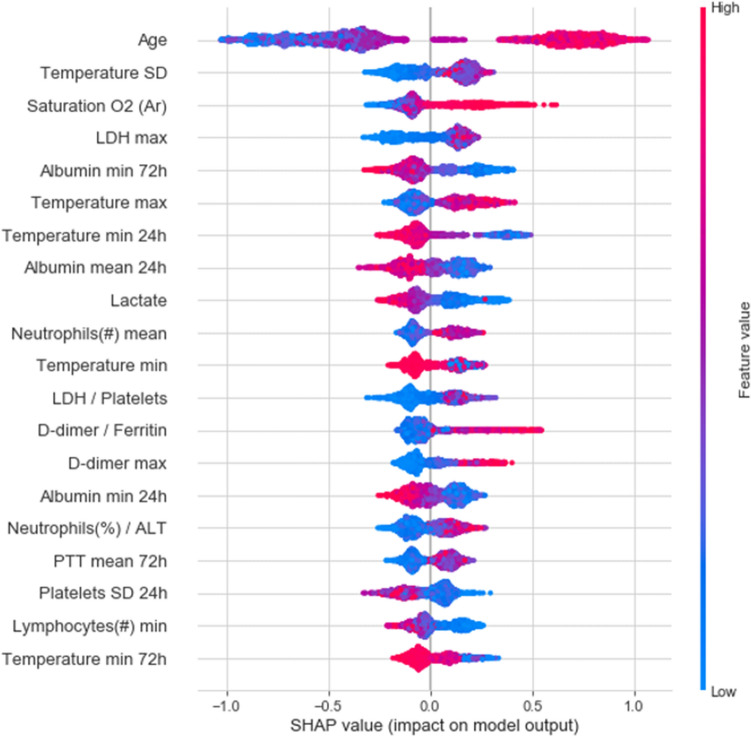
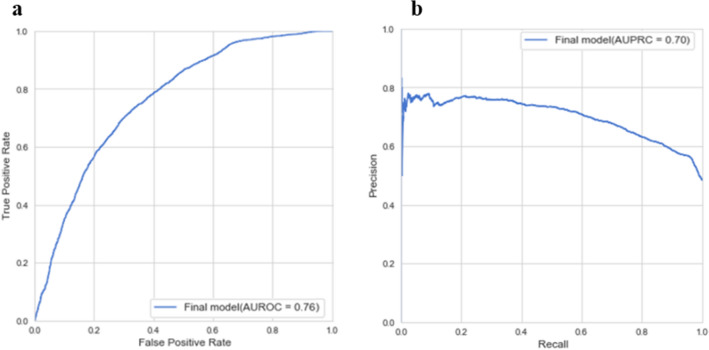
The COVID-19 pandemic has been spreading worldwide since December 2019, presenting an urgent threat to global health. Due to the limited understanding of disease progression and of the risk factors for the disease, it is a clinical challenge to predict which hospitalized patients will deteriorate. Moreover, several studies suggested that taking early measures for treating patients at risk of deterioration could prevent or lessen condition worsening and the need for mechanical ventilation. We developed a predictive model for early identification of patients at risk for clinical deterioration by retrospective analysis of electronic health records of COVID-19 inpatients at the two largest medical centers in Israel. Our model employs machine learning methods and uses routine clinical features such as vital signs, lab measurements, demographics, and background disease. Deterioration was defined as a high NEWS2 score adjusted to COVID-19. In the prediction of deterioration within the next 7-30 h, the model achieved an area under the ROC curve of 0.84 and an area under the precision-recall curve of 0.74. In external validation on data from a different hospital, it achieved values of 0.76 and 0.7, respectively.


Conflict of interest statement

The authors declare no competing interests.

Figures

Figure 1
Figure 1
Performance of 14 machine learning models that predict mNEWS2 ≥ 7. Comparison of machine learning methods using 20-fold cross-validation over the training set within the development dataset. (a) AUPR. (b) AUROC. The horizontal line indicates the median, and the white circle indicates the mean. The models are sorted by the mean AUC.
Figure 2
Figure 2
Performance of the final model on the testing set within the development set. (a) AUROC. (b) AUPR. Solid curves were computed on the total set. Dashed curves were computed with a bootstrap procedure with 100 iterations, where, in each iteration, 50% of the testing set was sampled with replacement. (c) Calibration plot for the relationship between the predicted and observed probabilities for COVID-19 deterioration. The dashed diagonal line represents an ideal calibration. The purple line represents the actual model performance in five discretized bins. The blue histogram is the distribution of the risk predictions.
Figure 3
Figure 3
20 features with highest mean absolute SHAP values. Features (rows) are ordered in decreasing overall importance to the prediction. The plot for each feature shows the SHAP value for each observation on the x-axis, with color representing the value of the feature from low (blue) to high (red). The absolute value indicates the extent of the contribution of the feature, while its sign indicates whether the contribution is positive or negative. SD: standard deviation; /: the ratio between two features. 24 h,72 h: time windows within the statistic was computed. If not mentioned, the statistics is calculated on the entire hospitalization period so far.
Figure 4
Figure 4
External validation of the final model on the TASMC data. (a) AUROC. (b) AUPRC.

References

    1. Cucinotta, D. & Vanelli, M. WHO declares COVID-19 a pandemic. Acta Biomed.91(1), Mattioli 1885, 157–160 (2020). 10.23750/abm.v91i1.9397. - PMC - PubMed
    1. COVID-19 Map - Johns Hopkins Coronavirus Resource Center. https://coronavirus.jhu.edu/map.html. Accessed Jun. 04, 2021.
    1. Lapostolle F, et al. Clinical features of 1487 COVID-19 patients with outpatient management in the Greater Paris: The COVID-call study. Intern. Emerg. Med. 2020;15(5):813–817. doi: 10.1007/s11739-020-02379-z. - DOI - PMC - PubMed
    1. Huang C, et al. Clinical features of patients infected with 2019 novel coronavirus in Wuhan, China. The Lancet. 2020;395(10223):497–506. doi: 10.1016/S0140-6736(20)30183-5. - DOI - PMC - PubMed
    1. Mathies D, et al. A case of SARS-CoV-2 pneumonia with successful antiviral therapy in a 77-year-old man with a heart transplant. Am. J. Transplant. 2020;20(7):1925–1929. doi: 10.1111/ajt.15932. - DOI - PMC - PubMed

Publication types