. 2022 Nov;92(5):1341-1349.
doi: 10.1038/s41390-022-01985-1. Epub 2022 Feb 16.

Propofol toxicity in the developing mouse heart mitochondria

Affiliations

Propofol toxicity in the developing mouse heart mitochondria

Matthew B Barajas et al. Pediatr Res. 2022 Nov.

Abstract

Background: Propofol infusion syndrome (PRIS) is a potentially lethal consequence of long-term propofol administration. Children are vulnerable and cardiac involvement is often prominent and associated with mortality. We aimed to determine the mechanism of propofol toxicity in newborn mice, hypothesizing that propofol would induce discrete defects within immature cardiac mitochondria.

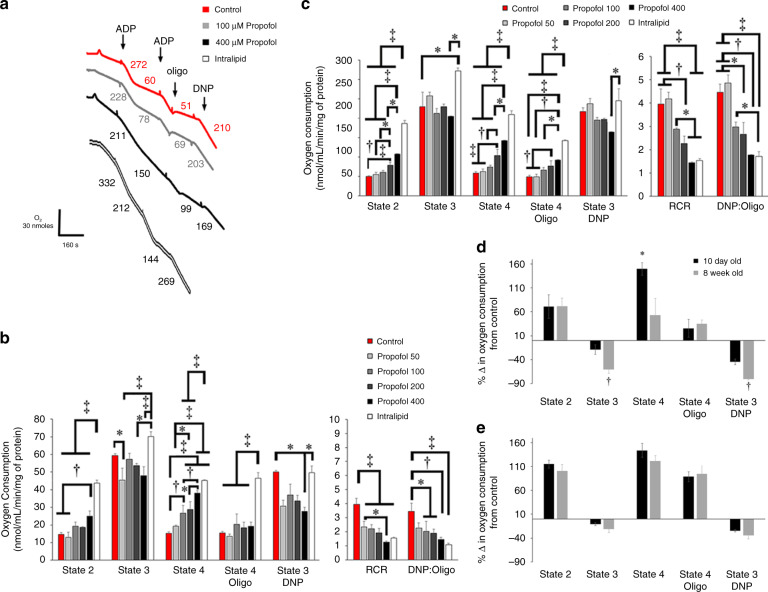
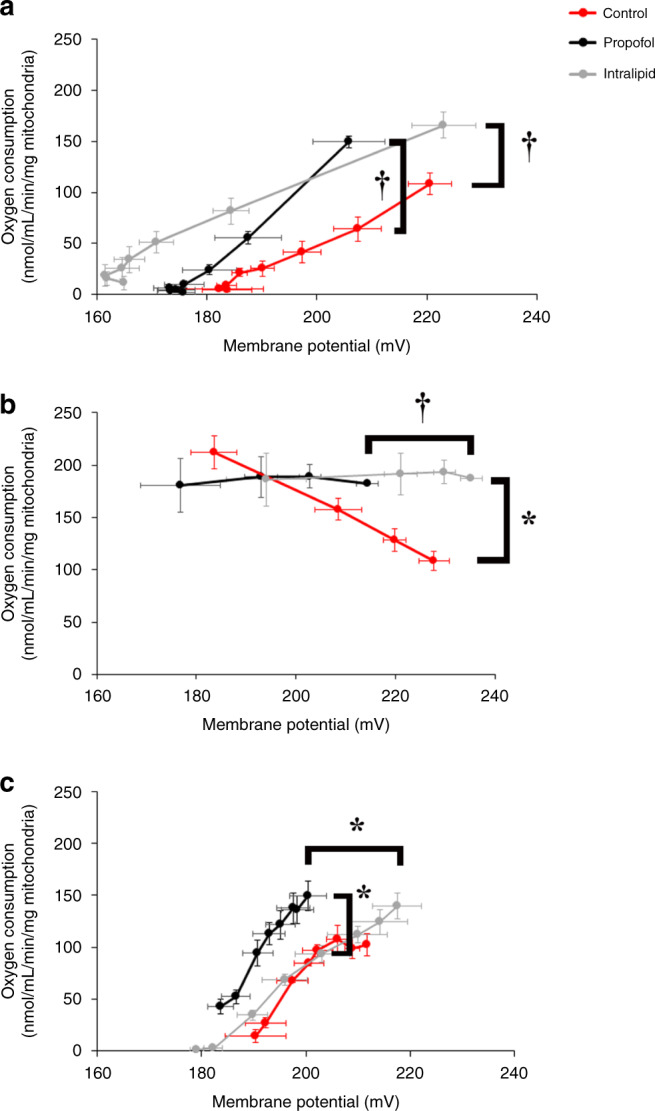
Methods: Newborn murine cardiac mitochondria were exposed to propofol or intralipid in vitro. Non-exposed mitochondria served as controls. Mitochondrial respiration and membrane potential (ΔΨ) were measured and respiratory chain complex kinetics were determined.

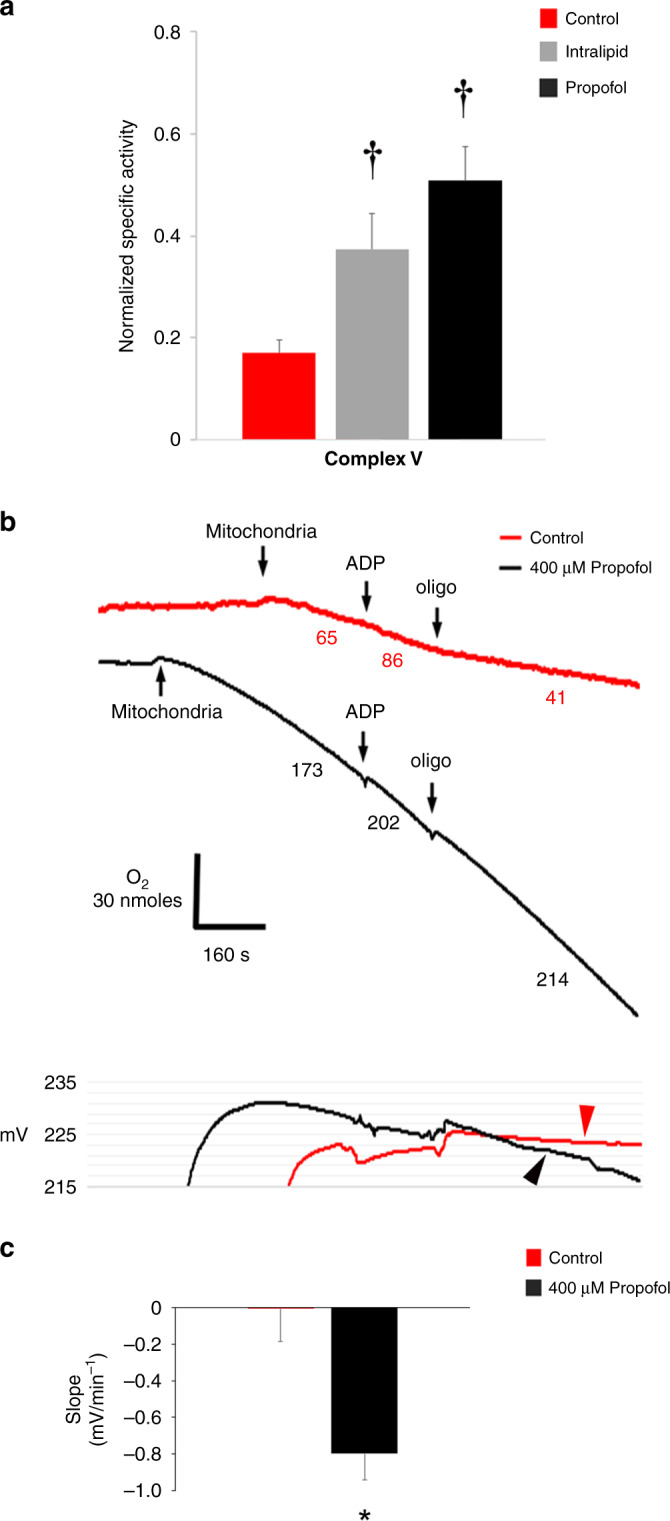
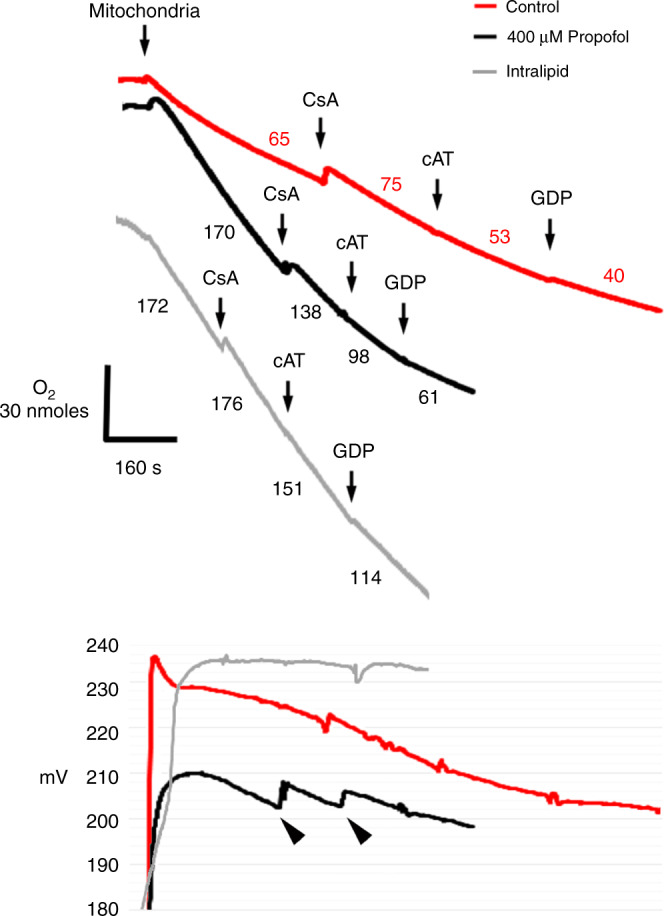
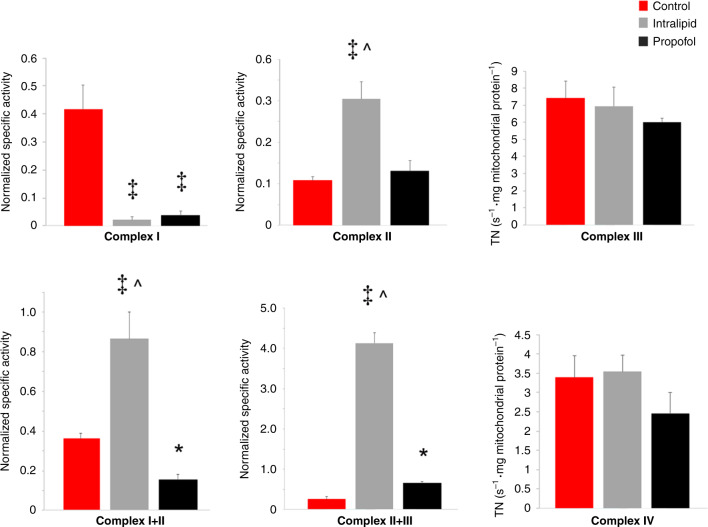
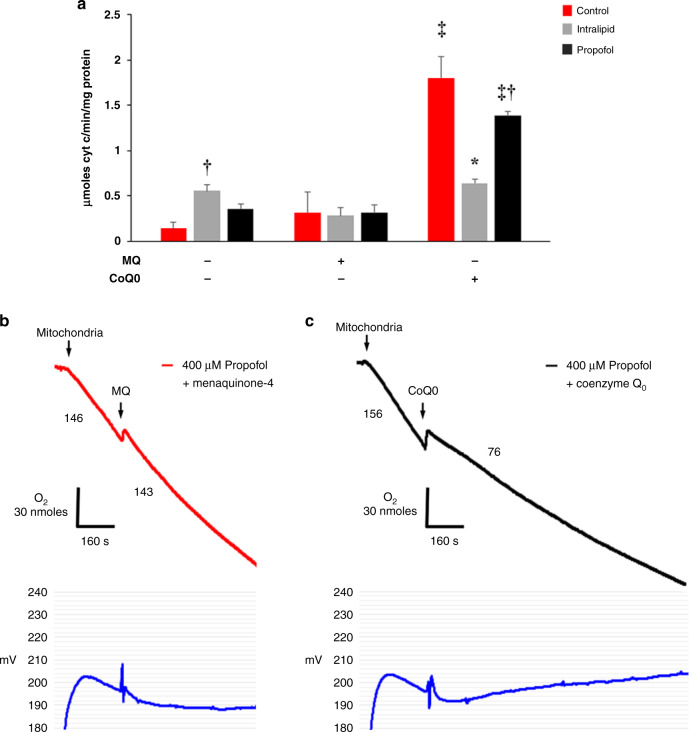
Results: Propofol and intralipid exerted biological activity in isolated mitochondria. Although intralipid effects were a potential confounder, we found that propofol induced a dose-dependent increase in proton leak and caused a defect in substrate oxidation at coenzyme Q (CoQ). These impairments prevented propofol-exposed cardiomyocyte mitochondria from generating an adequate ΔΨ. The addition of the quinone analog, CoQ0, blocked propofol-induced leak and increased Complex II+III activity.

Conclusions: Propofol uncoupled immature cardiomyocyte mitochondria by inducing excessive CoQ-sensitive leak and interfered with electron transport at CoQ. The findings provide new insight into the mechanisms of propofol toxicity in the developing heart and may help explain why children are vulnerable to developing PRIS.

Impact: Propofol uncouples immature cardiomyocyte mitochondria by inducing excessive coenzyme Q (CoQ)-sensitive proton leak. Propofol also interferes with electron transport at the level of CoQ. These defects provide new insight into propofol toxicity in the developing heart.


Conflict of interest statement

The authors declare no competing interests.

Figures

Fig. 1
Fig. 1. Oxygen consumption in isolated cardiomyocyte mitochondria.
a Representative tracings for Complex II-dependent oxygen consumption in non-exposed controls or mitochondria exposed to propofol or intralipid are depicted. Numbers following the addition of adenosine diphosphate (ADP), oligomycin (oligo), and dinitrophenol (DNP) indicate oxygen consumption rates (nmol/mL/min/mg mitochondrial protein). Graphical representations of b Complex I-dependent oxygen consumption using glutamate/malate and c Complex II-dependent oxygen consumption using succinate are shown (n = 3–5 per group). Rates of state 2 respiration, state 3 respiration (following the addition of ADP), state 4 respiration, uncoupled state 3 respiration (state 3 DNP), and oligomycin-induced state 4 (state 4 oligo) are indicated. Graphical depiction of respiratory control ratios (RCR) and DNP-to-oligomycin ratios (DNP:oligo) is also shown. Percent change from control values of d Complex I-dependent oxygen consumption using glutamate/malate and e Complex II-dependent oxygen consumption in 10-day-old and 8-week-old mitochondria exposed to the highest concentration of propofol is depicted. States of respiration are indicated. Values are expressed as means ± SD. p Values were calculated by one-way ANOVA for b, c. Student’s t test was calculated for d, e. *p < 0.05, p < 0.01, p < 0.001.
Fig. 2
Fig. 2. Modular kinetic analysis of isolated cardiomyocyte mitochondria.
Oxygen consumption rates using succinate were measured over a range of ΔΨs with and without propofol (400 µM) or intralipid. For proton leak (a), state 4 was induced with oligomycin and respiration was titrated with serial additions of malonate. For substrate oxidation (b), state 4 was induced with oligomycin and respiration was titrated with serial additions of dinitrophenol. For ATP turnover (c), state 3 respiration was induced using an ADP-regenerating system and titrated with serial additions of malonate. n = 3–5 per group. Values are expressed as means ± SEM. p values for oxygen consumption rate at the highest common ΔΨ were calculated by Student’s t test. p values were also determined for ΔΨ at the highest common oxygen consumption rate. *p < 0.05, p < 0.01.
Fig. 3
Fig. 3. Assessment for the reverse activity of the ATP synthase.
a Oligomycin-sensitive steady-state hydrolytic activity of Complex V was measured in non-exposed controls and in mitochondria exposed to propofol (400 µM) or intralipid. Values were normalized to citrate synthase activity and expressed as means ± SD (n = 4–5 per group). p values were calculated by one-way ANOVA. p < 0.01 vs. control. b Representative tracings of Complex II-dependent oxygen consumption using succinate are depicted above and tracings of simultaneously measured ΔΨ are shown below (from 3 biological replicates in each group). State 3 was initiated with ADP and state 4 was initiated with oligomycin (oligo). Numbers in the tracings above indicate oxygen consumption rates (nmol/mL/min/mg mitochondrial protein). Non-exposed controls demonstrated increased respiration and fall in ΔΨ following ADP and a decline in respiration along with increased ΔΨ following oligo. ΔΨ remained stable following oligo in controls (red arrowhead). In propofol-exposed mitochondria, ΔΨ persistently declined following oligo (black arrowhead), indicating reverse activity of the ATP synthase. c Slope of change in ΔΨ following the addition of oligo in b is depicted. Values are means ± SD (n = 3 per group). p values were calculated by Student’s t test. *p < 0.05 vs. control.
Fig. 4
Fig. 4. Sources of proton leak.
Oligomycin-induced state 4 was initiated using succinate. Representative tracings of oxygen consumption (above) with simultaneous ΔΨ measurement (below) are depicted (from 3 to 4 biological replicates in each group). Numbers indicate oxygen consumption rates (nmol/mL/min/mg mitochondrial protein). Cyclosporine A (CsA), carboxyatractyloside (cAT), and guanosine diphosphate (GDP) were added to specifically inhibit leak via the mitochondrial permeability transition pore (mPTP), the adenine nucleotide translocase (ANT), and uncoupling proteins (UCPs), respectively. Inhibition of leak was identified by a concomitant decrease in oxygen consumption with a rise or stabilization in ΔΨ. Arrowheads indicate persistent leak despite the obvious closure of a leak channel.
Fig. 5
Fig. 5. Cardiomyocyte electron transport chain enzyme complex kinetic activity.
Steady-state kinetic activities were determined in non-exposed controls and in mitochondria exposed to propofol (400 µM) or intralipid. The specific activities normalized to citrate synthase activity are depicted (n = 4–5 per group). Coenzyme Q-dependent respiration was assessed by measuring linked Complex I+III and Complex II+III kinetic activities. First-order rate constants were determined for Complexes III and IV and expressed as turnover number (TN). Values are expressed as means ± SD. p values were calculated by one-way ANOVA. *p < 0.05 vs. control, p < 0.001 vs. control, ^p < 0.001 vs. propofol-exposed group.
Fig. 6
Fig. 6. Effect of coenzyme Q0 on electron transfer and proton leak.
a Linked Complex II+III kinetic activity was measured in non-exposed controls and in mitochondria exposed to propofol (400 µM) or intralipid. Effect of CoQ0 was compared with the effects of menaquinone-4 (MQ) and no added quinone (n = 4–7 per group). Values are expressed as means ± SD. p values were calculated by one-way ANOVA. *p < 0.05 vs. intralipid-exposed MQ-added cohort, control, and propofol-exposed CoQ0-added cohorts, p < 0.01 vs. control within quinone treatment group, p < 0.001 vs. no added quinone, MQ within exposure cohort. b, c Oligomycin-induced state 4 respiration was initiated using succinate in the presence of propofol (400 µM). Representative tracings of oxygen consumption (above) with simultaneous ΔΨ measurement (below) are depicted (from 3 biological replicates in each group). Numbers indicate oxygen consumption rates (nmol/mL/min/mg mitochondrial protein). b MQ or c CoQ0 were added to assess for the effect on leak.

References

    1. Hemphill S, McMenamin L, Bellamy MC, Hopkins PM. Propofol infusion syndrome: structured literature review and analysis of published case reports. Br. J. Anaesth. 2019;122:448–459. doi: 10.1016/j.bja.2018.12.025. - DOI - PMC - PubMed
    1. Krajčová A, Waldauf P, Anděl M, Duška F. Propofol infusion syndrome: a structured review of experimental studies and 153 published case reports. Crit. Care. 2015;19:398. doi: 10.1186/s13054-015-1112-5. - DOI - PMC - PubMed
    1. Zorrilla-Vaca A, Arevalo JJ, Escandón-Vargas K, Soltanifar D, Mirski MA. Infectious disease risk associated with contaminated propofol anesthesia, 1989–2014. Emerg. Infect. Dis. 2016;22:981–992. doi: 10.3201/eid2206.150376. - DOI - PMC - PubMed
    1. Vanlander AV, et al. Possible pathogenic mechanism of propofol infusion syndrome involves coenzyme Q. Anesthesiology. 2015;122:343–352. doi: 10.1097/ALN.0000000000000484. - DOI - PubMed
    1. Parke TJ, et al. Metabolic acidosis and fatal myocardial failure after propofol infusion in children: five case reports. BMJ. 1992;305:613–616. doi: 10.1136/bmj.305.6854.613. - DOI - PMC - PubMed

Publication types