. 2022 Feb;29(2):130-142.
doi: 10.1038/s41594-022-00721-x. Epub 2022 Feb 16.

Panoramix SUMOylation on chromatin connects the piRNA pathway to the cellular heterochromatin machinery

Affiliations

Panoramix SUMOylation on chromatin connects the piRNA pathway to the cellular heterochromatin machinery

Veselin I Andreev et al. Nat Struct Mol Biol. 2022 Feb.

Abstract

Nuclear Argonaute proteins, guided by small RNAs, mediate sequence-specific heterochromatin formation. The molecular principles that link Argonaute-small RNA complexes to cellular heterochromatin effectors on binding to nascent target RNAs are poorly understood. Here, we explain the mechanism by which the PIWI-interacting RNA (piRNA) pathway connects to the heterochromatin machinery in Drosophila. We find that Panoramix, a corepressor required for piRNA-guided heterochromatin formation, is SUMOylated on chromatin in a Piwi-dependent manner. SUMOylation, together with an amphipathic LxxLL motif in Panoramix's intrinsically disordered repressor domain, are necessary and sufficient to recruit Small ovary (Sov), a multi-zinc-finger protein essential for general heterochromatin formation and viability. Structure-guided mutations that eliminate the Panoramix-Sov interaction or that prevent SUMOylation of Panoramix uncouple Sov from the piRNA pathway, resulting in viable but sterile flies in which Piwi-targeted transposons are derepressed. Thus, Piwi engages the heterochromatin machinery specifically at transposon loci by coupling recruitment of a corepressor to nascent transcripts with its SUMOylation.


Conflict of interest statement

DECLARATION OF INTERESTS

The authors declare no competing interests.

Figures

Fig. 1:
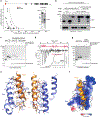
Fig. 1:. An amphipathic LxxLL motif in the Panx IDR binds Sov
a, Schematic representation of the GFP reporter assay in OSCs that allows for UAS - Gal4-DBD (DNA binding domain) mediated recruitment of proteins of interest upstream of the reporter transcription start site (TSS). qPCR amplicon for Fig. S1b is indicated. b, Boxplots showing GFP reporter levels in OSCs following transfection with plasmids encoding Gal4-DBD fusions of Panx or the indicated Panx fragments (numbers indicate median fold-change, normalized to median GFP fluorescence of cells transfected with Gal4-only expressing plasmid). c, Cartoon of the Panx primary sequence, indicating secondary structure elements (black, grey), protein disorder score (red) and occurrence of D, E, P (positive) and K, R (negative) residues (blue line and instances indicated at bottom). IDR (intrinsic disorder region), NCR (NLS containing region) and structured region are indicated. d, To the left, Panx IDR fragments tested in the transcriptional silencing reporter assay are shown. The protein sequence logo shown below illustrates the pattern of amino acid conservation in the 27 amino acid peptide surrounding the conserved LxxLL motif (logo based on a multiple sequence alignment of Panx orthologs of the ‘melanogaster’ subgroup; residues colored by chemical properties- hydrophobic in black, basic in blue, acidic in red, neutral in purple, and polar in green; arrow heads indicate hydrophobic residues of the amphipathic helix; wildtype and mutant sequence used throughout indicated below). To the right: As in panel B, with indicated Gal4-DBD fusions. e, As in panel B, with indicated Gal4-DBD fusions. f, Volcano plot showing fold enrichment of proteins determined by quantitative mass spectrometry in Panx LxxLL-peptide pulldown experiments versus Panx-LxxLL mutant peptide control (n = 3 biological replicates; p-values corrected for multiple testing. g, Volcano plot showing fold enrichment of proteins determined by quantitative mass spectrometry in GFP-FLAG-Panx co-immunoprecipitates versus control experiments (n = 4 biological replicates; p-values corrected for multiple testing).
Fig. 2:
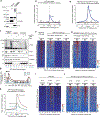
Fig. 2:. Sov is required for Piwi and Panx-mediated heterochromatin formation
a, Schematic representation of the GFP silencing reporter in flies, which allows for recruitment of λN-tagged proteins to the nascent transcript via boxB sites in the 3’ UTR. b, Confocal images of early oogenesis stages showing fluorescence levels (greyscale; scale bar: 20μm) of the ubiquitously expressed GFP reporter with λN-Panx expressed in all germline cells and additional germline-speciflc knockdown (GLKD) against white (control; left) or sov (right). c, Metaplot of H3K9me3 levels (in OSCs) at regions flanking piRNA-targeted transposon insertions (vertical line) following depletion of Sov as measured by Cut&Run (n = 381 transposon insertions). d, Volcano plot showing fold changes in steady state RNA levels of annotated transposon families in Sov-depleted OSCs compared to control (piRNA-repressed transposons marked in yellow; n = 3). e, Metaplot of Sov-GFP enrichment (in OSCs) at regions flanking piRNA-targeted transposon insertions (vertical line) determined by ChlP-seq (n = 381 transposon insertions). f, Boxplots showing GFP reporter (Fig. 1a) levels in OSCs following transfection with plasmids encoding a Gal4-DBD fusion of Sov (numbers indicate median fold-change, normalized to median GFP fluorescence of cells transfected with Gal4-DBD only expressing plasmid). g, H3K9me3 levels at the GFP reporter locus (amplicon indicated in Fig. 1a) after Sov tethering determined by ChlP-qPCR (n = 5 biological replicates; the gene desert ‘kalahari’ served as negative control). h, Heatmap showing the fold change of steady state RNA levels (determined by RNA-seq) of annotated Drosophila transposon families in OSCs after siRNA-mediated Sov, HP1, Panx or Piwi depletion (depletion shown by western blot experiments to the left).
Fig. 3:
Fig. 3:. Structural basis of the Panx-Sov interaction
a, Shown is the distribution (along the Sov primary sequence; annotated domain organization at the top) and relative level of Sov peptides identified by mass spectrometry from a Panx LxxLL peptide pulldown. The western blot inlay to the right indicates Sov protein integrity upon sonication of nuclear OSC lysate. b, Western blot analysis of immunoprecipitation experiments from S2 cells transiently expressing GFP-Sov (aa 1–118) as bait and wildtype or mutant Gal4-DBD_FLAG-tagged Panx LxxLL peptide (aa 82–108) as prey. c, Coomassie stained SDS-PAGE showing an in vitro pulldown experiment with streptavidin-bound wildtype or mutant Panx LxxLL peptide and recombinant GFP-tagged Sov NTD fragments as prey (asterisk indicates a background band from Streptavidin beads). d, Isothermal calorimetry measurement of the interaction affinity of the Sov NTD (aa 14–90; 30μM) with wildtype (black) or mutant (red) Panx LxxLL peptide (aa 82–108; N = 1.05 ± 0.03). e, Shown are ribbon models of the Sov NTD (aa 14–90; blue) - Panx LxxLL peptide (aa 82–108; gold) structure with interacting residues in bonds representation (K73 and K80 residues mutated in panel G are highlighted). f, Surface representation of the Sov NTD colored according to electrostatic surface potential (red, negative; white, neutral; blue, positive) bound to the Panx LxxLL peptide (gold) as ribbon model with sidechains shown in bonds representation. g, Coomassie stained SDS-PAGE showing an in vitro pulldown experiment with streptavidin-bound Panx LxxLL peptide and indicated recombinant proteins as prey (asterisk indicates a background band from Streptavidin beads).
Fig. 4:
Fig. 4:. Panx is SUMOylated
a, Hatching rates of eggs laid by females with indicated genotype mated to wildtype males (n = 5). b, Silver stained SDS-PAGE of a pulldown experiment (with denaturing wash steps) using GFP nanobodies and ovarian lysate from GFP-Smt3 expressing flies or control flies. c, Unique peptide counts of indicated proteins identified by mass spectrometry in the pulldown experiment shown in panel B. d, e, Western blot analysis of ovary lysates (panel D) or OSC lysate (panel E) probed with an α-Panx antibody (asterisk indicates an unspecific band; native Panx runs at ~100 kDa despite a molecular weight of 61 kDa). f, Western blots showing GFP-Trap immunoprecipitation experiments with lysates from wildtype (WT) OSCs or OSCs expressing endogenously GFP-FLAG-tagged Panx (Inp: input; IP: immuno-precipitate). The band at ~70 kDa in the α-FLAG western represents an N-terminal Panx degradation product. g, Western blots showing a pulldown experiment using indicated recombinant GFP-tagged Sov NTD variants as bait and nuclear OSC lysate as input.
Fig. 5:
Fig. 5:. A SUMOylation-dependent dual mode interaction between Panx and Sov
a, RT-qPCR analysis showing fold changes in steady state RNA levels of indicated transposons in OSCs transiently overexpressing GFP-tagged Sov NTD including or excluding the flanking SIMs (n = 3 biological replicates; error bars: Standard deviation). b, Boxplots of GFP intensity in OSCs expressing the transcriptional silencing reporter (Fig. 1a) following transfection with plasmids encoding Gal4-DBD fusions of the indicated Panx IDR variants (numbers indicate median fold-change of GFP intensity compared to empty Gal4 control). c, Schematic representation of the SUMOylation-dependent dual interaction between Panx IDR and Sov N-terminus (identity of used Panx and Sov mutants is indicated). d, Western blot showing levels and SUMOylation extent of endogenous Panx or GFP-tagged Panx rescue variants expressed in fly ovaries of indicated genotype (asterisk: unspecific band). e, Hatching rates of eggs laid by females with indicated panx genotype mated to wildtype males (n = 5; data from a common experiment with Fig. 4a). f, RT-qPCR analysis showing fold changes in steady state RNA levels of indicated transposon families in ovaries from flies of indicated genotype (n = 3 biological replicates; error bars: St. dev.). g, h, Hatching rates of eggs laid by females with indicated genotype mated to wildtype males (n = 3/4; error bars: St. dev.) i, RT-qPCR analysis showing fold changes in steady state RNA levels of indicated transposon families in ovaries from flies of indicated genotype (n = 3 biological replicates; error bars: St. dev.).
Fig. 6:
Fig. 6:. SUMOylation of Panx at chromatin depends on Piwi
a, Western blot analysis of soluble and insoluble (chromatin-enriched) fractions from OSCs. b, Meta profiles of GFP-Panx enrichment at genomic regions flanking piRNA-targeted transposon insertions (vertical line) in OSCs, determined by anti-GFP ChlP-seq using OSCs expressing endogenously GFP-FLAG-tagged Panx (n = 381 transposon insertions; wildtype cells served as control). c, Heatmap corresponding to the meta profile in panel B. Transposon insertions were ranked by H3K9me3 signal intensity in genomic regions flanking the insertions (left). d, As in panel B, but ChIP experiment used pre-extracted OSCs as input. e, Heatmap corresponding to meta profile in panel D. f, Western blot analysis of whole cell, soluble and insoluble (chromatin-enriched) fractions from OSCs depleted for indicated factors via siRNA transfections (numbers below indicate the quantified signal of unmodified (blue) or modified (red) Panx-isoforms; numbers for native versus SUMOylated isoforms were determined from different exposures and cannot be directly compared). g, Occupancy of Panx on the gypsy transposon, determined via ChlP-seq using pre-extracted OSCs depleted for indicated factors (wildtype cells served as control). h, Meta profile of GFP-Panx enrichment at genomic regions flanking piRNA-targeted transposon insertions (vertical line) in OSCs depleted for indicated factors, determined by anti-GFP ChlP-seq using pre-extracted OSCs expressing endogenously GFP-FLAG-tagged Panx (n = 381 transposon insertions; Ctrl, data from a common experiment with panel D). i, Heatmap showing GRO-seq signal at genomic regions flanking 381 piRNA-targeted transposon insertions (vertical line) in OSCs depleted for indicated factors. j, Heatmap corresponding to meta profile in panel H (transposon insertion coordinates ranked by GRO-Seq signal after Piwi depletion).
Fig. 7:
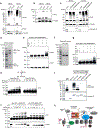
Fig. 7:. Direct SUMOylation of Panx by Ubc9 independent of Su(var)2–10
a, Western blot analysis showing depletion of Smt3 and the associated decrease in SUMOylated proteins as well as SUMOylated and native Panx in OSCs. b, Western blot analysis showing changes in SUMOylated and native Panx in OSCs depleted for Lwr/Ubc9. c, Western blot analysis showing the depletion of Su(var)2–10 and the associated changes in the level of SUMOylated Panx in OSCs. d, Coomassie-stained SDS-PAGE showing recombinant full length SFiNX complex composed of TwinStrep-MBP-Panx, His6-Ctp, Nxf2 and Nxtl). e, Western blot analysis of in vitro SUMOylation assay with full length SFiNX complex as substrate. f, Coomassie-stained SDS-PAGE of recombinant WT and 5XK mutant Panx IDR-3xHA-His1O. g, Western blot analysis of in vitro SUMOylation assay with WT Panx IDR as a substrate. h, Western blot analysis showing in vitro SUMOylation efficiencies (increasing concentration of Smt3) of WT and 5XK mutant Panx IDR. i, Western blot showing a pulldown experiment using indicated recombinant GFP-tagged Sov NTD variants as bait (see Ponceau S-stained membrane below) and in vitro SUMOylated Panx IDR as bait. j, Western blot analysis showing the enhancement of Panx IDR in vitro SUMOylation by the Sov NTD in a SIM-dependent manner. k, Schematic model summarizing the identity and regulation of the molecular interface between piRNA pathway (SFiNX) and general heterochromatin machinery (Sov).

References

    1. Fedoroff NV Presidential address. Transposable elements, epigenetics, and genome evolution. Science 338, 758–67 (2012). - PubMed
    1. Janssen A, Colmenares SU & Karpen GH Heterochromatin: Guardian of the Genome. Annu Rev Cell Dev Biol 34, 265–288 (2018). - PubMed
    1. Grewal SI & Moazed D Heterochromatin and epigenetic control of gene expression. Science 301,798–802(2003). - PubMed
    1. Allshire RC & Madhani HD Ten principles of heterochromatin formation and function. Nat Rev Mol Cell Biol 19, 229–244 (2018). - PMC - PubMed
    1. Yang P, Wang Y & Macfarlan TS The Role of KRAB-ZFPs in Transposable Element Repression and Mammalian Evolution. Trends Genet 33, 871–881 (2017). - PMC - PubMed

Publication types

MeSH terms