

Evaluating the Prognostic Accuracy of Biomarkers for Glioblastoma Multiforme Using The Cancer Genome Atlas Data
- PMID: 35173406
- PMCID: PMC8842453
- DOI: 10.1177/1176935117734844
Evaluating the Prognostic Accuracy of Biomarkers for Glioblastoma Multiforme Using The Cancer Genome Atlas Data
Abstract
Background: Glioblastoma multiforme (GBM) is the most common and aggressive primary brain tumor. Previous studies on GBM biomarkers focused on the effect of the biomarkers on overall survival (OS). Until now, no study has been published that evaluates the performance of biomarkers for prognosing OS. We examined the performance of microRNAs, gene expressions, gene signatures, and methylation that were previously identified to be prognostic. In addition, we investigated whether using clinical risk factors in combination with biomarkers can improve the prognostic performance.
Methods: The Cancer Genome Atlas, which provides both biomarkers and OS information, was used in this study. The time-dependent receiver operating characteristic (ROC) curve was used to evaluate the prognostic accuracy.
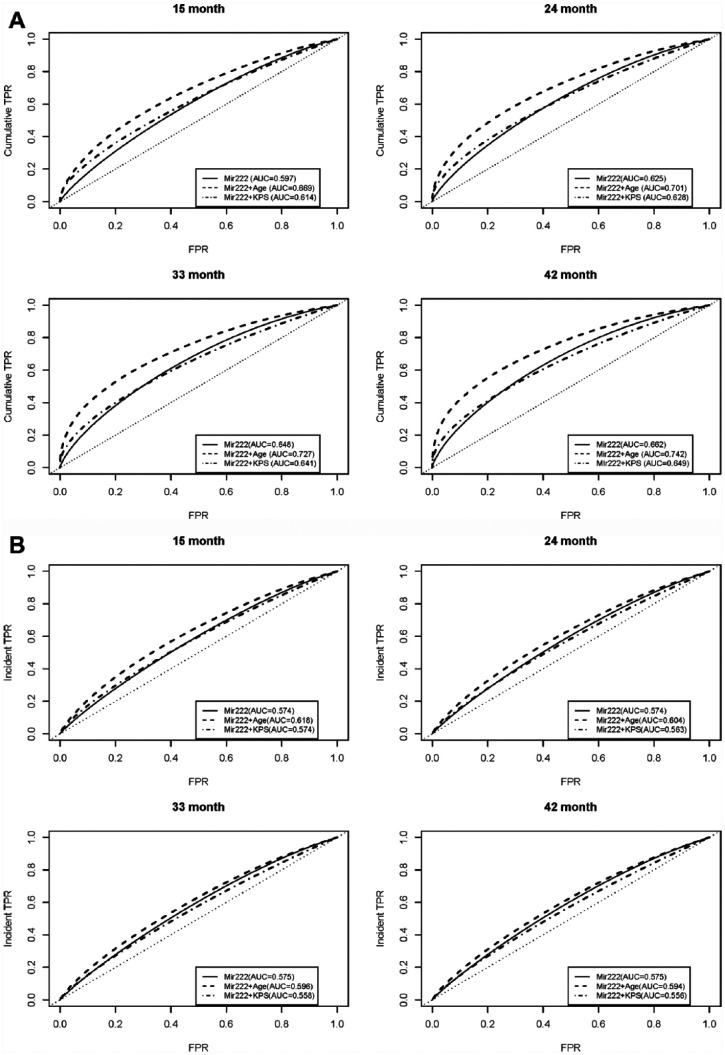
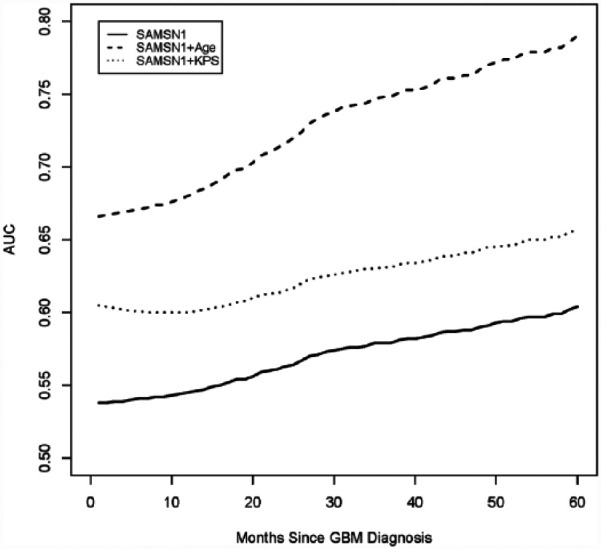
Results: For prognosis of OS by 2 years from diagnosis, the area under the ROC curve (AUC) of microRNAs, Mir21 and Mir222, was 0.550 and 0.625, respectively. When age was included in the risk prediction score of these biomarkers, the AUC increased to 0.719 and 0.701, respectively. The SAMSN1 gene expression attains an AUC of 0.563, and the "8-gene" signature identified by Bao achieves an AUC of 0.613.
Conclusions: Although some biomarkers are significantly associated with OS, the ability of these biomarkers for prognosing OS events is limited. Incorporating clinical risk factors, such as age, can greatly improve the prognostic performance.
Keywords: MGMT methylation; Prognostic accuracy; The Cancer Genome Atlas; gene signature; glioblastoma; microRNA; survival analysis.
© The Author(s) 2017.
Conflict of interest statement
Declaration of conflicting interests: The author(s) declared no potential conflicts of interest with respect to the research, authorship, and/or publication of this article.
Figures


Similar articles
-
MicroRNA signatures predict prognosis of patients with glioblastoma multiforme through the Cancer Genome Atlas.Oncotarget. 2017 Apr 6;8(35):58386-58393. doi: 10.18632/oncotarget.16878. eCollection 2017 Aug 29. Oncotarget. 2017. PMID: 28938564 Free PMC article.
-
MicroRNA-target cross-talks: Key players in glioblastoma multiforme.Tumour Biol. 2017 Nov;39(11):1010428317726842. doi: 10.1177/1010428317726842. Tumour Biol. 2017. PMID: 29110584
-
A Novel Six-mRNA Signature Predicts Survival of Patients With Glioblastoma Multiforme.Front Genet. 2021 Mar 11;12:634116. doi: 10.3389/fgene.2021.634116. eCollection 2021. Front Genet. 2021. PMID: 33790946 Free PMC article.
-
A five-miRNA signature with prognostic and predictive value for MGMT promoter-methylated glioblastoma patients.Oncotarget. 2015 Oct 6;6(30):29285-95. doi: 10.18632/oncotarget.4978. Oncotarget. 2015. PMID: 26320189 Free PMC article.
-
Genomic and Epigenomic Features of Glioblastoma Multiforme and its Biomarkers.J Oncol. 2022 Sep 21;2022:4022960. doi: 10.1155/2022/4022960. eCollection 2022. J Oncol. 2022. PMID: 36185622 Free PMC article. Review.
Cited by
-
Glioblastoma and Blood Microenvironment Predictive Model for Life Expectancy of Patients.Biomedicines. 2025 Apr 25;13(5):1040. doi: 10.3390/biomedicines13051040. Biomedicines. 2025. PMID: 40426873 Free PMC article.
References
-
- Farias-Eisner G, Bank AM, Hwang BY, et al. . Glioblastoma biomarkers from bench to bedside: advances and challenges. Br J Neurosurg. 2012;26:189–194. - PubMed
-
- Zweig MH, Campbell G. Receiver-operating characteristic (ROC) plots: a fundamental evaluation tool in clinical medicine. Clin Chem. 1993;39:561–577. - PubMed
-
- Zhou X-H, McClish DK, Obuchowski NA. Statistical Methods in Diagnostic Medicine. Vol 569. Hoboken, NJ: John Wiley & Sons; 2002.
-
- Hu N, Zhou X. A review of time-dependent ROC curve for evaluating the prognosis capacity of biomarkers and semiparametric regression methods. Paper presented at: Proceeding of Joint Statistical Meeting; July 31-August 5, 2010; Vancouver, BC, Canada.
Publication types
LinkOut - more resources
Full Text Sources
Research Materials
