. 2022 Feb;478(2258):20210601.
doi: 10.1098/rspa.2021.0601. Epub 2022 Feb 9.

Exploring the role of crystal habit in the Ostwald rule of stages

Affiliations

Exploring the role of crystal habit in the Ostwald rule of stages

Eftychios Hadjittofis et al. Proc Math Phys Eng Sci. 2022 Feb.

Abstract

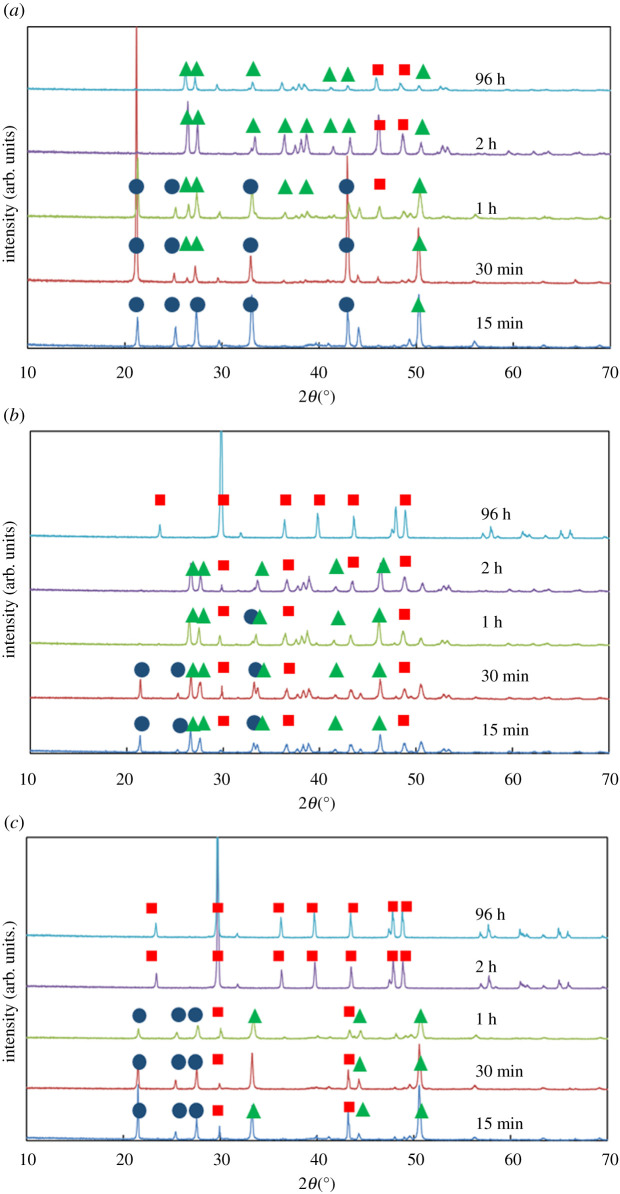
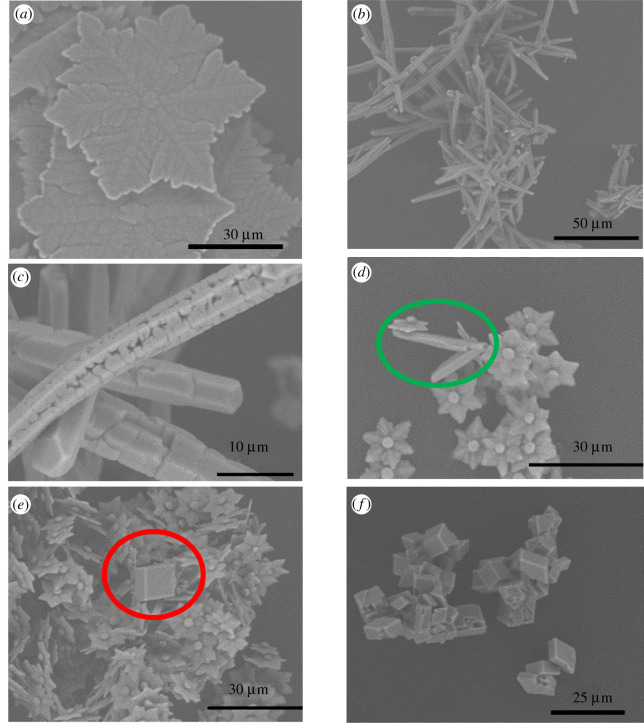
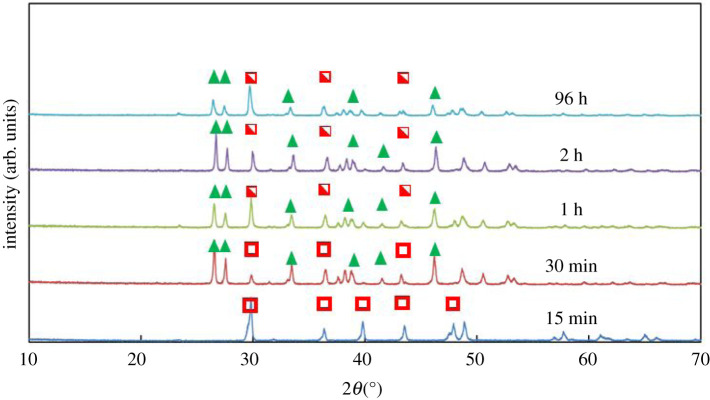
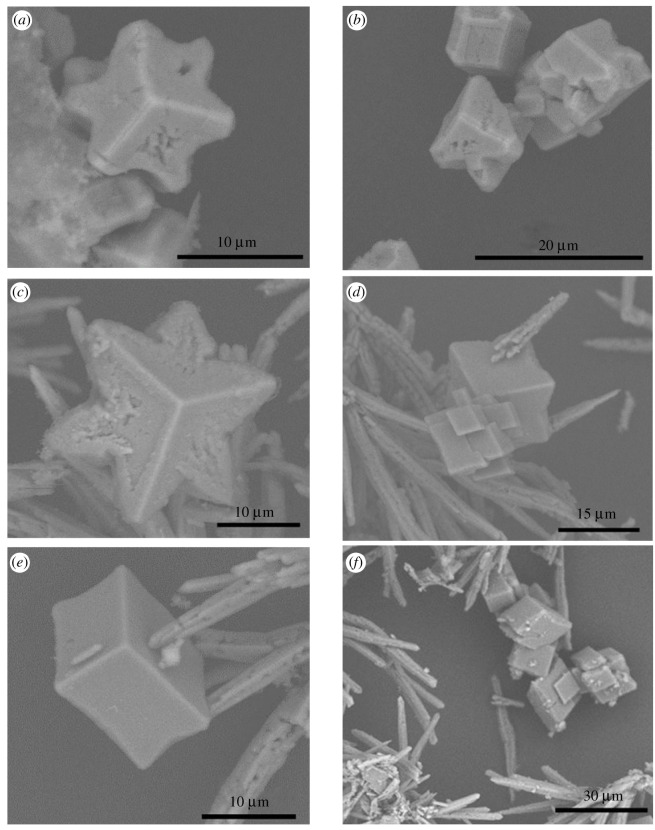
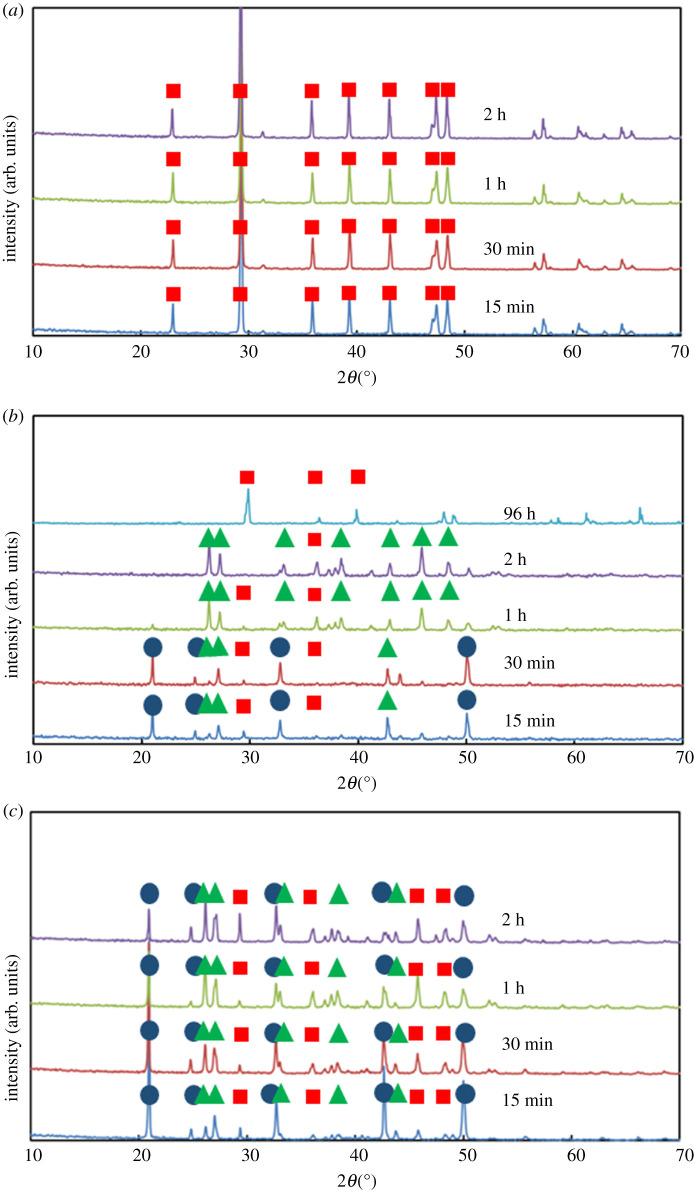
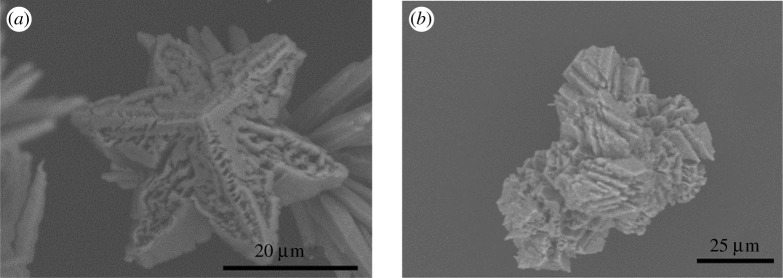
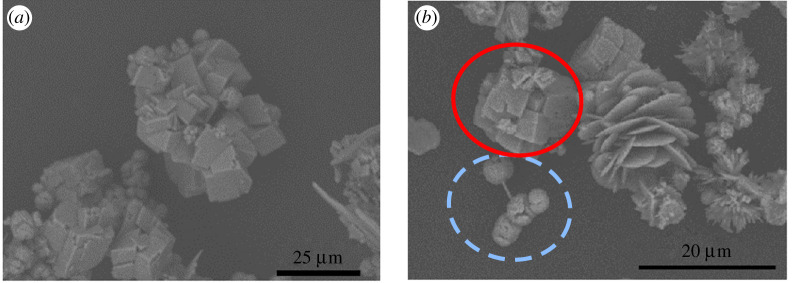
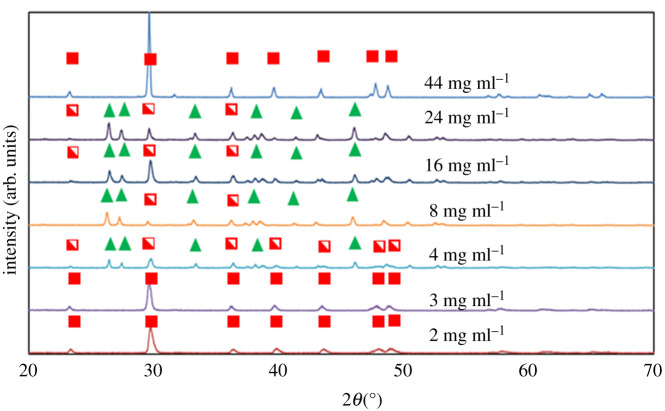
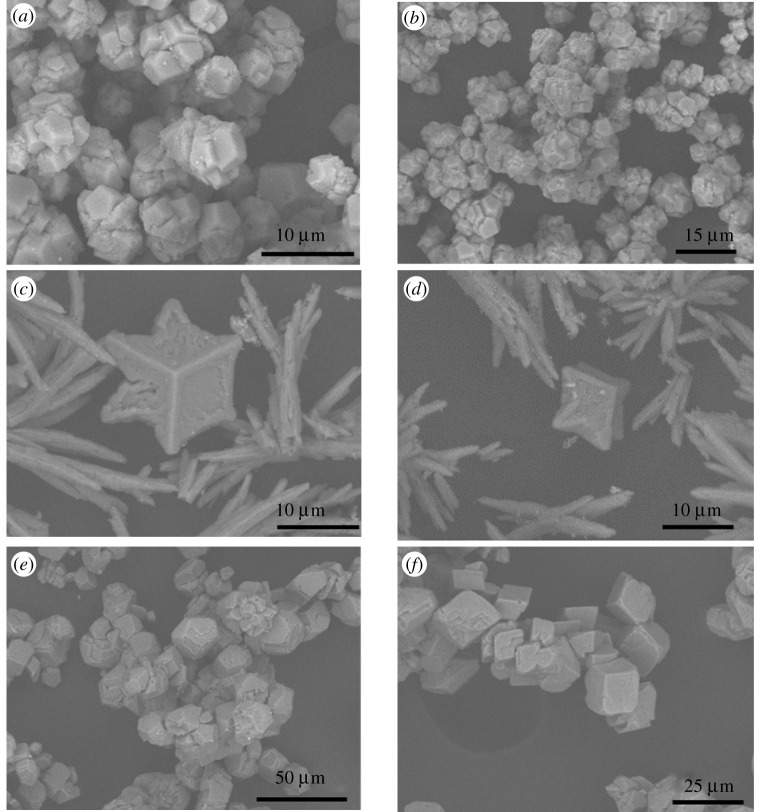
The crystallization of calcium carbonate is shown to be dictated by the Ostwald rule of stages (ORS), for high relative initial supersaturations ( S CaCO 3 = [ C a 2 + ] [ CO 3 2 - ] / K SP, Calcite > 2500 ), under sweet (carbon dioxide saturated) and anoxic (oxygen depleted) solution conditions. Rhombohedral calcite crystals emerge after the sequential crystallization and dissolution of the metastable polymorphs: vaterite (snowflake-shaped) and aragonite (needle-shaped). However, the presence of certain cations, which can form trigonal carbonates (e.g. Fe2+ and Ni2+), in concentrations as low as 1.5 mM, triggers the emergence of calcite crystals, with a star-shaped crystal habit, first. These star-shaped crystals dissolve to yield needle-shaped aragonite crystals, which in turn dissolve to give the rhombohedral calcite crystals. The star-shaped crystals, formed at high SCaCO3 , possess higher surface free energy (therefore higher apparent solubility) than their rhombohedral counterparts. This sequence of dissolution and recrystallization demonstrates that the ORS does not only drive the crystal towards its thermodynamically most stable polymorph but also towards its most stable crystal habit.

Keywords: Ostwald rule of stages; calcium carbonate; crystal habit; polymorphism; surface energy.


Figures

Figure 1.
Figure 1.
The XRPD patterns for the powder obtained from the crystallization of calcium carbonate at different durations (shown in the legend) at different concentrations of calcium chloride: (a) 2 mg ml−1, (b) 8 mg ml−1, (c) 24 mg ml−1. Blue circles indicate the characteristic peaks of vaterite, green triangles the characteristic peaks of aragonite and red squares the characteristic peaks of calcite. (Online version in colour.)
Figure 2.
Figure 2.
SEM images obtained from crystallization experiments conducted at: (a) a calcium chloride concentration of 2 mg ml−1 for 15 min, (b,c) a calcium chloride concentration of 2 mg ml−1 for 96 h, (d,e) a calcium chloride concentration of 8 mg ml−1 after 1 h (the green circle indicates needle-shaped aragonite crystals and the red circle indicates a rhombohedral calcite crystal) and (f) a calcium chloride concentration of 8 mg ml−1 after 96 h. (Online version in colour.)
Figure 3.
Figure 3.
XRPD patterns obtained from crystallization experiments at a calcium chloride concentration of 8 mg ml−1, in the presence of 1.5 mM of Fe2+, at different times. The green triangles indicate the characteristic peaks of aragonite, the open red squares demarcate the characteristic peaks of calcite for the cases where the SEM images suggest the presence of star-shaped calcite crystals and the half-filled red squares represent the peaks of calcite for the cases where SEM images suggest the coexistence of star-shaped and rhombohedral calcite crystals. (Online version in colour.)
Figure 4.
Figure 4.
SEM images of crystals obtained from crystallization experiments at (a,b) calcium chloride concentration of 8 mg ml−1, in the presence of 1.5 mM of Fe2+, after 15 min, (c) calcium chloride concentration of 8 mg ml−1, in the presence of 1.5 mM of Fe2+, after 1 h, and (df) calcium chloride concentration of 24 mg ml−1, in the presence of 1.5 mM of Fe2+, after 48 h. (Online version in colour.)
Figure 5.
Figure 5.
The XRPD patterns for the powder obtained from the crystallization of calcium carbonate at different durations (shown in the legend) at 8 mg ml−1 of calcium chloride in the presence of 1.5 mM of: (a) Ba2+, (b) Fe3+, (c) Li+. Blue circles indicate the characteristic peaks of vaterite, green triangles the characteristic peaks of aragonite and red squares the characteristic peaks of calcite. (Online version in colour.)
Figure 6.
Figure 6.
SEM images of crystals obtained from crystallization experiments with calcium chloride concentration of 8 mg ml−1, in the presence of 1.5 mM of Ni2+, after (a) 15 min and (b) 30 min.
Figure 7.
Figure 7.
SEM images of crystals obtained from crystallization experiments with calcium chloride concentration of 8 mg ml−1, in the presence of 1.5 mM of Zn2+, after (a) 15 min and (b) 1 h. The red circle indicates rhombohedral calcite crystals, while the dotted brown circle indicates spherulites of smithsonite (ZnCO3). (Online version in colour.)
Figure 8.
Figure 8.
XRPD patterns obtained from crystallization experiments conducted using the concentrations of calcium chloride shown in the legend, in the presence of 1.5 mM of Fe2+, for 48 h. Green triangles stand for the characteristic peaks of aragonite. Filled red squares stand for the characteristic peaks of calcite, in cases where SEM images suggest the existence of rhombohedral calcite crystals only. The half-filled red squares represent the peaks of calcite for the cases where SEM images suggest the coexistence of star-shaped crystals with rhombohedral crystals. (Online version in colour.)
Figure 9.
Figure 9.
SEM images of crystals obtained from crystallization experiments with: (a,b) 2 mg ml−1 of calcium chloride, in the presence of 1.5 mM of Fe2+, after 48 h, (c,d) 16 mg ml−1 of calcium chloride, in the presence of 1.5 mM of Fe2+, after 48 h and (e,f) 44 mg ml−1 of calcium chloride, in the presence of 1.5 mM of Fe2+, after 48 h.

References

    1. Ostwald W. 1897. Studien über die Bildung und Umwandlung fester Körper. Z. Phys. Chem. 22U, 289-330. (10.1515/zpch-1897-2233) - DOI
    1. Threlfall T. 2003. Structural and thermodynamic explanations of Ostwald's Rule. Org. Process Res. Dev. 7, 1017-1027. (10.1021/op030026l) - DOI
    1. Vrcelj RM, Gallagher HG, Sherwood JN. 2001. Polymorphism in 2,4,6-trinitrotoluene crystallized from solution. J. Am. Chem. Soc. 123, 2291-2295. (10.1021/ja0031422) - DOI - PubMed
    1. Hammond RB, Pencheva K, Roberts KJ. 2005. Simulation of energetic stability of facetted L-glutamic acid nanocrystalline clusters in relation to their polymorphic phase stability as a function of crystal size. J. Phys. Chem. B 109, 19 550-19 552. (10.1021/jp053546m) - DOI - PubMed
    1. Bhattachar SN, Deschenes LA, Wesley JA. 2006. Solubility: it's not just for physical chemists. Drug Discov. Today 11, 1012-1018. (10.1016/j.drudis.2006.09.002) - DOI - PubMed

LinkOut - more resources