

Brain-Predicted Age Difference Moderates the Association Between Muscle Strength and Mobility
- PMID: 35173606
- PMCID: PMC8841783
- DOI: 10.3389/fnagi.2022.808022
Brain-Predicted Age Difference Moderates the Association Between Muscle Strength and Mobility
Abstract
Background: Approximately 35% of individuals over age 70 report difficulty with mobility. Muscle weakness has been demonstrated to be one contributor to mobility limitations in older adults. The purpose of this study was to examine the moderating effect of brain-predicted age difference (an index of biological brain age/health derived from structural neuroimaging) on the relationship between leg strength and mobility.
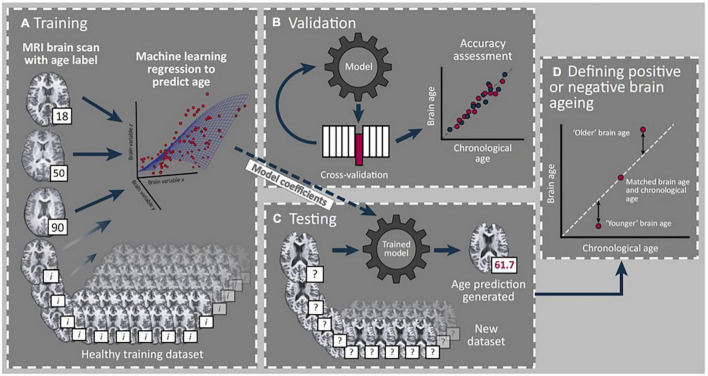
Methods: In community dwelling older adults (N = 57, 74.7 ± 6.93 years; 68% women), we assessed the relationship between isokinetic leg extensor strength and a composite measure of mobility [mobility battery assessment (MBA)] using partial Pearson correlations and multifactorial regression modeling. Brain predicted age (BPA) was calculated from T1 MR-images using a validated machine learning Gaussian Process regression model to explore the moderating effect of BPA difference (BPAD; BPA minus chronological age).
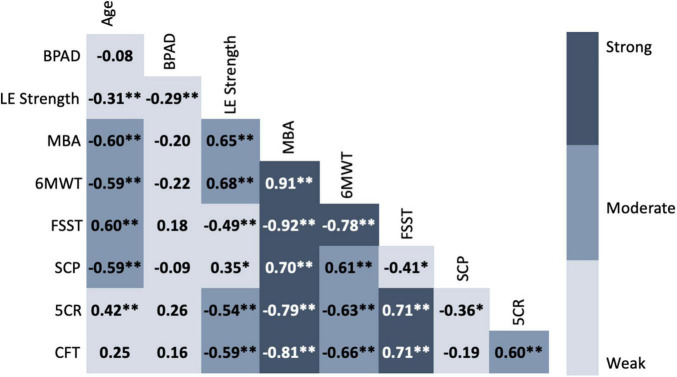
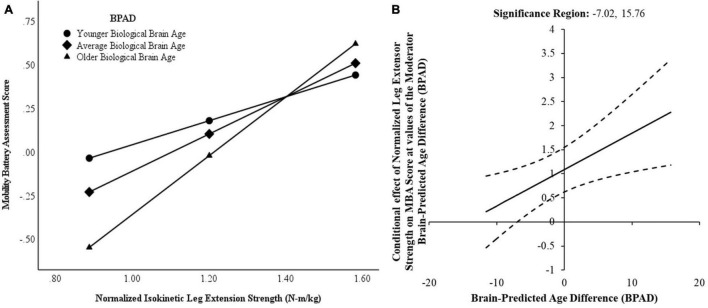
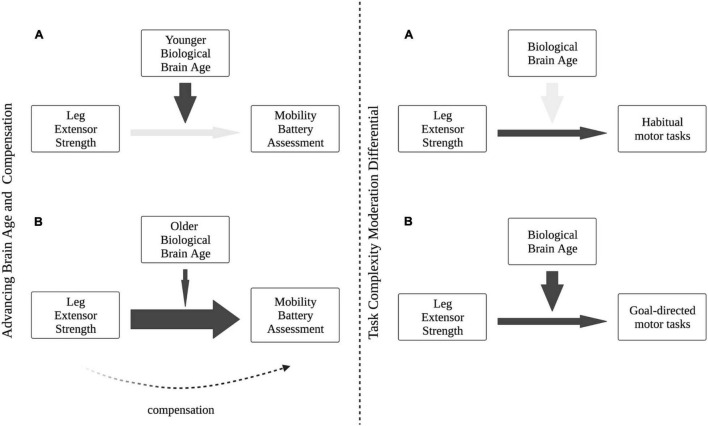
Results: Leg strength was significantly correlated with BPAD (r = -0.317, p < 0.05) and MBA score (r = 0.541, p < 0.001). Chronological age, sex, leg strength, and BPAD explained 63% of the variance in MBA performance (p < 0.001). BPAD was a significant moderator of the relationship between strength and MBA, accounting for 7.0% of MBA score variance [△R 2 = 0.044, F(1,51) = 6.83, p = 0.01]. Conditional moderation effects of BPAD indicate strength was a stronger predictor of mobility in those with a great BPAD.
Conclusion: The relationship between strength and mobility appears to be influenced by brain aging, with strength serving as a possible compensation for decline in neural integrity.
Keywords: brain aging; dynapenia; physical function; sarcopenia; weakness.
Copyright © 2022 Vaughan, Simon, Grooms, Clark, Wages and Clark.
Conflict of interest statement
In the past 5-years, BC has received research funding from NMD Pharma, Regeneron Pharmaceuticals, Astellas Pharma Global Development, Inc., and RTI Health Solutions for contracted studies that involved aging and neuromuscular related research. In the past 5-years, BC has received consulting fees from Regeneron Pharmaceuticals, Zev industries, and the Gerson Lehrman Group for consultation specific to age-related neuromuscular weakness. BC is a co-founder with equity of OsteoDx Inc. The remaining authors declare that the research was conducted in the absence of any commercial or financial relationships that could be construed as a potential conflict of interest.
Figures
Similar articles
-
Relative contribution of muscle strength, lean mass, and lower extremity motor function in explaining between-person variance in mobility in older adults.BMC Geriatr. 2020 Jul 28;20(1):255. doi: 10.1186/s12877-020-01656-y. BMC Geriatr. 2020. PMID: 32723298 Free PMC article.
-
Knee extensor power asymmetry is unrelated to functional mobility of older adults.Exp Gerontol. 2017 Nov;98:54-61. doi: 10.1016/j.exger.2017.08.008. Epub 2017 Aug 7. Exp Gerontol. 2017. PMID: 28797826 Free PMC article.
-
Comparison of a Multi-Component Physical Function Battery to Usual Walking Speed for Assessing Lower Extremity Function and Mobility Limitation in Older Adults.J Nutr Health Aging. 2020;24(8):906-913. doi: 10.1007/s12603-020-1432-2. J Nutr Health Aging. 2020. PMID: 33009544 Free PMC article.
-
Even mealtime distribution of protein intake is associated with greater muscle strength, but not with 3-y physical function decline, in free-living older adults: the Quebec longitudinal study on Nutrition as a Determinant of Successful Aging (NuAge study).Am J Clin Nutr. 2017 Jul;106(1):113-124. doi: 10.3945/ajcn.116.146555. Epub 2017 May 17. Am J Clin Nutr. 2017. PMID: 28515070
-
Reductions in Motor Unit Firing are Associated with Clinically Meaningful Leg Extensor Weakness in Older Adults.Calcif Tissue Int. 2024 Jan;114(1):9-23. doi: 10.1007/s00223-023-01123-x. Epub 2023 Aug 21. Calcif Tissue Int. 2024. PMID: 37603077 Free PMC article. Review.
Cited by
-
Neuroimaging-Based Brain Age Estimation: A Promising Personalized Biomarker in Neuropsychiatry.J Pers Med. 2022 Nov 5;12(11):1850. doi: 10.3390/jpm12111850. J Pers Med. 2022. PMID: 36579560 Free PMC article. Review.
-
Regenerative rehabilitation measures to restore tissue function after arsenic exposure.Curr Opin Biomed Eng. 2024 Jun;30:100529. doi: 10.1016/j.cobme.2024.100529. Epub 2024 Mar 11. Curr Opin Biomed Eng. 2024. PMID: 40191583 Free PMC article.
-
Association of body composition with neuroimaging biomarkers and cognitive function; a population-based study of 70-year-olds.EBioMedicine. 2025 Feb;112:105555. doi: 10.1016/j.ebiom.2024.105555. Epub 2025 Jan 8. EBioMedicine. 2025. PMID: 39788041 Free PMC article.
References
Grants and funding
LinkOut - more resources
Full Text Sources