

Validation of Controlled Attenuation Parameter Measured by FibroScan as a Novel Surrogate Marker for the Evaluation of Metabolic Derangement
- PMID: 35173677
- PMCID: PMC8841525
- DOI: 10.3389/fendo.2021.739875
Validation of Controlled Attenuation Parameter Measured by FibroScan as a Novel Surrogate Marker for the Evaluation of Metabolic Derangement
Abstract
Background/objectives: Renaming non-alcoholic fatty liver disease (NAFLD) to metabolic dysfunction-associated fatty liver disease (MAFLD) suggests a shift of emphasis to the accompanying metabolic disturbance. Controlled attenuation parameter (CAP) measured by FibroScan has been shown to be correlated with hepatic steatosis. We aim to validate its usefulness as a novel surrogate marker for evaluating metabolic derangement.
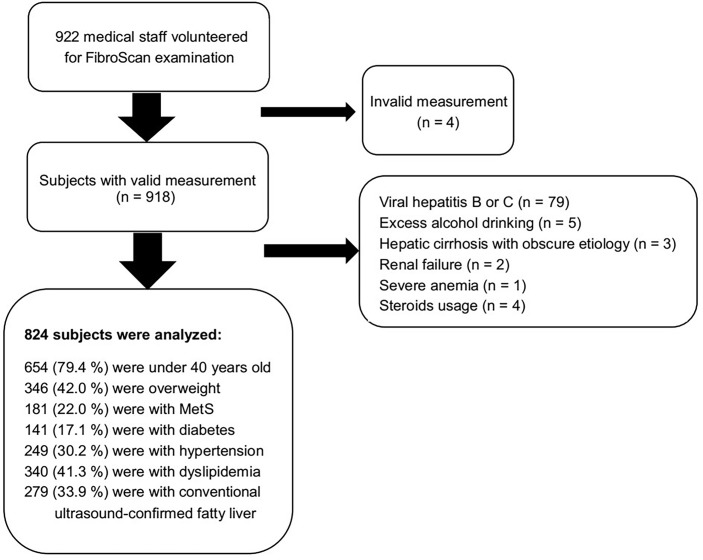
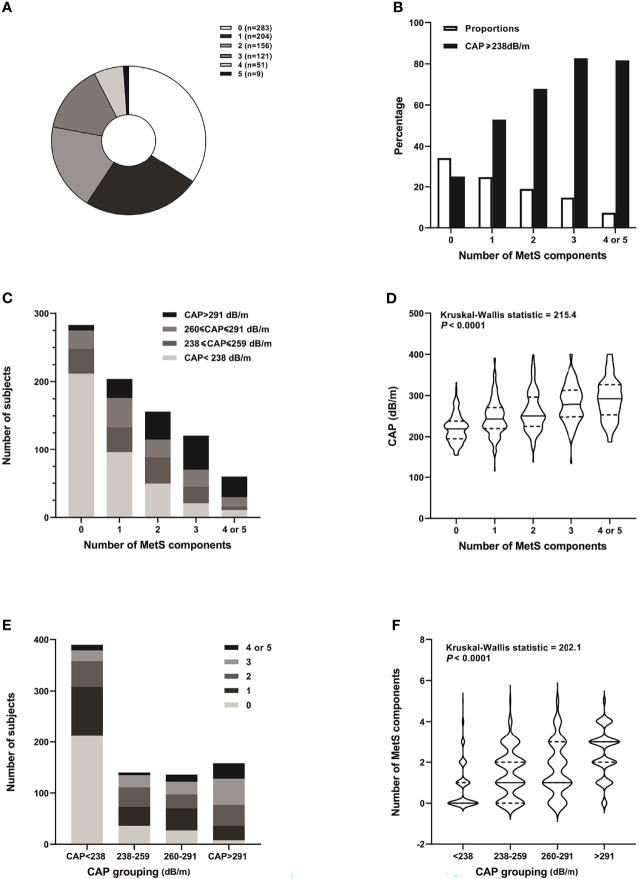
Subjects/methods: Volunteers were recruited from medical staff at our hospital to undergo CAP measurements. Anthropometrics, CAP, and laboratory assessments for metabolic profiles and insulin resistance were collected. CAP < 238 dB/m denoted no hepatic steatosis, 238 ≤ CAP ≤ 259 dB/m denoted mild, 260 ≤ CAP ≤ 291 dB/m denoted moderate, and CAP > 291 dB/m denoted severe hepatic steatosis according to previous reports.
Results: Data of 824 participants were included for analysis. The age was 53.2 ± 15.4 years, body mass index (BMI) was 23.6 ± 3.1 kg/m2, 24.4% were male subjects, and 22.0% met the criteria for metabolic syndrome (MetS). Taking the group with CAP < 238 dB/m as control, subjects with mild, moderate, and severe hepatic steatosis had increased odds of MetS by 3.51-, 3.32-, and 5.12-fold, respectively, after adjusting for multiple confounders (p = 0.020). Metabolic profiles, insulin resistance, and presence of MetS were similar between normal-weight subjects with CAP ≥ 238 dB/m and overweight subjects with CAP < 238 dB/m. Even in subjects with no MetS components, those with CAP ≥ 238 dB/m had higher BMI, waist circumferences, uric acid, triglyceride, white blood cell count, and insulin resistance, whereas lower adiponectin and estimated glomerular filtration rate. Waist circumference [OR 1.11 (1.04, 1.18), p = 0.001] and homeostatic model assessment of insulin resistance (HOMA-IR) [OR 2.39 (1.18, 4.83), p = 0.016] were predictive of hepatic steatosis according to CAP ≥ 238 dB/m.
Conclusions: CAP is a convenient, sensitive, and non-invasive indicator for metabolic derangement. Prospective studies are needed to further validate its usefulness as a surrogate marker for the transition of metabolic status over time.
Keywords: FibroScan; controlled attenuation parameter (CAP); diabetes mellitus; insulin resistance; metabolic syndrome (MetS); non-alcoholic fatty liver disease (NAFLD).
Copyright © 2022 Huang, Ng, Chen, Deng and Li.
Conflict of interest statement
The authors declare that the research was conducted in the absence of any commercial or financial relationships that could be construed as a potential conflict of interest.
Figures
References
-
- Sasso M, Beaugrand M, de Ledinghen V, Douvin C, Marcellin P, Poupon R, et al. Controlled Attenuation Parameter (CAP): A Novel VCTE™ Guided Ultrasonic Attenuation Measurement for the Evaluation of Hepatic Steatosis: Preliminary Study and Validation in a Cohort of Patients With Chronic Liver Disease From Various Causes. Ultrasound Med Biol (2010) 36:1825–35. doi: 10.1016/j.ultrasmedbio.2010.07.005 - DOI - PubMed
-
- Eddowes PJ, Sasso M, Allison M, Tsochatzis E, Anstee QM, Sheridan D, et al. Accuracy of FibroScan Controlled Attenuation Parameter and Liver Stiffness Measurement in Assessing Steatosis and Fibrosis in Patients With Nonalcoholic Fatty Liver Disease. Gastroenterology (2019) 156:1717–30. doi: 10.1053/j.gastro.2019.01.042 - DOI - PubMed
Publication types
MeSH terms
Substances
LinkOut - more resources
Full Text Sources
Medical
Miscellaneous