. 2022 Jan 31:12:805181.
doi: 10.3389/fmicb.2021.805181. eCollection 2021.

Investigation of the Importance of Protein 3D Structure for Assessing Conservation of Lysine Acetylation Sites in Protein Homologs

Affiliations

Investigation of the Importance of Protein 3D Structure for Assessing Conservation of Lysine Acetylation Sites in Protein Homologs

Kristen M Jew et al. Front Microbiol. .

Abstract

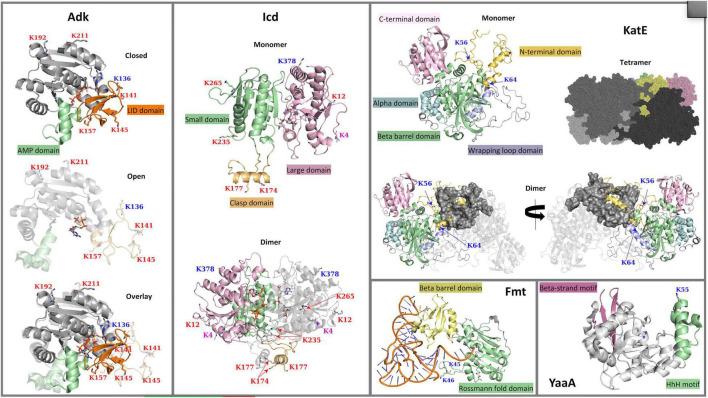
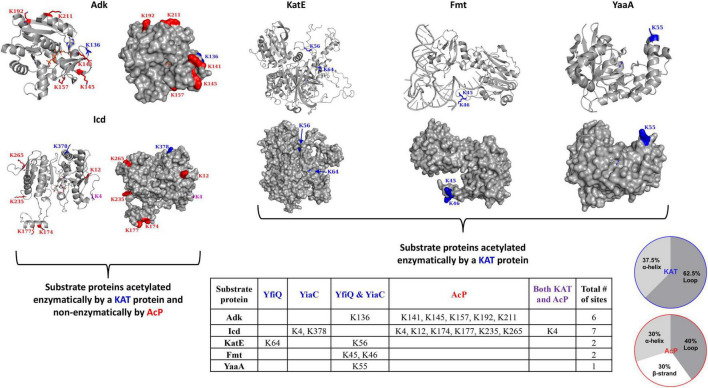
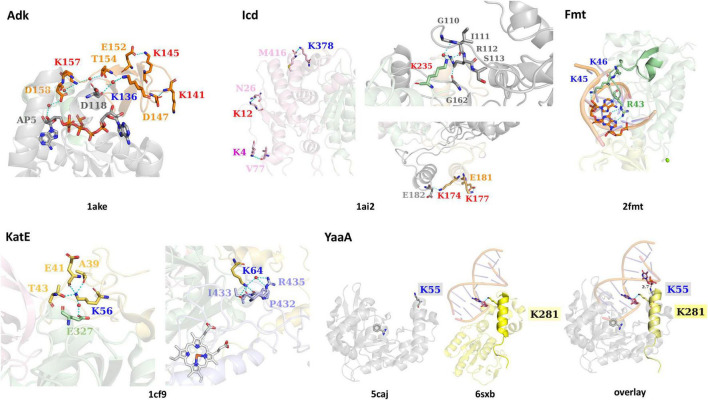
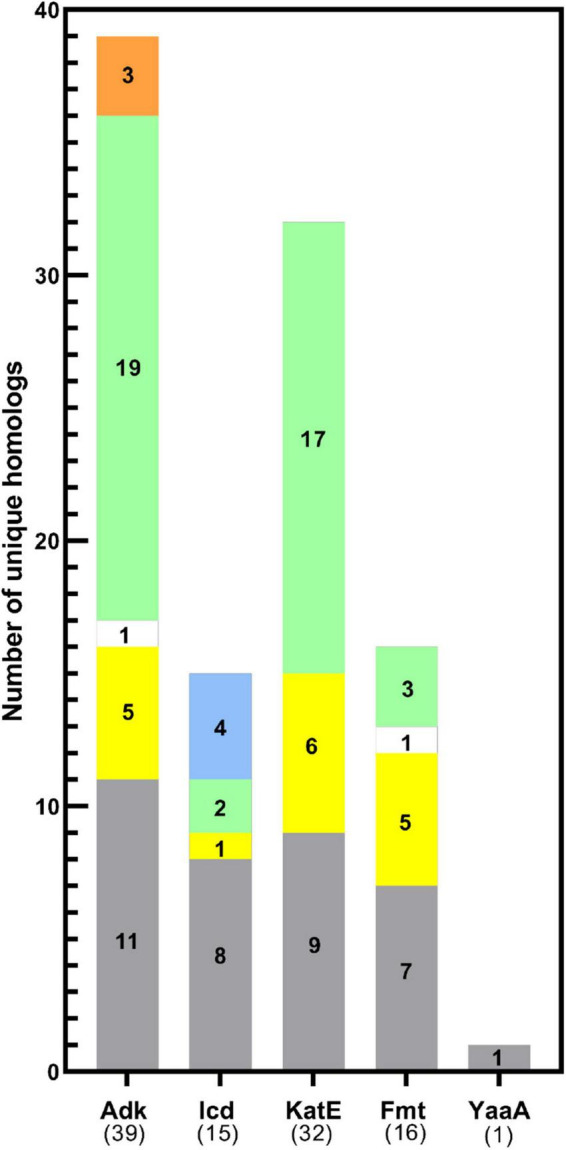
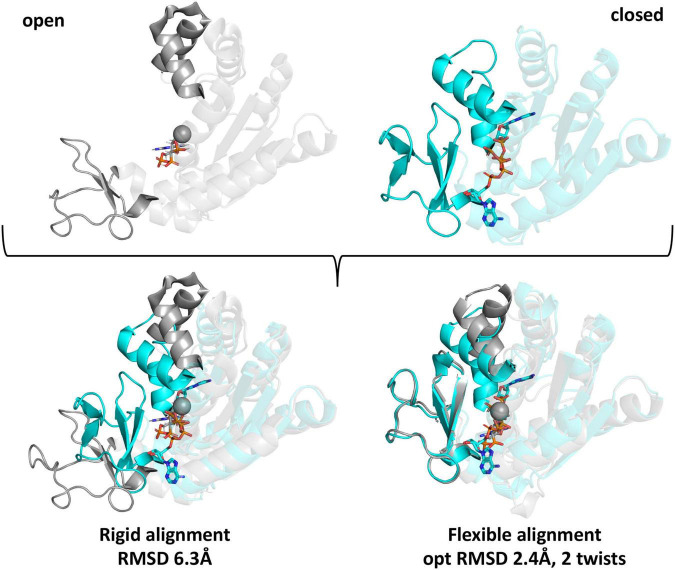
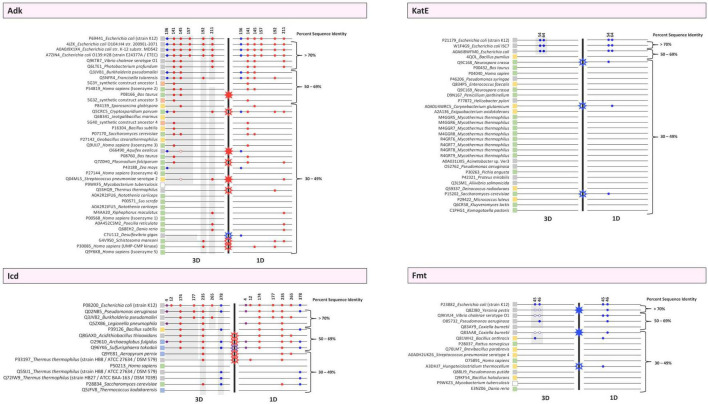
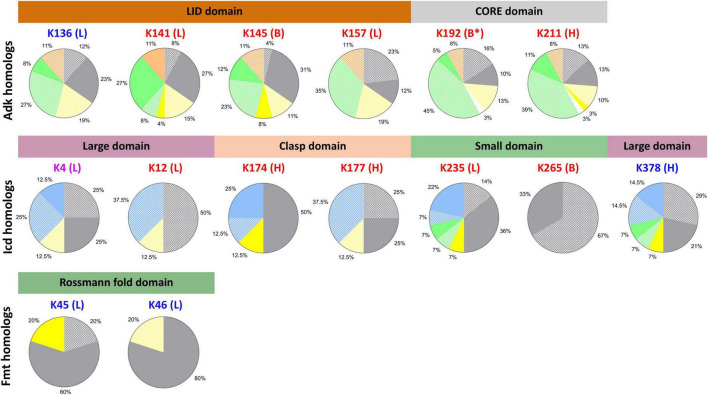
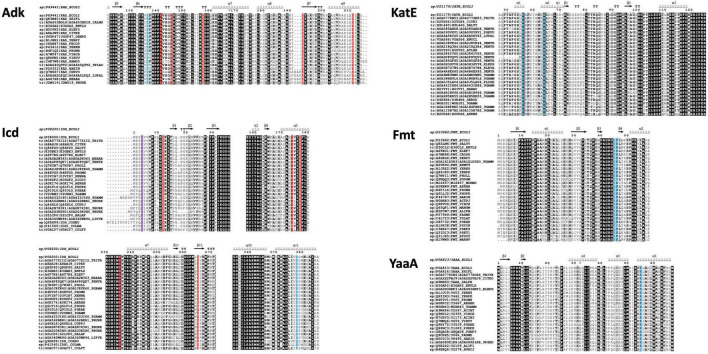
Acetylation is a protein post-translational modification (PTM) that can affect a variety of cellular processes. In bacteria, two PTM Nε-acetylation mechanisms have been identified: non-enzymatic/chemical acetylation via acetyl phosphate or acetyl coenzyme A and enzymatic acetylation via protein acetyltransferases. Prior studies have shown that extensive acetylation of Nε-lysine residues of numerous proteins from a variety of bacteria occurs via non-enzymatic acetylation. In Escherichia coli, new Nε-lysine acetyltransferases (KATs) that enzymatically acetylate other proteins have been identified, thus expanding the repertoire of protein substrates that are potentially regulated by acetylation. Therefore, we designed a study to leverage the wealth of structural data in the Protein Data Bank (PDB) to determine: (1) the 3D location of lysine residues on substrate proteins that are acetylated by E. coli KATs, and (2) investigate whether these residues are conserved on 3D structures of their homologs. Five E. coli KAT substrate proteins that were previously identified as being acetylated by YiaC and had 3D structures in the PDB were selected for further analysis: adenylate kinase (Adk), isocitrate dehydrogenase (Icd), catalase HPII (KatE), methionyl-tRNA formyltransferase (Fmt), and a peroxide stress resistance protein (YaaA). We methodically compared over 350 protein structures of these E. coli enzymes and their homologs; to accurately determine lysine residue conservation requires a strategy that incorporates both flexible structural alignments and visual inspection. Moreover, our results revealed discrepancies in conclusions about lysine residue conservation in homologs when examining linear amino acid sequences compared to 3D structures.

Keywords: Escherichia coli acetylation; Gcn5-related N-acetyltransferase (GNAT); N-epsilon lysine acetylation; conservation of protein acetylation sites; lysine acetylation; non-enzymatic acetylation; protein acetylation.


Conflict of interest statement

The authors declare that the research was conducted in the absence of any commercial or financial relationships that could be construed as a potential conflict of interest.

Figures

FIGURE 1
FIGURE 1
3D crystal structures of Escherichia coli K-12 lysine acetyltransferase (KAT) substrate proteins (Adk, Icd, KatE, Fmt, and YaaA). The crystal structures of Adk (PDB ID: 1ake and 6f7u) in complex with an AP5A inhibitor or phosphomethylphosphonic acid guanylate ester, respectively, Icd (PDB ID: 1ai2) in complex with NADP+, KatE (PDB ID: 1cf9) in complex with heme, Fmt (PDB ID: 2fmt) in complex with formyl-methionyl-tRNAfMet, and YaaA (PDB ID: 5caj) in complex with benzamidine are shown with ribbon representations. Ligands in each structure are shown with sticks. Lysine (K) acetylation sites are shown with sticks and their labels are colored based on type of acetylation that occurs: KAT sites are in blue, AcP sites are in red, and sites acetylated by both a KAT and AcP are in purple. (Adk) Two conformations of the Adk monomer are shown: the closed (PDB ID: 1ake) and open (PDB ID: 6f7u) conformations are at the top and middle of the panel, respectively; an overlay of the two conformations is shown at the bottom of the panel. The core domain is in gray, the AMP-binding domain is in green, and the ATP-binding LID domain is in orange. (Icd) A single monomer of the Icd structure is shown at the top of the panel with the small domain in light green, the large domain in pink and the clasp domain in orange. The dimeric form of the protein is shown at the bottom of the panel with one subunit colored by domains and the other subunit in gray. (KatE) The KatE protein exists as a tetramer, but a single monomer and dimer of the tetramer are shown to clarify domains and how the monomers of the tetramer intertwine. Each monomer is composed of the N-terminal arm domain in light orange, the C-terminal domain in pink, an alpha-helical domain in light blue, a beta-barrel domain in green, and a wrapping loop domain in violet. One monomer of the dimer is colored in gray, while the other monomer is colored by domains as described. Two views of the dimer are shown and are rotated by 180°. The tetramer is shown as a surface representation with each monomer colored in varying shades of gray, except for a single monomer that is colored by domains as in the single monomer view. (Fmt) A single monomer of the Fmt protein is shown with the Rossmann fold domain colored in green and the beta-barrel oligonucleotide binding fold domain in yellow; the formyl-methionyl-tRNAfMet is in orange and blue. (YaaA) The YaaA monomer is shown in gray ribbons with the beta-strand motif in pink and the helix-hairpin-helix (HhH) DNA-binding motif in green.
FIGURE 2
FIGURE 2
Escherichia coli K-12 lysine acetyltransferase (KAT) and acetyl phosphate (AcP) acetylation sites on substrate proteins Adk, Icd, KatE, Fmt, and YaaA. The table details sites of acetylation that occur via KATs (blue) YfiQ, YiaC, or both YfiQ and YiaC, AcP (red), or both KATs and AcP (purple). The crystal structures of the substrate proteins are in gray ribbons and the lysine residues that were previously identified as acetylated in E. coli K-12 are shown with sticks and colored by type of acetylation. AcP acetylation sites are in red, KAT acetylation sites are in blue, and both AcP and KAT acetylation sites are in purple. Monomers from the crystal structures are the same as those described in Figure 1 and Adk is shown in the closed conformation. The pie charts show the percentage of KAT and AcP sites on Adk, Icd, Fmt, KatE, and YaaA E. coli proteins that are located on alpha helices, beta strands, or loops.
FIGURE 3
FIGURE 3
The interactions of lysine residues identified as acetylated in E. coli K-12 KAT protein substrates Adk, Icd, KatE, Fmt, and YaaA. Structures of each substrate protein are colored by domains as in Figure 1 and PDB IDs are shown beneath each substrate protein structure. Residues surrounding KAT or AcP lysine sites of acetylation and interact via H-bonding are shown as sticks and colored by domain. Cyan dashes are used for H-bonding interactions and black dashes (in the YaaA structure) show distance measurements. Ligands are shown in sticks and water molecules are red spheres. Specific lysine residue labels are colored red for AcP acetylation sites, dark blue for KAT acetylation sites, and purple for both AcP and KAT acetylation site (in Icd). An overlay of the YaaA protein helix-hairpin-helix (HhH) domain compared to another DNA-binding protein with an HhH domain in complex with DNA (PDB ID: 6sxb) is also shown.
FIGURE 4
FIGURE 4
Distribution of KAT substrate protein homolog 3D structures across domains of life. The total number of homologs of each KAT substrate protein with unique UniProt IDs analyzed in this study are shown in parentheses on the x-axis. The target E. coli K-12 strain protein was also included in the total. Bars are colored by domain of life: Gram-negative (gray), Gram-positive (yellow), or Gram-variable (white) Bacteria, Eukaryotes (green), Archaea (blue), and synthetic constructs of ancestral proteins (orange).
FIGURE 5
FIGURE 5
Comparison of rigid and flexible structural alignments of open and closed forms of the E. coli Adk protein using Pymol and FATCAT. The open form of the Adk protein crystal structure is shown in gray (PDB ID: 6f7u chain A) and the closed form is cyan (PDB ID: 1ake chain A). Ligands are shown as sticks and spheres are metal ions from the crystal structures. Regions of the protein that adopt significantly variable conformations are in bold colors and the remainder of the protein is transparent. Structural alignments between the open and closed forms using rigid or flexible alignment methods and their corresponding RMSD-values between alpha carbon atoms are indicated beneath the aligned structures.
FIGURE 6
FIGURE 6
Conservation plots of selected lysine residues in both 3D structures and primary sequences of the target E. coli K-12 proteins (Adk, Icd, KatE, Fmt) and their homologs. Sequence and structural alignments between the target proteins and their homologs were analyzed to determine whether selected lysine residues were conserved in 1D and 3D. Alignments were performed using Cobalt and FATCAT and were then manually inspected. Each protein is indicated by its UniProt ID followed by the name of the organism. Strain or isozyme information is also included. PDB IDs were used when no UniProt ID existed for a given protein. Colored boxes adjacent to these labels correspond to whether they are Eukaryotes (green), Archaea (blue), Bacteria [Gram-negative (gray), Gram-positive (yellow), or Gram-variable (white)], or synthetic constructs (orange). Each protein is represented by a thin black line and organized based on percent sequence identity compared to the E. coli K-12 target protein. A thick black line separates the 3D and 1D conservation plots. Colored circles are used to indicate whether a lysine residue is conserved in both the target and homolog. The colors of the circles correspond to lysine acetyltransferase (KAT) acetylation sites (blue), AcP acetylation sites (red), or both KAT and AcP acetylation sites (purple). These sites were identified in previous studies with E. coli K-12 and are indicated by their residue number. The circles only indicate the presence of a lysine residue in 1D and 3D in homologs and not whether the residue has been identified as acetylated in the homolog in vivo. For Adk, open circles indicate a lysine residue was present during manual inspection of 3D structures but was not present in the FATCAT output. For Fmt, open circles mean that the residues were disordered in the structure but were present in the linear sequence for that region. Stars indicate a discrepancy between 3D and 1D lysine conservation within the same protein. Open stars represent a discrepancy in the 1D analysis, whereas filled stars represent a discrepancy in the 3D analysis. For example, if a residue is present in the 1D analysis but not the 3D analysis, an open star is shown. On the other hand, if a residue is present in the 3D analysis but not 1D analysis, a closed star is shown. The color of the stars corresponds to the type of acetylation site, i.e., KAT (blue), AcP (red), or both KAT and AcP (purple) that has the discrepancy. Gray highlighting on the 3D panels identifies proteins that contain similar structural domains as in the E. coli target proteins.
FIGURE 7
FIGURE 7
Residue conservation in KAT substrate protein homologs by domain of life based on presence of 3D structural domains. Each lysine residue previously identified as acetylated in E. coli K-12 by AcP and KATs on Adk, Icd, and Fmt proteins are shown above individual pie charts. The color of the lysine residue corresponds to the type of acetylation: AcP (red), KAT (blue), AcP and KAT (purple). The letters in parentheses indicate the type of secondary structure on which the residue was found in the E. coli substrate proteins: loop (L), alpha helix (H), beta strand (B). Stars indicate the lysine was located on the end of the type of secondary structure. The structural domains for each protein are shown with colored bars and are colored according to domains in Figure 1. Pie charts show the conservation of lysine residue by domain of life when structural domains of the protein homologs are taken into account. Protein homologs from Gram-negative, Gram-positive, and Gram-variable bacteria are colored gray, yellow, and white, respectively. Eukaryotes are green, Archaea are blue, and synthetic constructs are orange. Solid colors indicate the lysine residue was conserved and dot patterns indicate the lysine residue was not conserved. Only proteins that had the structural domain present were used to calculate lysine residue conservation.
FIGURE 8
FIGURE 8
Conservation of E. coli substrate protein (Adk, Icd, KatE, Fmt, and YaaA) acetylated lysine sites across homologs identified by sequence from UniProt. Sequences were cropped to only show regions containing acetylated sites in the E. coli proteins (blue highlighting indicates KAT acetylation sites, red indicates AcP acetylation sites, and purple indicates both AcP and KAT acetylation sites). UniProt IDs for each protein are listed adjacent to each sequence and the E. coli substrate protein sequence and secondary structure of the target structure used in our comparative analysis is shown on top (PDB ID: 1ake for Adk, PDB ID: 1ai2 for Icd, PDB ID: 1cf9 for KatE, PDB ID: 2fmt for Fmt, and PDB ID: 5caj). Sequences are ordered from highest to lowest percent sequence identity compared to the target protein: approximately 99–66% (Adk), 99–73% (Icd), 99–62% (KatE), 91–56% (Fmt), and 100–58% (YaaA). Complete sequence alignments and details about selected proteins are shown in Supplementary Figure 4. See section “MATERIALS AND METHODS” for further details.

Similar articles

Cited by

References

    1. Bolduc J. M., Dyer D. H., Scott W. G., Singer P., Sweet R. M., Koshland D. E., et al. (1995). Mutagenesis and Laue structures of enzyme intermediates: isocitrate dehydrogenase. Science 268 1312–1318. 10.1126/science.7761851 - DOI - PubMed
    1. Borthwick A. C., Holms W. H., Nimmo H. G. (1984). Amino acid sequence round the site of phosphorylation in isocitrate dehydrogenase from Escherichia coli ML308. FEBS Lett. 174 112–115. 10.1016/0014-5793(84)81087-x - DOI - PubMed
    1. Bravo J., Verdaguer N., Tormo J., Betzel C., Switala J., Loewen P. C., et al. (1995). Crystal structure of catalase HPII from Escherichia coli. Structure 3 491–502. 10.1016/s0969-2126(01)00182-4 - DOI - PubMed
    1. Cai Y., Chandrangsu P., Gaballa A., Helmann J. D. (2017). Lack of formylated methionyl-tRNA has pleiotropic effects on Bacillus subtilis. Microbiology 163 185–196. 10.1099/mic.0.000413 - DOI - PMC - PubMed
    1. Carabetta V. J., Cristea I. M. (2017). Regulation, function, and detection of protein acetylation in bacteria. J. Bacteriol. 199 e107–e117. 10.1128/JB.00107-17 - DOI - PMC - PubMed

LinkOut - more resources