

Concurrent validity and intrarater reliability of two ultrasound-based methods for assessing patellar tendon stiffness
- PMID: 35173775
- PMCID: PMC8841948
- DOI: 10.1177/1742271X21994609
Concurrent validity and intrarater reliability of two ultrasound-based methods for assessing patellar tendon stiffness
Abstract
Introduction: Assessment of tendon stiffness in vivo traditionally involves maximal muscle contractions, which can be challenging in pain populations. Alternative methods are suggested, although the clinimetric properties are sparse. This study investigated the concurrent validity and the intrarater reliability of two ultrasound-based methods for assessing patellar tendon stiffness.
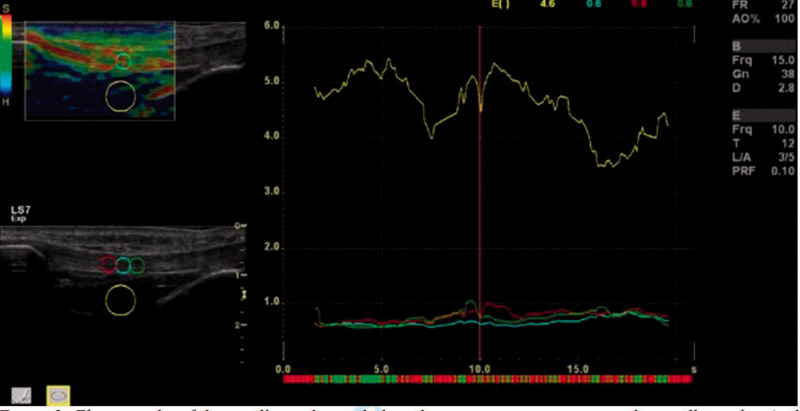
Methods: Patellar tendon stiffness was assessed in 17 healthy adults with (a) the dynamometer and B-mode ultrasonography method (DBUS) and (b) the strain elastography method. Correlations between the two methods were analysed using Kendall's Tau-b. The relative reliability of both methods was evaluated using intraclass correlation coefficient (ICC). The absolute reliability was presented by Bland-Altman plots, standard error of measurement (SEM) and minimum detectable change (MDC).
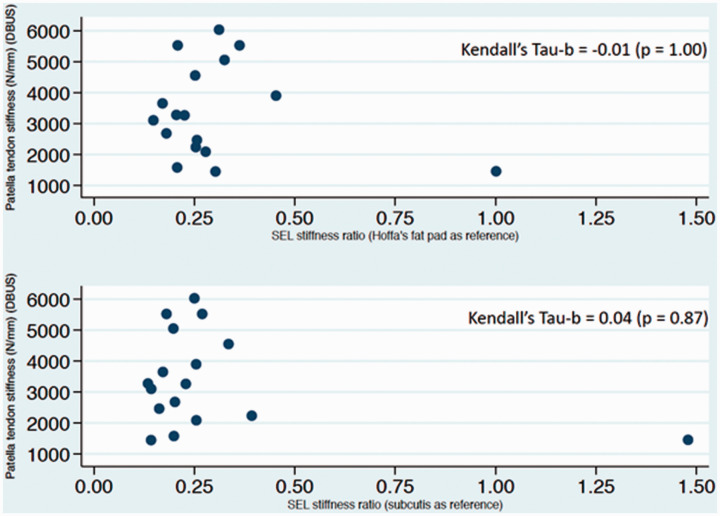
Results: No correlation was found between the two methods, irrespective of reference tissue in strain elastography (Kendall's Tau-b Hoffa = -0.01 (p = 1.00), Kendall's Tau-b subcutis = 0.04 (p = 0.87)). Tracking of the tendon elongation in the DBUS method had good to excellent relative reliability (ICC = 0.95 (95% confidence interval - CI: 0.85-0.98)) and high absolute reliability (SEM = 0.04 mm (1%), MDC = 0.11 mm (3%)). The strain elastography method had good to excellent relative reliability, regardless of reference tissue (ICC Hoffa = 0.95 (95% CI: 0.86-0.98), ICC subcutis = 0.94 (95% CI: 0.82-0.98)), but low absolute reliability (SEM Hoffa = 0.06 (20%), MDC Hoffa = 0.18 (60%), SEM subcutis = 0.12 (41%), MDC subcutis = 0.32 (110%)).
Conclusions: No concurrent validity existed for DBUS and strain elastography, suggesting that the two methods measure different tendon properties. The overall reliability for the DBUS method was high, but the absolute reliability was low for strain elastography stiffness ratios. Therefore, the strain elastography method may not be recommended for tracking differences in patellar tendon stiffness in healthy adults.
Keywords: Patellar tendon; elastography; reliability; stiffness; ultrasound.
© The Author(s) 2021.
Figures


References
-
- Biewener AA, Roberts TJ. Muscle and tendon contributions to force, work, and elastic energy savings: a comparative perspective. Exerc Sport Sci Rev 2000; 28: 99–107. - PubMed
-
- Svensson RB, Heinemeier KM, Couppé C, et al.. Effect of aging and exercise on the tendon. J Appl Physiol (Bethesda, MD: 1985 ) 2016; 121: 1237–1246. - PubMed
-
- Eriksen CS, Henkel C, Svensson RB, et al. . Lower tendon stiffness in very old compared to old individuals is unaffected by short term resistance training of skeletal muscle. J Appl Physiol (Bethesda, MD: 1985) 2018; 125: 205--214. - PubMed
LinkOut - more resources
Full Text Sources