

Assessment of cerebral oxygenation response to hemodialysis using near-infrared spectroscopy (NIRS): Challenges and solutions
- PMID: 35173820
- PMCID: PMC8846418
- DOI: 10.1142/s1793545821500164
Assessment of cerebral oxygenation response to hemodialysis using near-infrared spectroscopy (NIRS): Challenges and solutions
Abstract
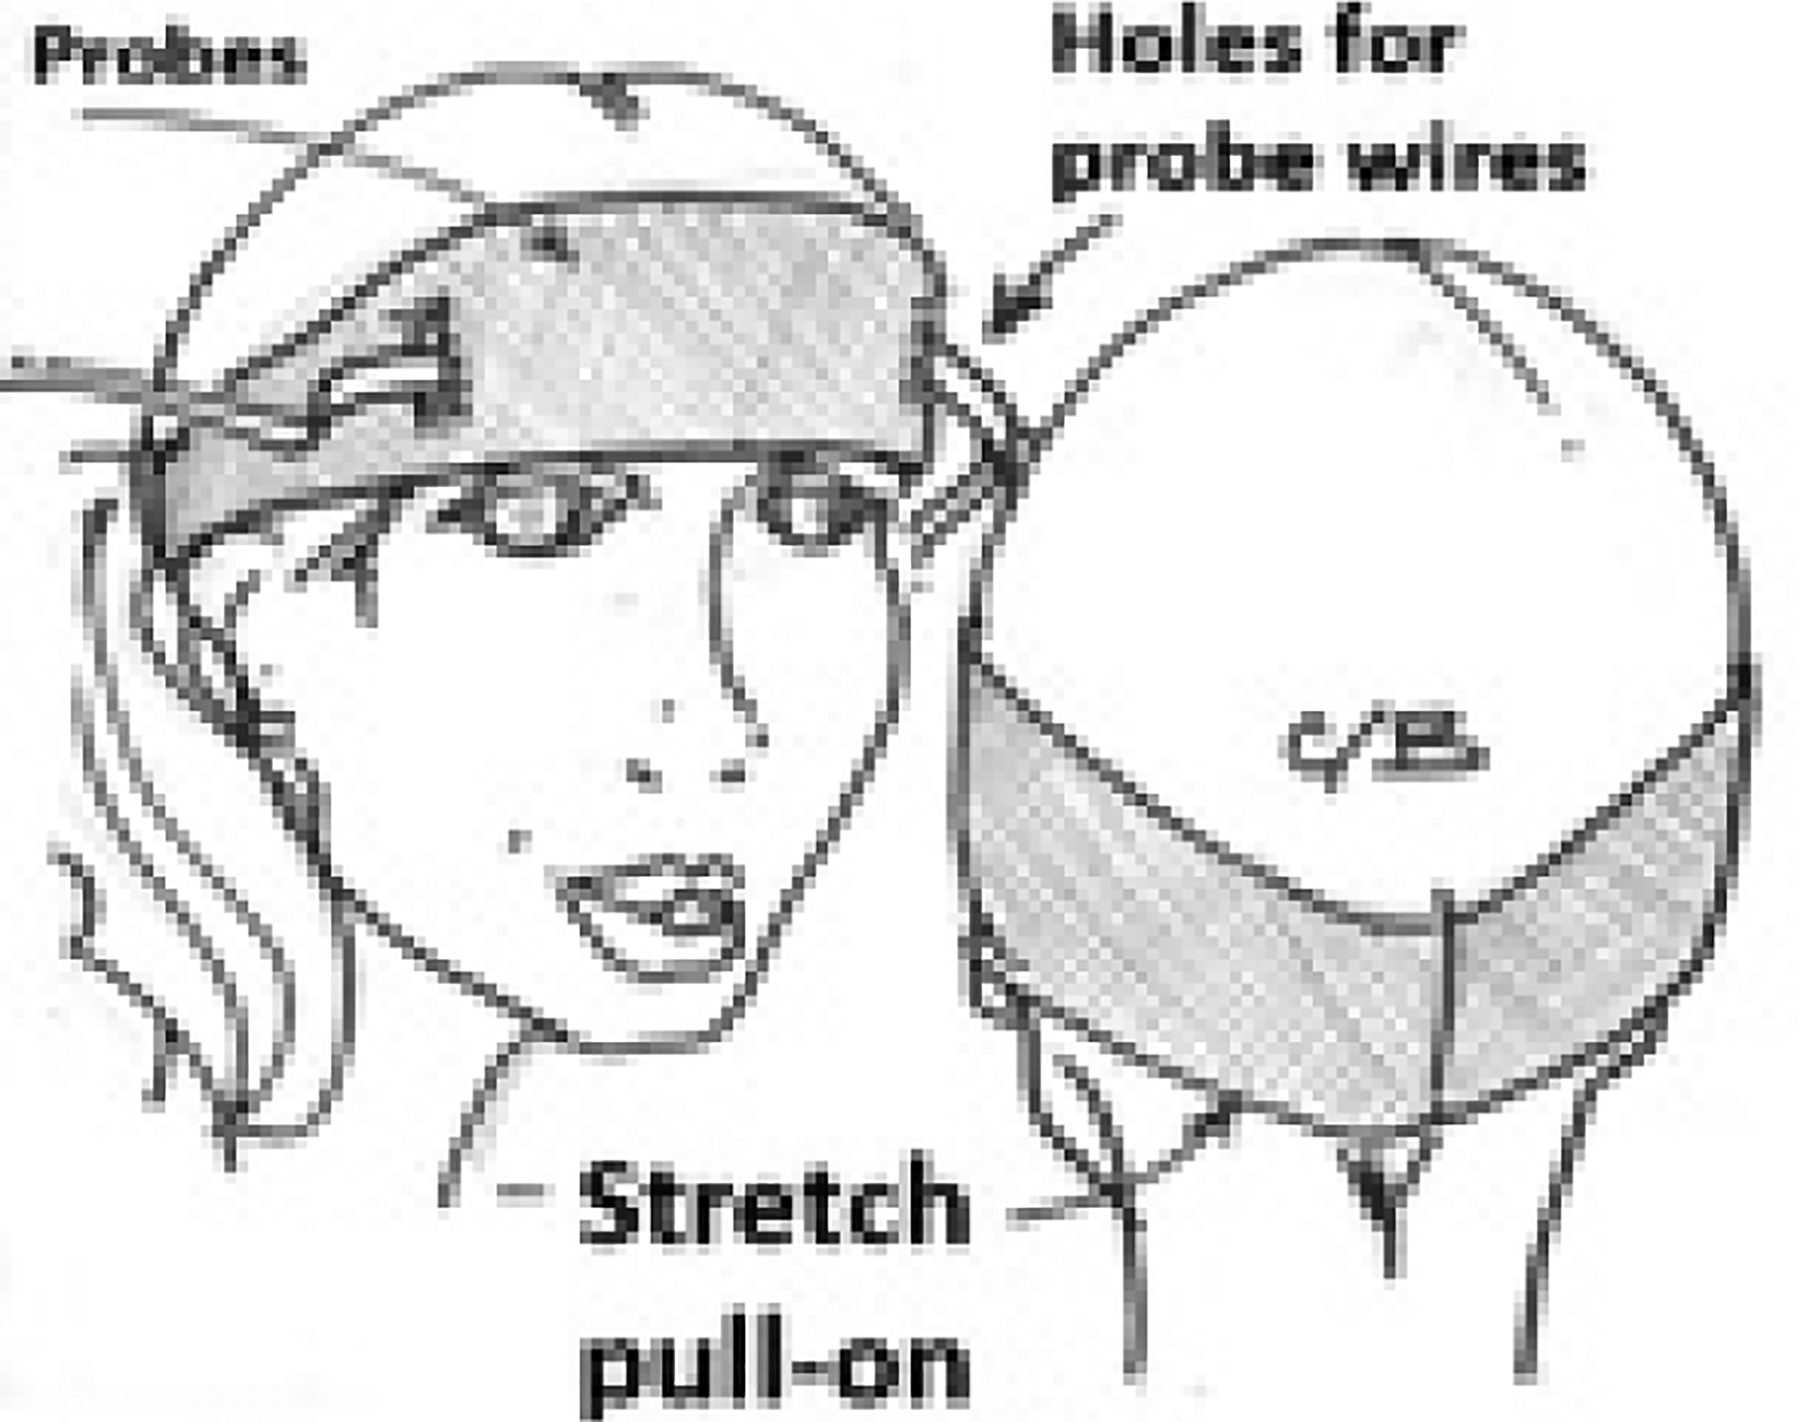
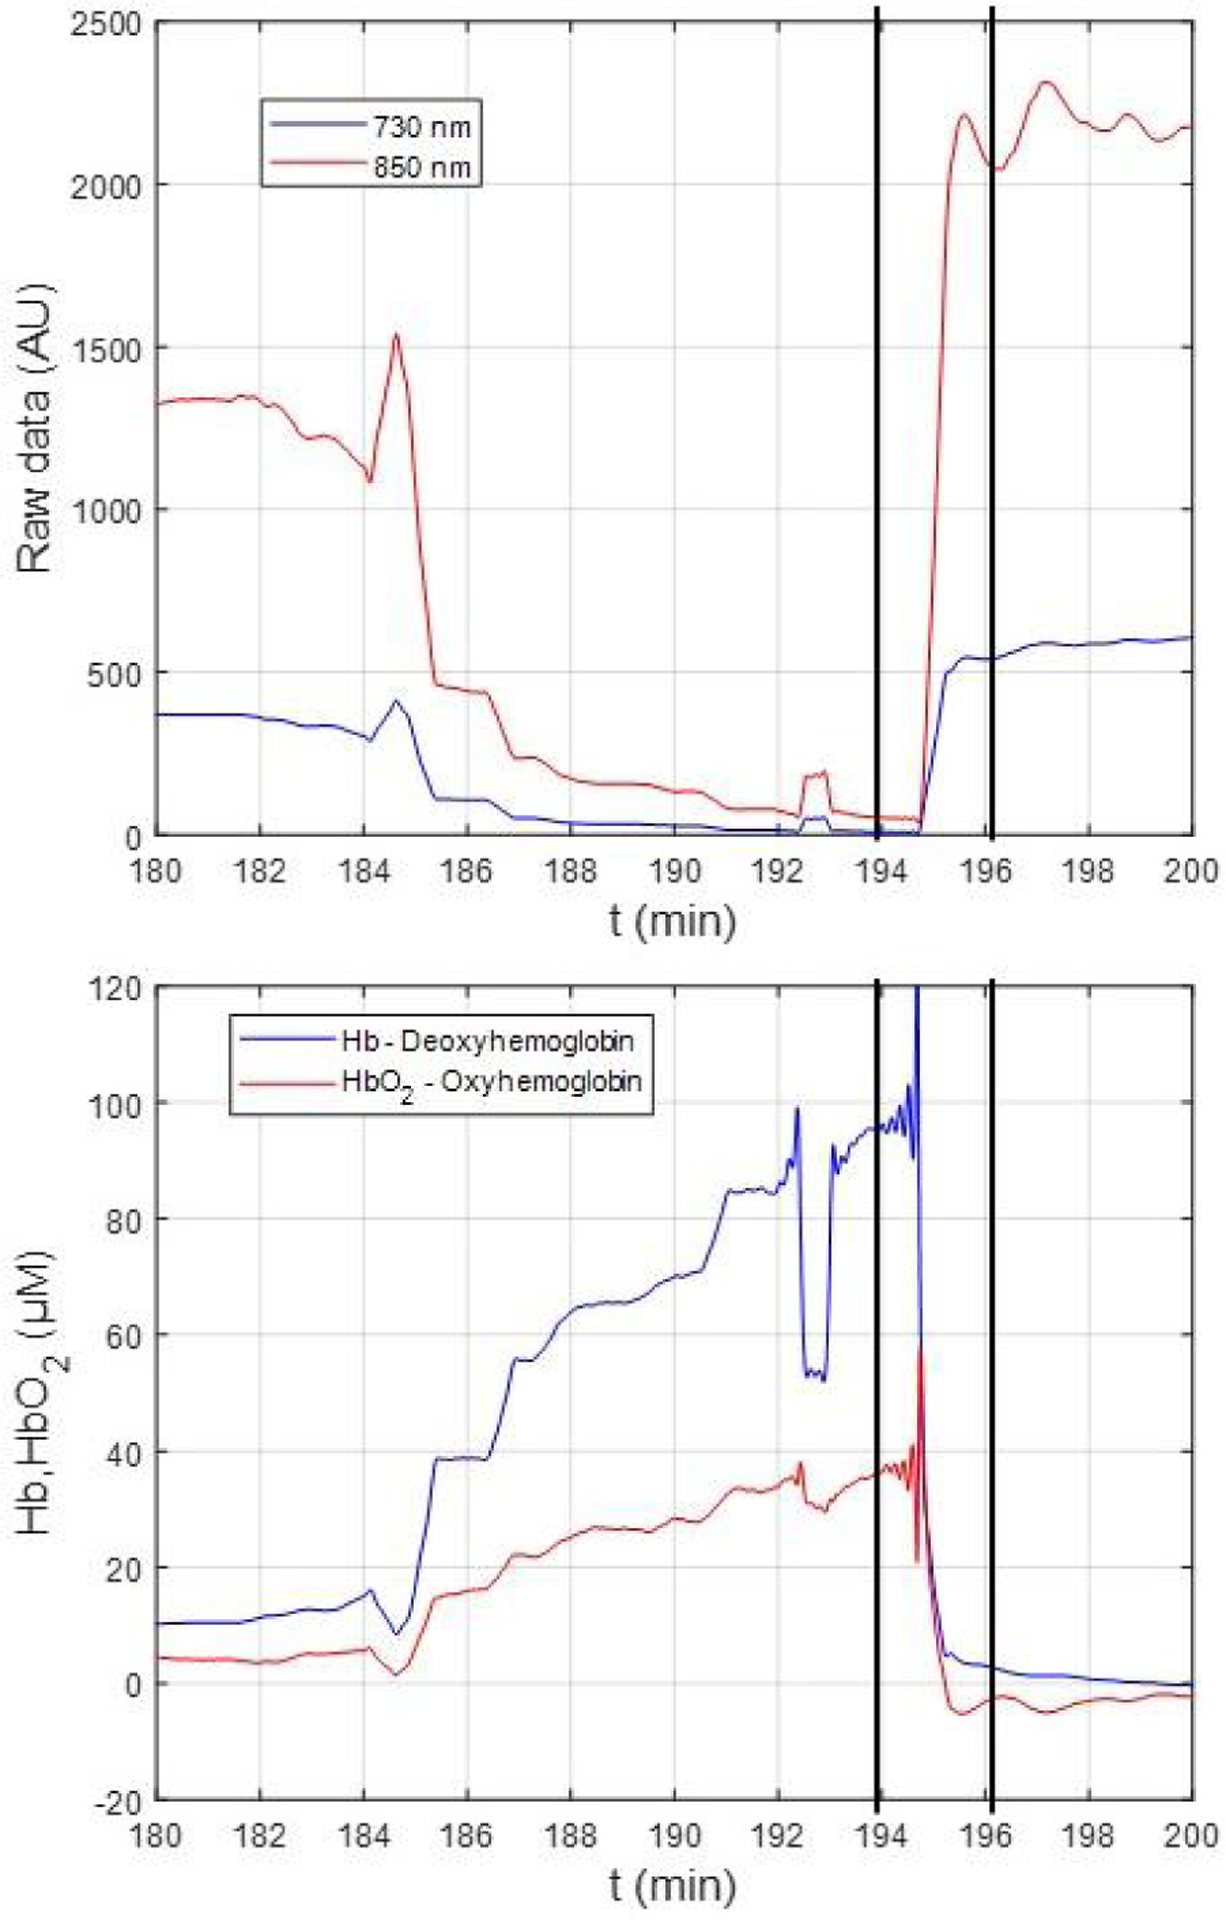
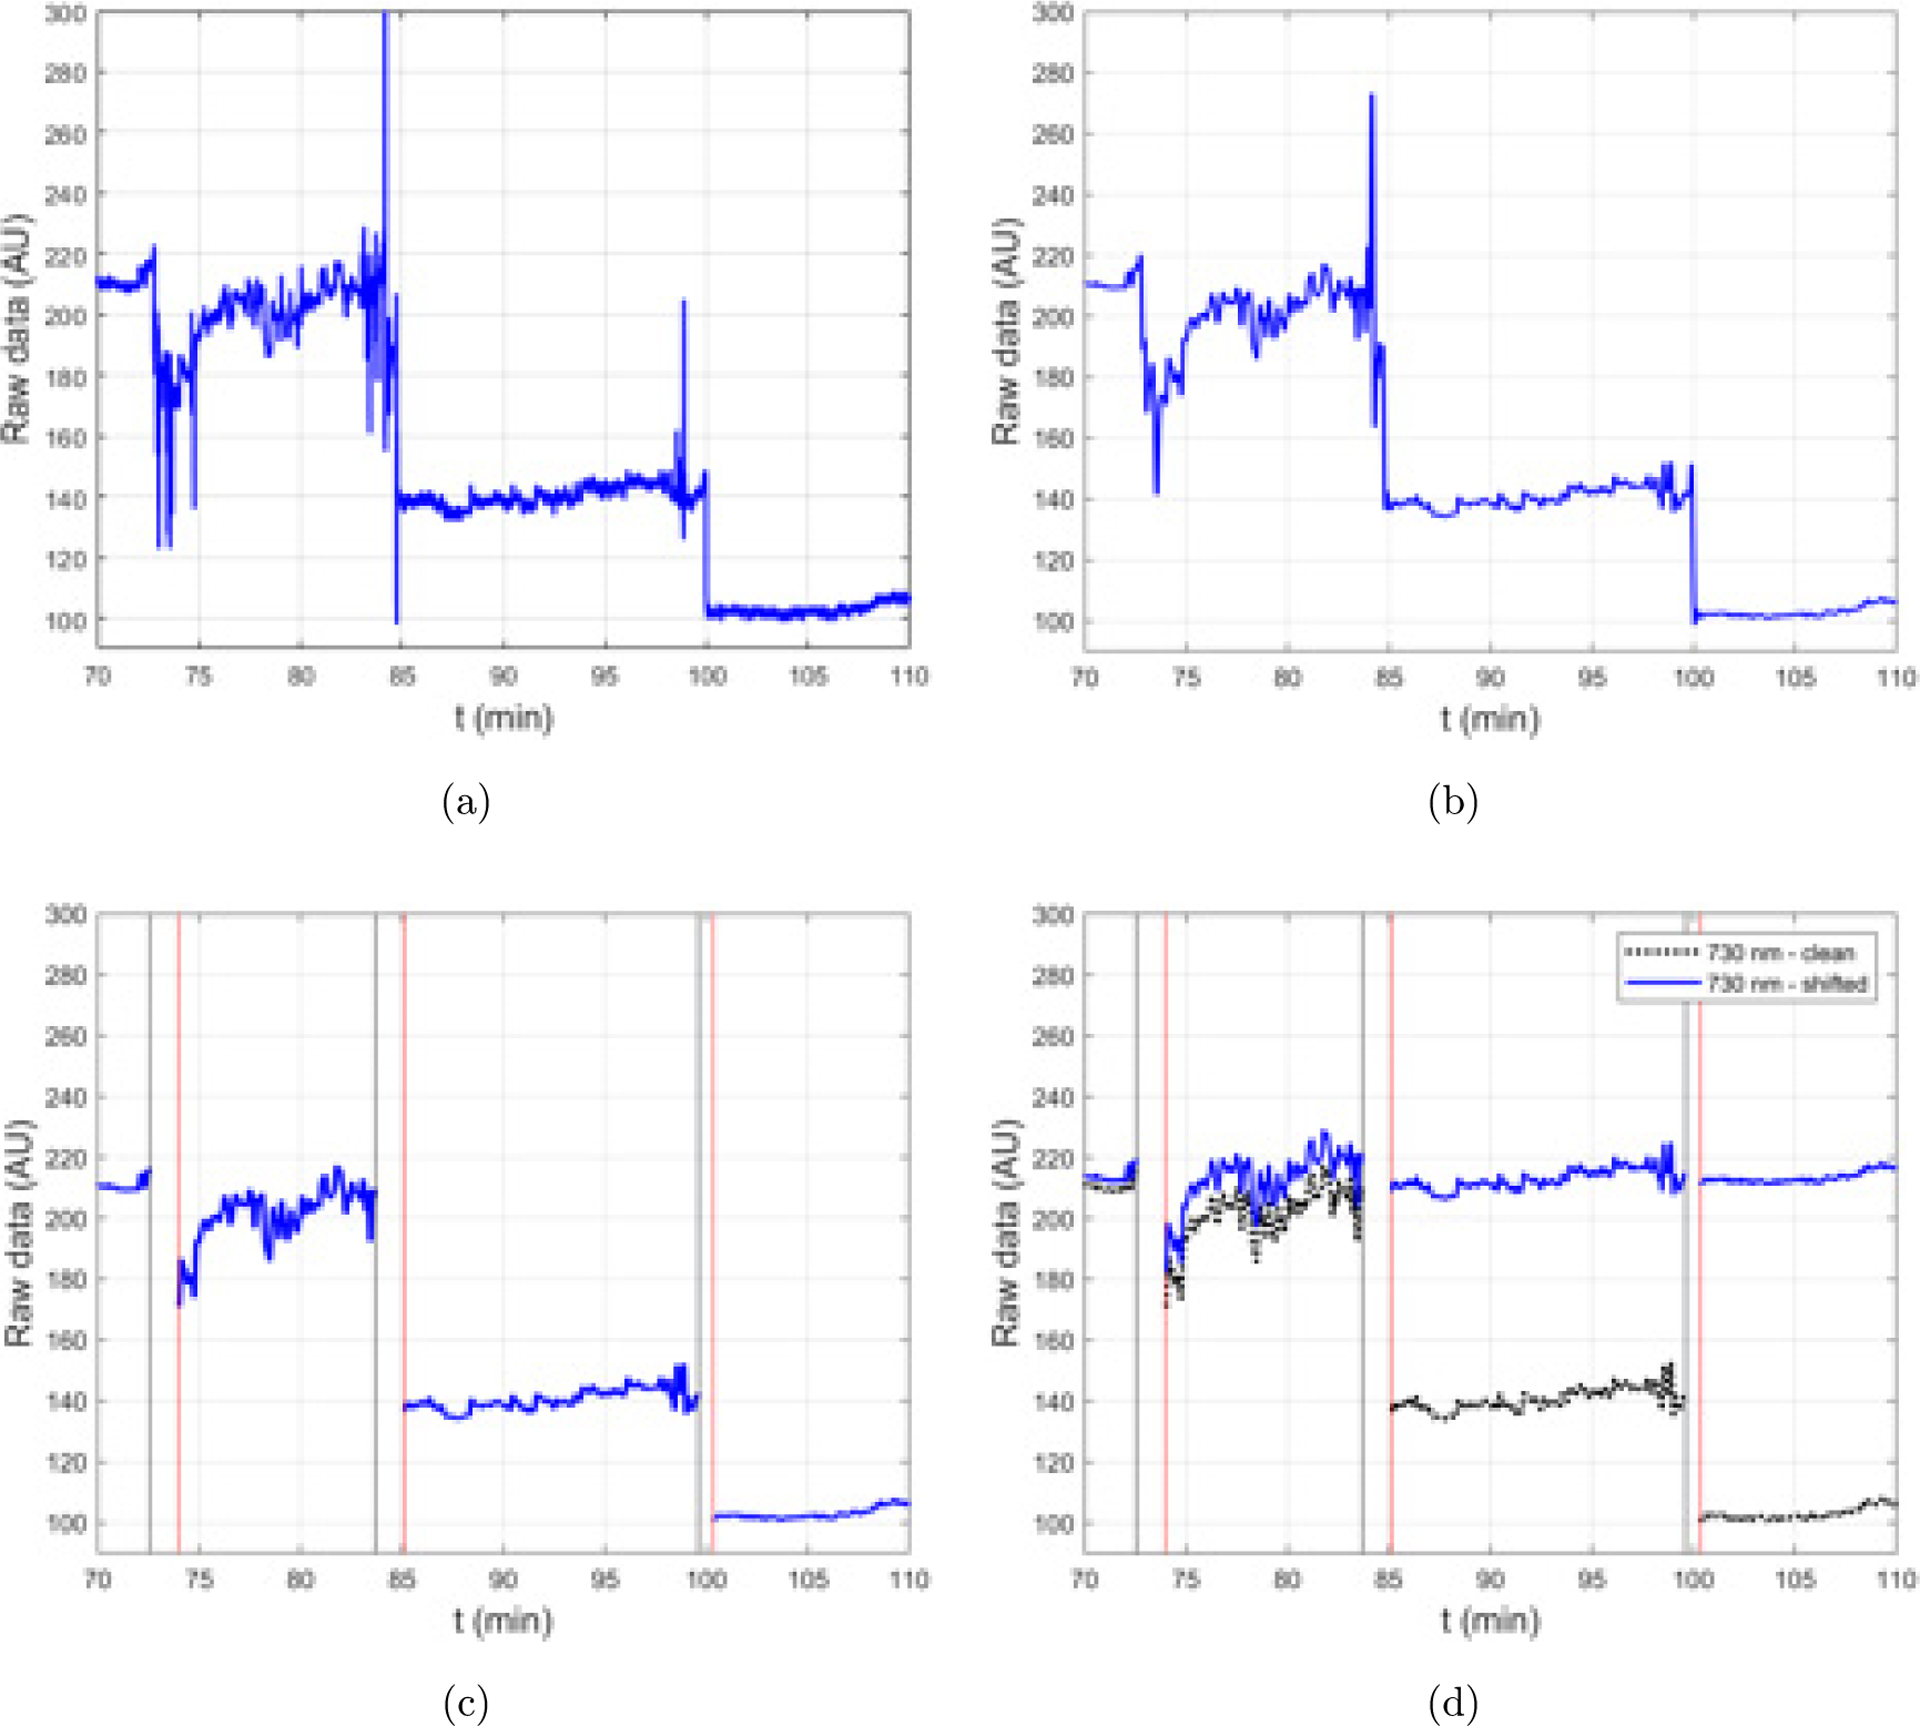
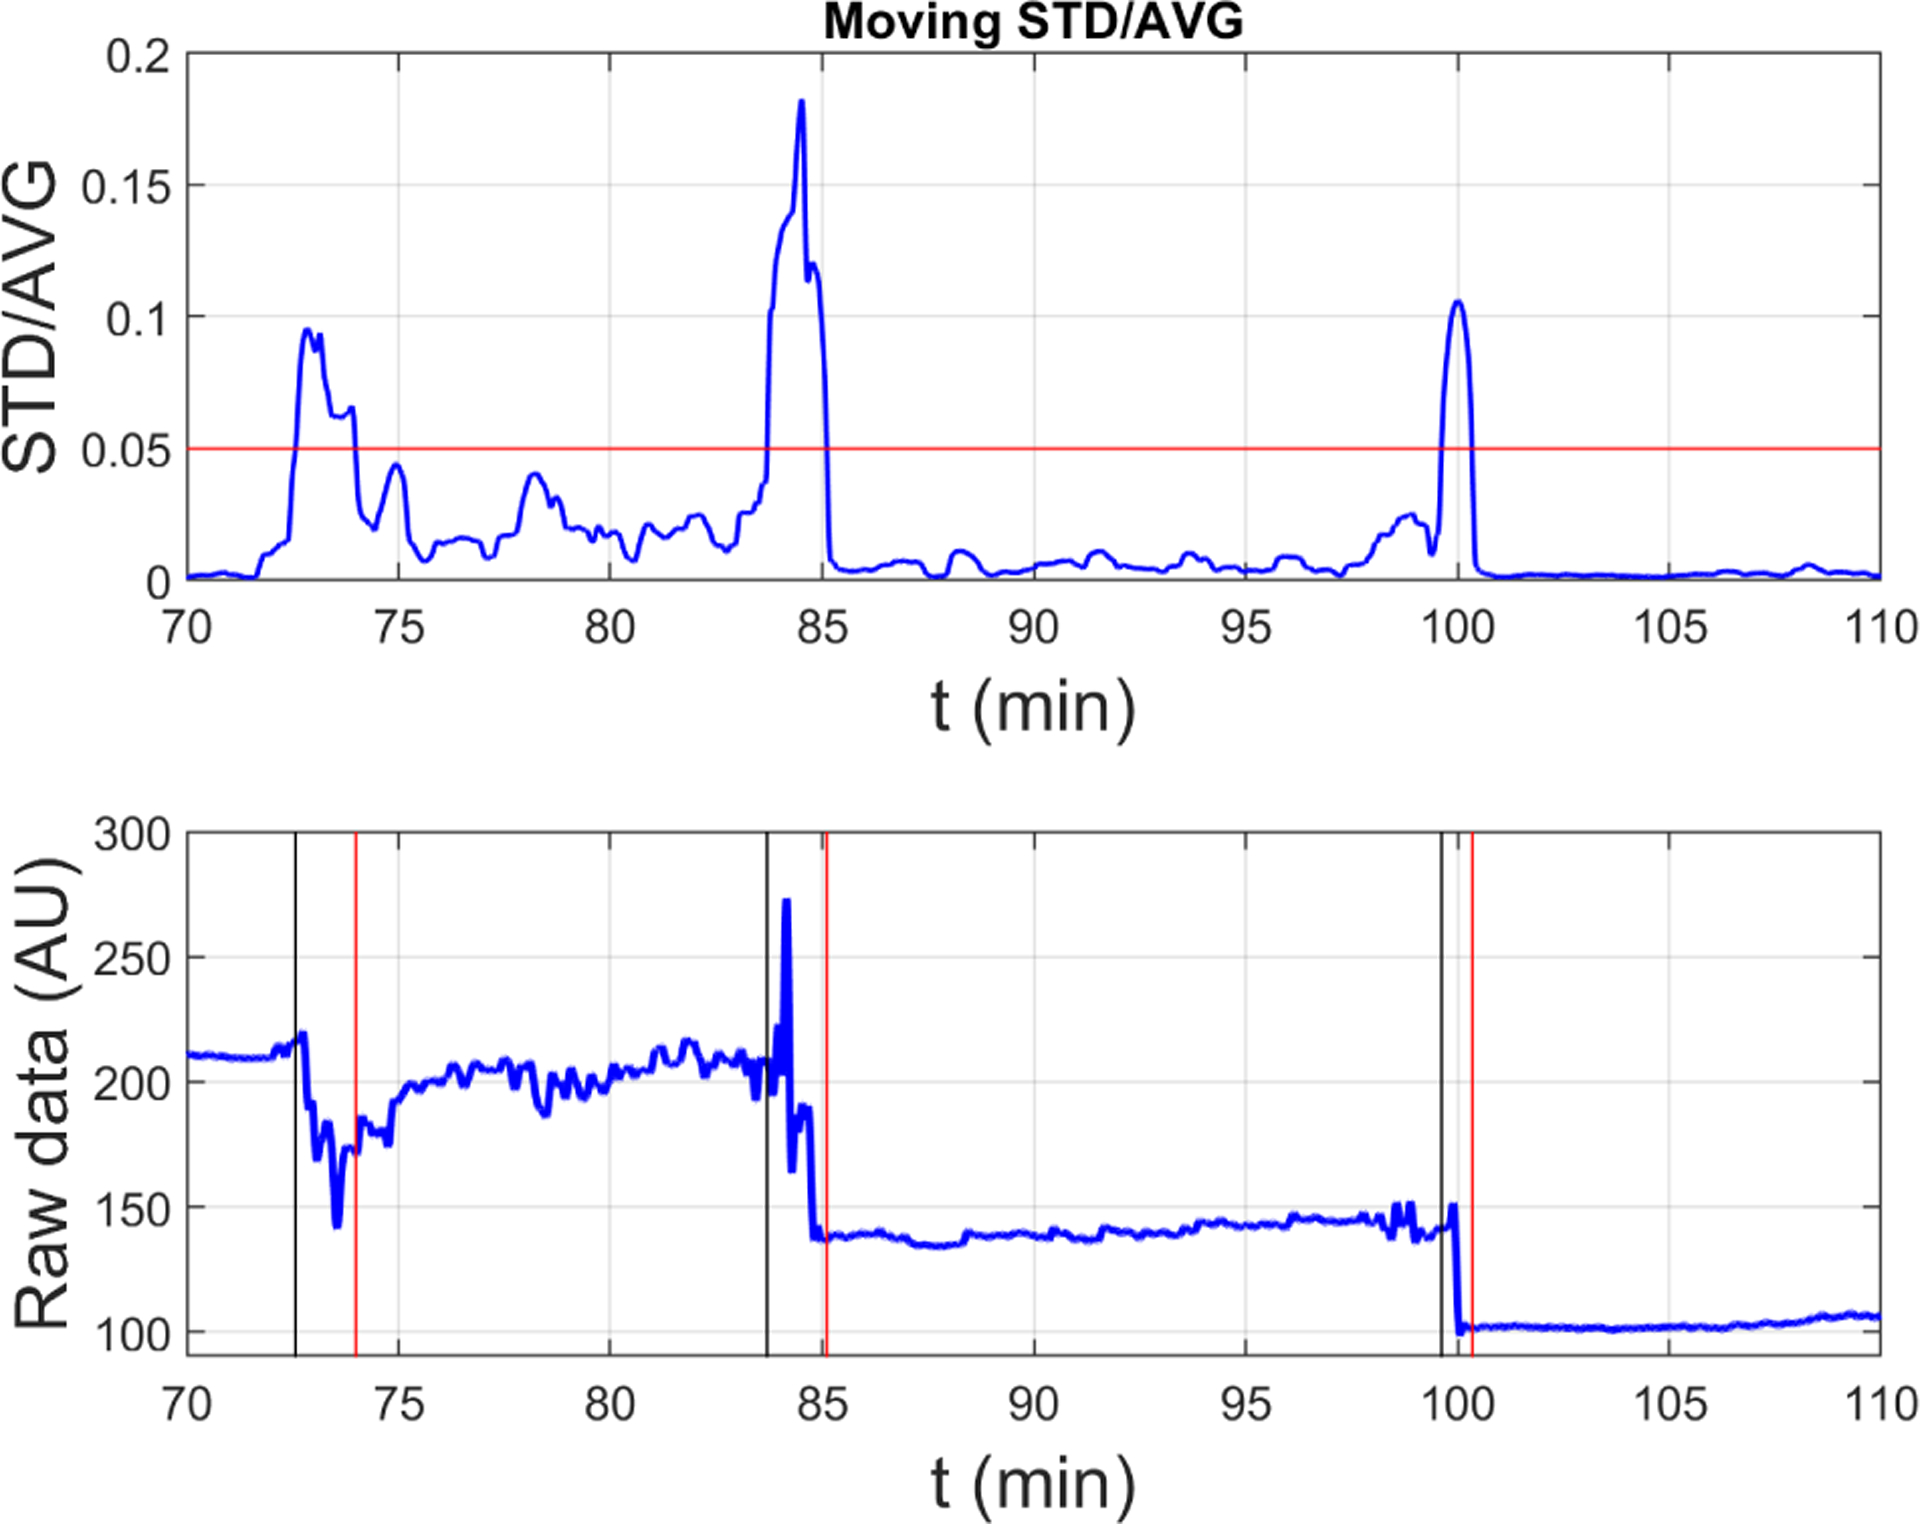
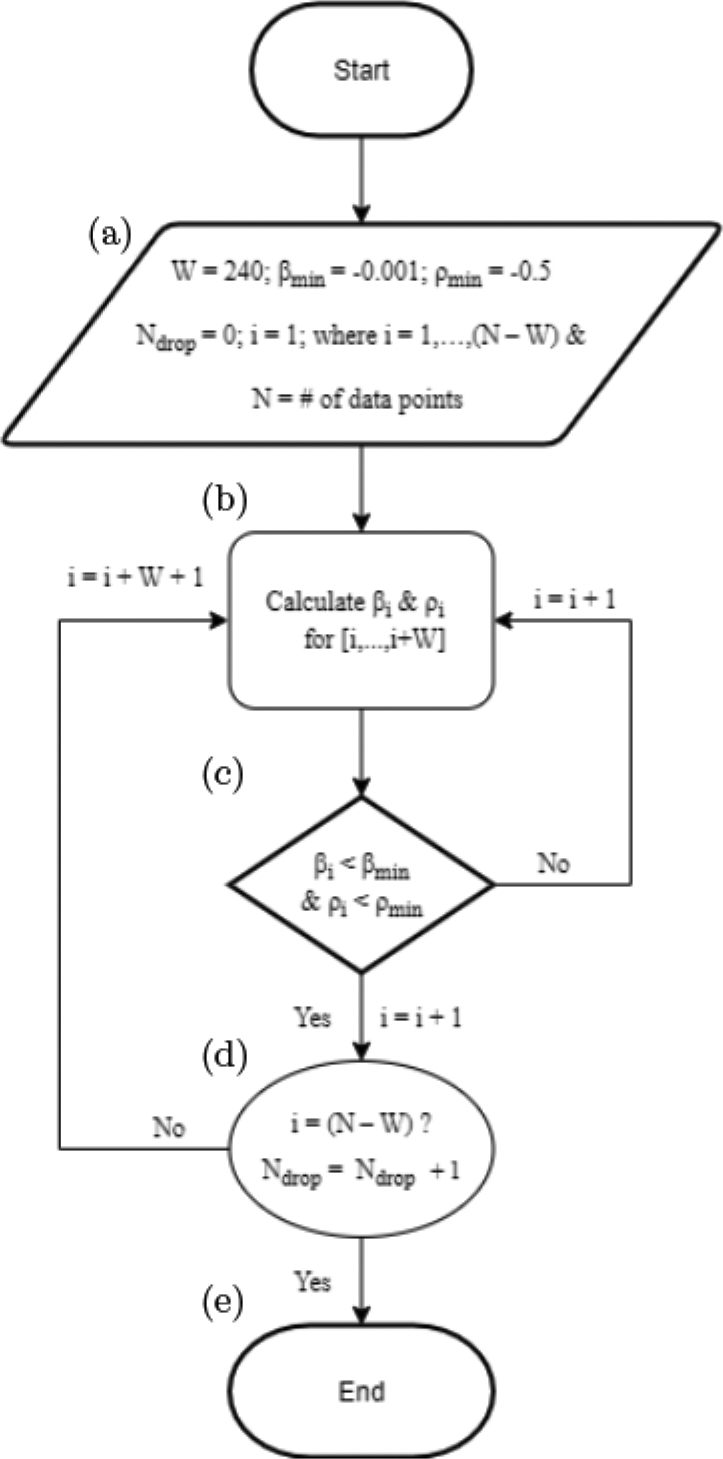
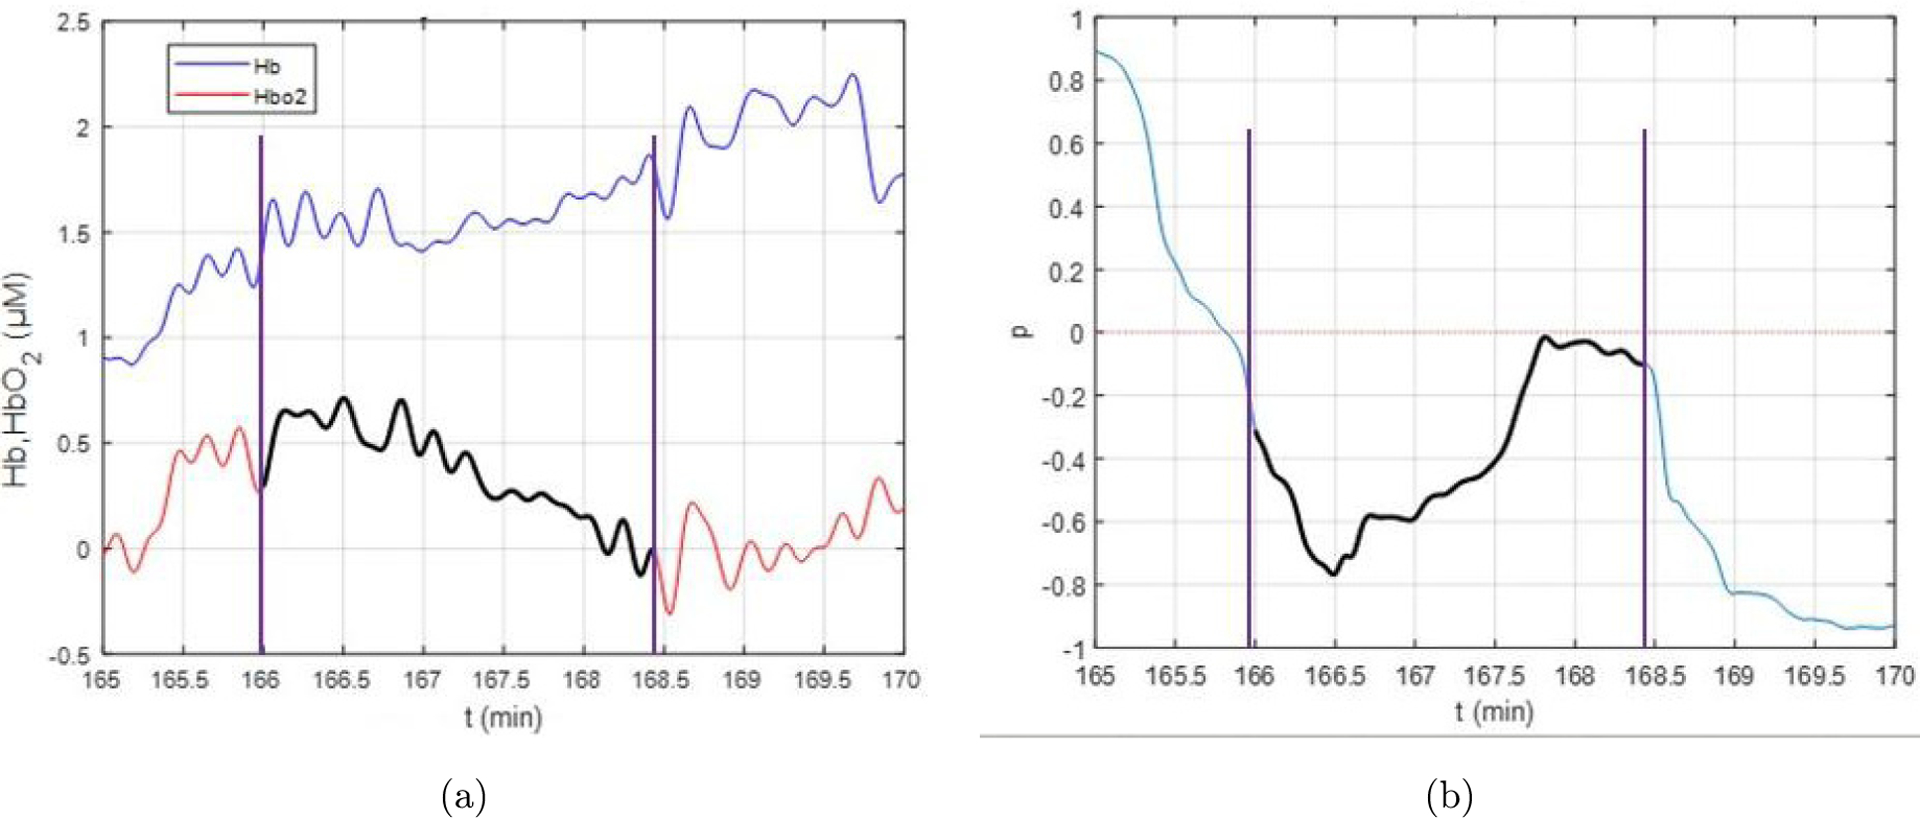
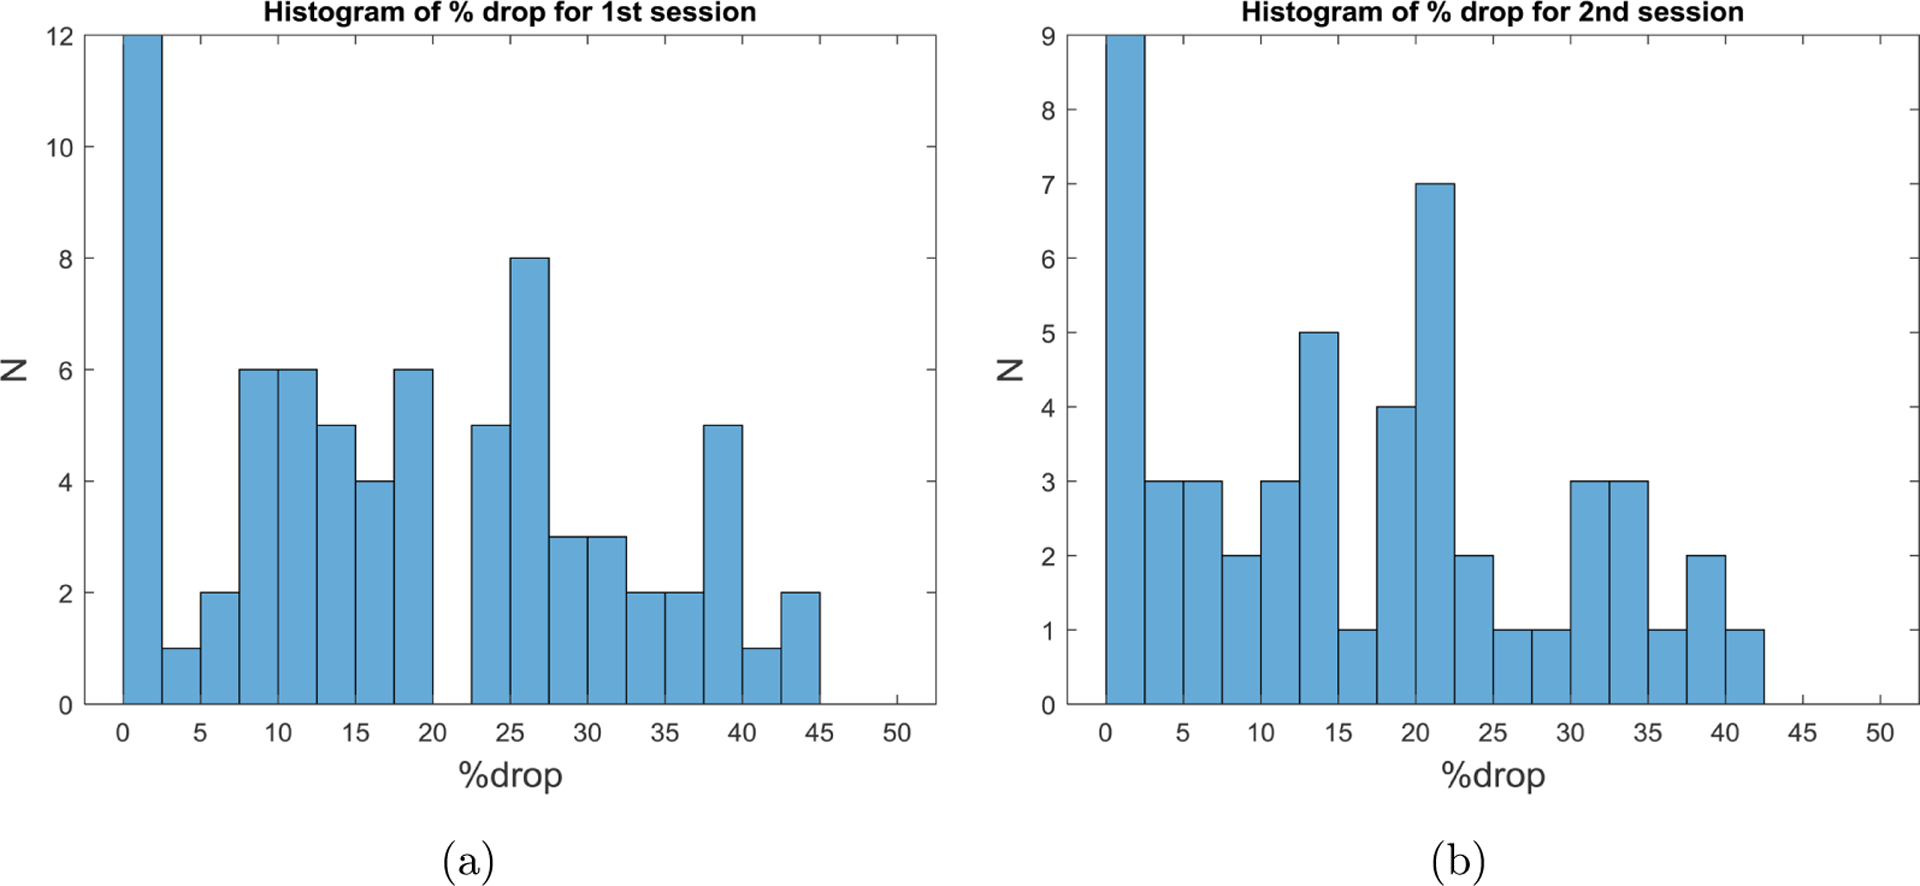
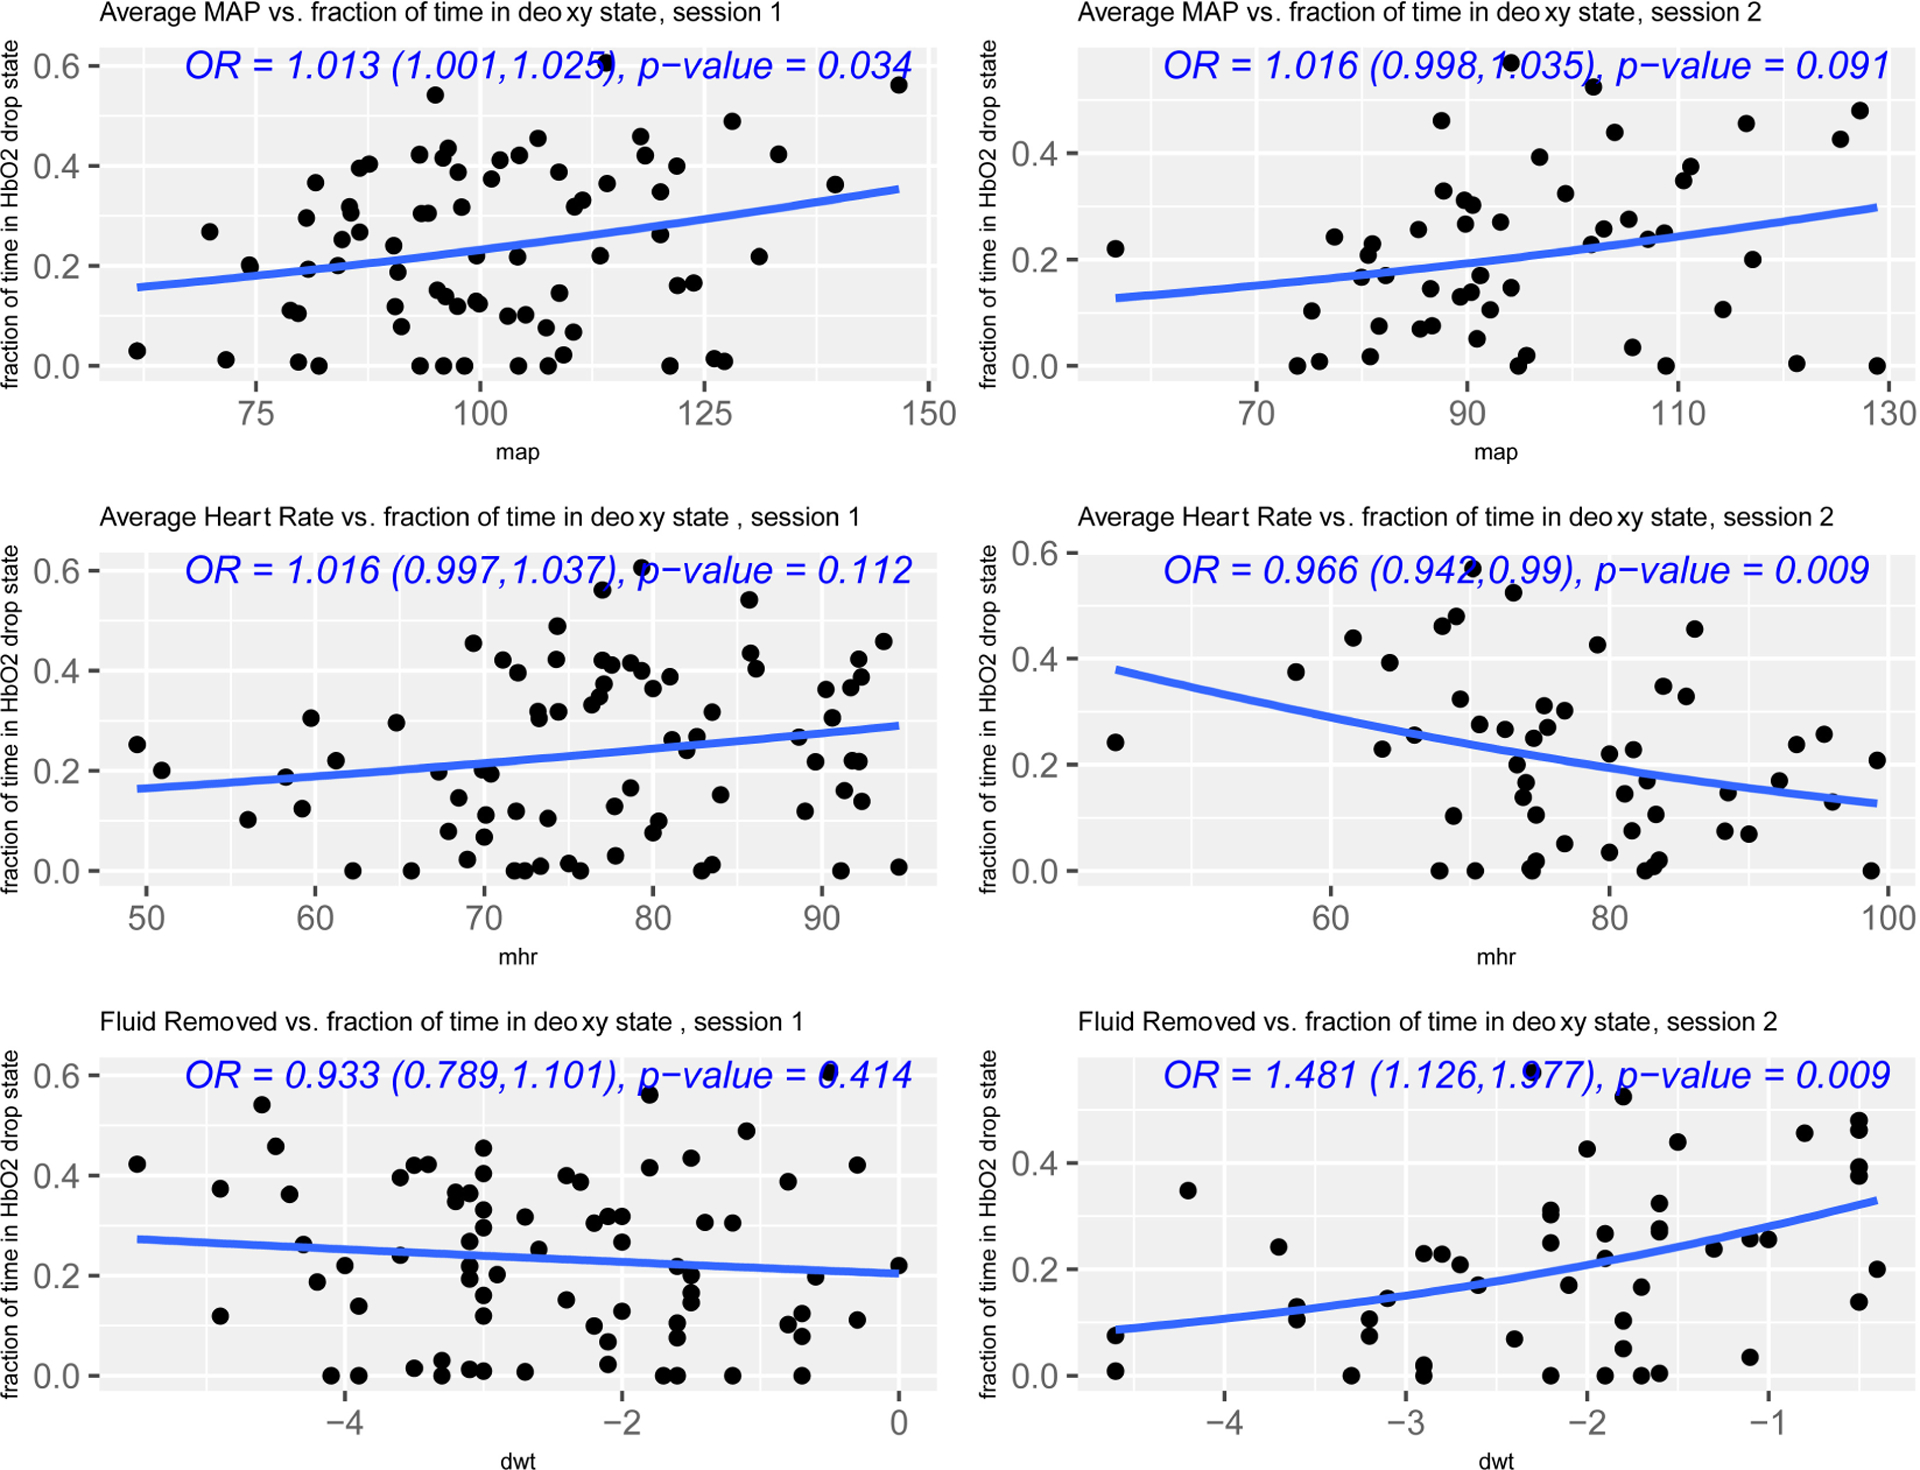
To date, the clinical use of functional near-infrared spectroscopy (NIRS) to detect cerebral ischemia has been largely limited to surgical settings, where motion artifacts are minimal. In this study, we present novel techniques to address the challenges of using NIRS to monitor ambulatory patients with kidney disease during approximately eight hours of hemodialysis (HD) treatment. People with end-stage kidney disease who require HD are at higher risk for cognitive impairment and dementia than age-matched controls. Recent studies have suggested that HD-related declines in cerebral blood flow might explain some of the adverse outcomes of HD treatment. However, there are currently no established paradigms for monitoring cerebral perfusion in real-time during HD treatment. In this study, we used NIRS to assess cerebral hemodynamic responses among 95 prevalent HD patients during two consecutive HD treatments. We observed substantial signal attenuation in our predominantly Black patient cohort that required probe modifications. We also observed consistent motion artifacts that we addressed by developing a novel NIRS methodology, called the HD cerebral oxygen demand algorithm (HD-CODA), to identify episodes when cerebral oxygen demand might be outpacing supply during HD treatment. We then examined the association between a summary measure of time spent in cerebral deoxygenation, derived using the HD-CODA, and hemodynamic and treatment-related variables. We found that this summary measure was associated with intradialytic mean arterial pressure, heart rate, and volume removal. Future studies should use the HD-CODA to implement studies of real-time NIRS monitoring for incident dialysis patients, over longer time frames, and in other dialysis modalities.
Keywords: Motion artifact removal; cerebral oxygenation; end-stage kidney disease; near-infrared spectroscopy.
Conflict of interest statement
Conflict of Interest The authors report no relevant financial conflicts of interest.
Figures
Similar articles
-
Measurement of Tissue Oxygenation using Near-infrared Spectroscopy in Patients undergoing Hemodialysis.J Vis Exp. 2020 Oct 2;(164). doi: 10.3791/61721. J Vis Exp. 2020. PMID: 33074258
-
Changes in cerebral oxygenation and cerebral blood flow during hemodialysis - A simultaneous near-infrared spectroscopy and positron emission tomography study.J Cereb Blood Flow Metab. 2020 Feb;40(2):328-340. doi: 10.1177/0271678X18818652. Epub 2018 Dec 12. J Cereb Blood Flow Metab. 2020. PMID: 30540219 Free PMC article. Clinical Trial.
-
Changes in hemodynamic parameters and cerebral saturation during supraventricular tachycardia.Pediatr Cardiol. 2012 Feb;33(2):286-9. doi: 10.1007/s00246-011-0133-3. Epub 2011 Oct 2. Pediatr Cardiol. 2012. PMID: 21965125
-
Cerebral near-infrared spectroscopy in the care of patients during cardiological procedures: a summary of the clinical evidence.J Clin Monit Comput. 2016 Dec;30(6):901-909. doi: 10.1007/s10877-015-9791-7. Epub 2015 Oct 8. J Clin Monit Comput. 2016. PMID: 26449691 Review.
-
Near infrared spectroscopy in children at high risk of low perfusion.Curr Opin Anaesthesiol. 2010 Jun;23(3):342-7. doi: 10.1097/ACO.0b013e3283393936. Curr Opin Anaesthesiol. 2010. PMID: 20421789 Review.
Cited by
-
Effects of tactile feedback in post-stroke hand rehabilitation on functional connectivity and cortical activation: an fNIRS study.Biomed Opt Express. 2025 Jan 21;16(2):643-656. doi: 10.1364/BOE.541820. eCollection 2025 Feb 1. Biomed Opt Express. 2025. PMID: 39958859 Free PMC article.
-
The Potential Use of Near- and Mid-Infrared Spectroscopy in Kidney Diseases.Int J Mol Sci. 2023 Apr 4;24(7):6740. doi: 10.3390/ijms24076740. Int J Mol Sci. 2023. PMID: 37047712 Free PMC article. Review.
-
Cognitive impairment in chronic kidney disease: role of brain imaging, functional imaging, electroencephalography, cerebrospinal fluid biomarkers and sensors.Nephrol Dial Transplant. 2025 Mar 13;40(Supplement_2):ii18-ii27. doi: 10.1093/ndt/gfae256. Nephrol Dial Transplant. 2025. PMID: 40080092 Free PMC article. Review.
-
Recombination of the right cerebral cortex in patients with left side USN after stroke: fNIRS evidence from resting state.Front Neurol. 2023 Jul 20;14:1178087. doi: 10.3389/fneur.2023.1178087. eCollection 2023. Front Neurol. 2023. PMID: 37545727 Free PMC article.
-
Transcutaneous auricular vagus nerve stimulation improves cognitive decline by alleviating intradialytic cerebral hypoxia in hemodialysis patients: A fNIRS pilot study.Heliyon. 2024 Oct 26;10(21):e39841. doi: 10.1016/j.heliyon.2024.e39841. eCollection 2024 Nov 15. Heliyon. 2024. PMID: 39975458 Free PMC article.
References
-
- McIntyre CW, “Recurrent circulatory stress: The dark side of dialysis,” Semin. Dial 23(5), 449–451 (2010). - PubMed
Grants and funding
LinkOut - more resources
Full Text Sources