. 2021 Oct;15(5):1135-1169.
doi: 10.3934/ipi.2021032. Epub 2021 May 1.

3D ELECTRICAL IMPEDANCE TOMOGRAPHY RECONSTRUCTIONS FROM SIMULATED ELECTRODE DATA USING DIRECT INVERSION texp AND CALDERÓN METHODS

Affiliations

3D ELECTRICAL IMPEDANCE TOMOGRAPHY RECONSTRUCTIONS FROM SIMULATED ELECTRODE DATA USING DIRECT INVERSION texp AND CALDERÓN METHODS

S J Hamilton et al. Inverse Probl Imaging (Springfield). 2021 Oct.

Abstract

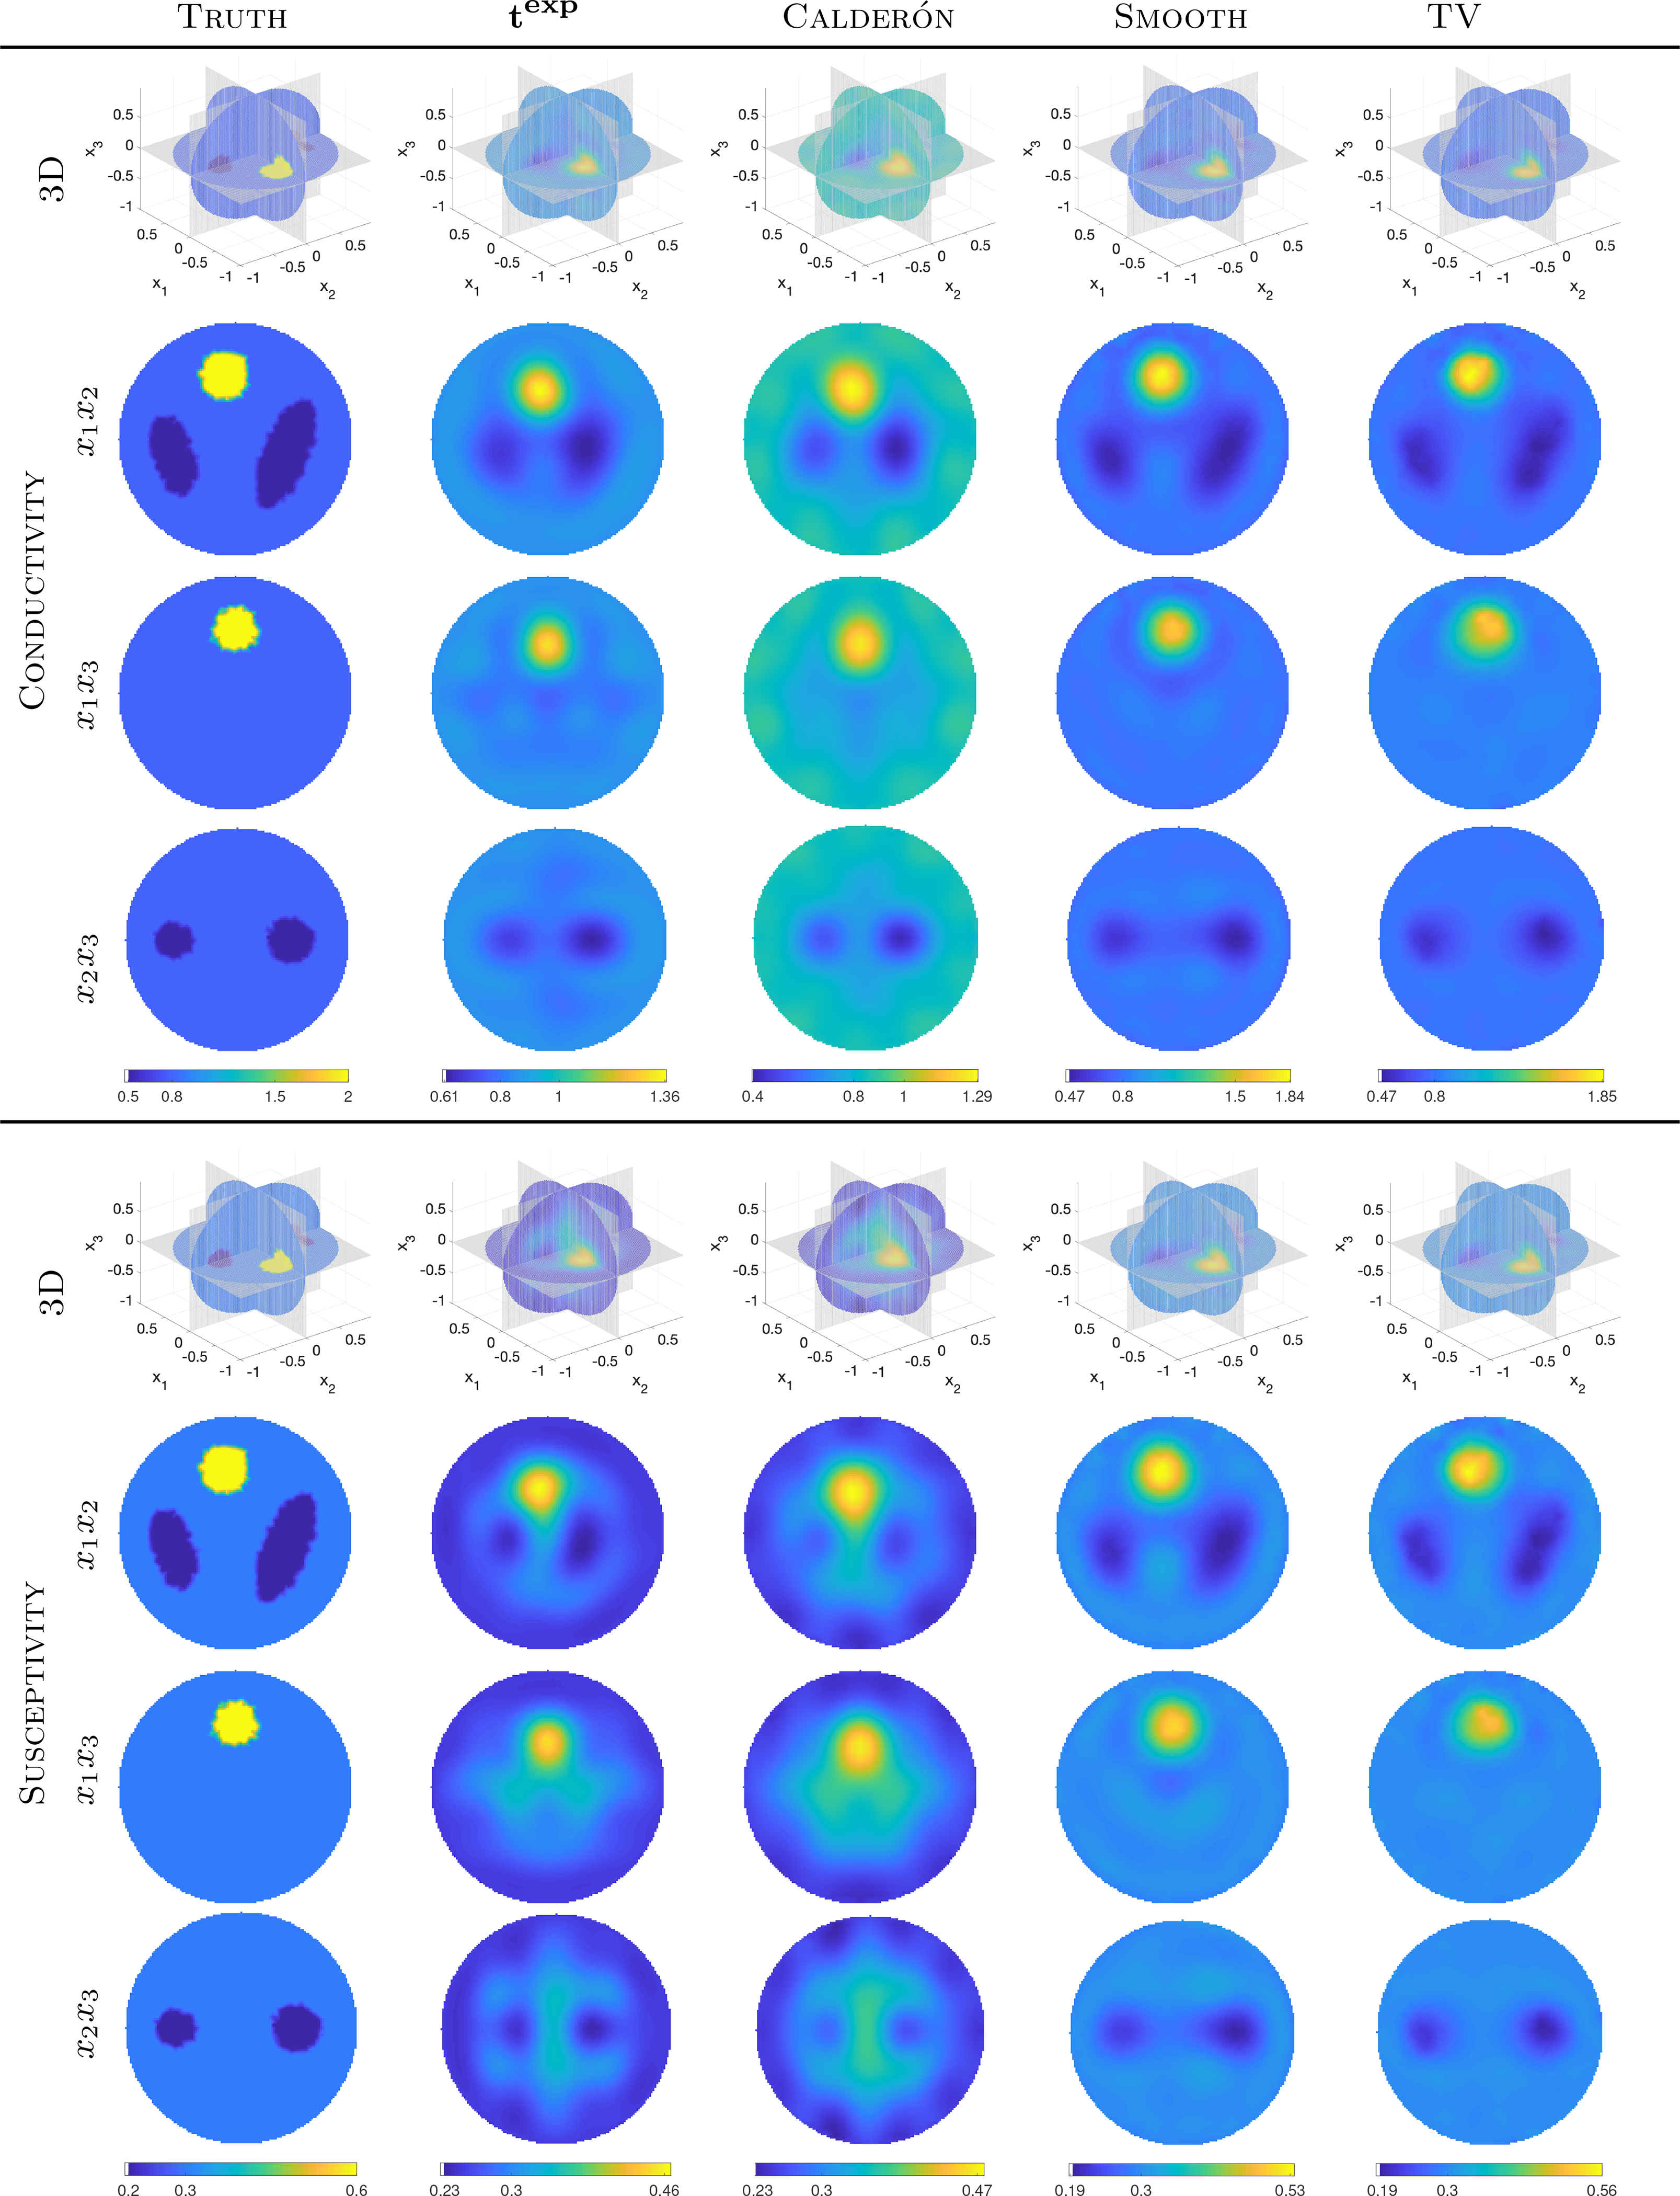
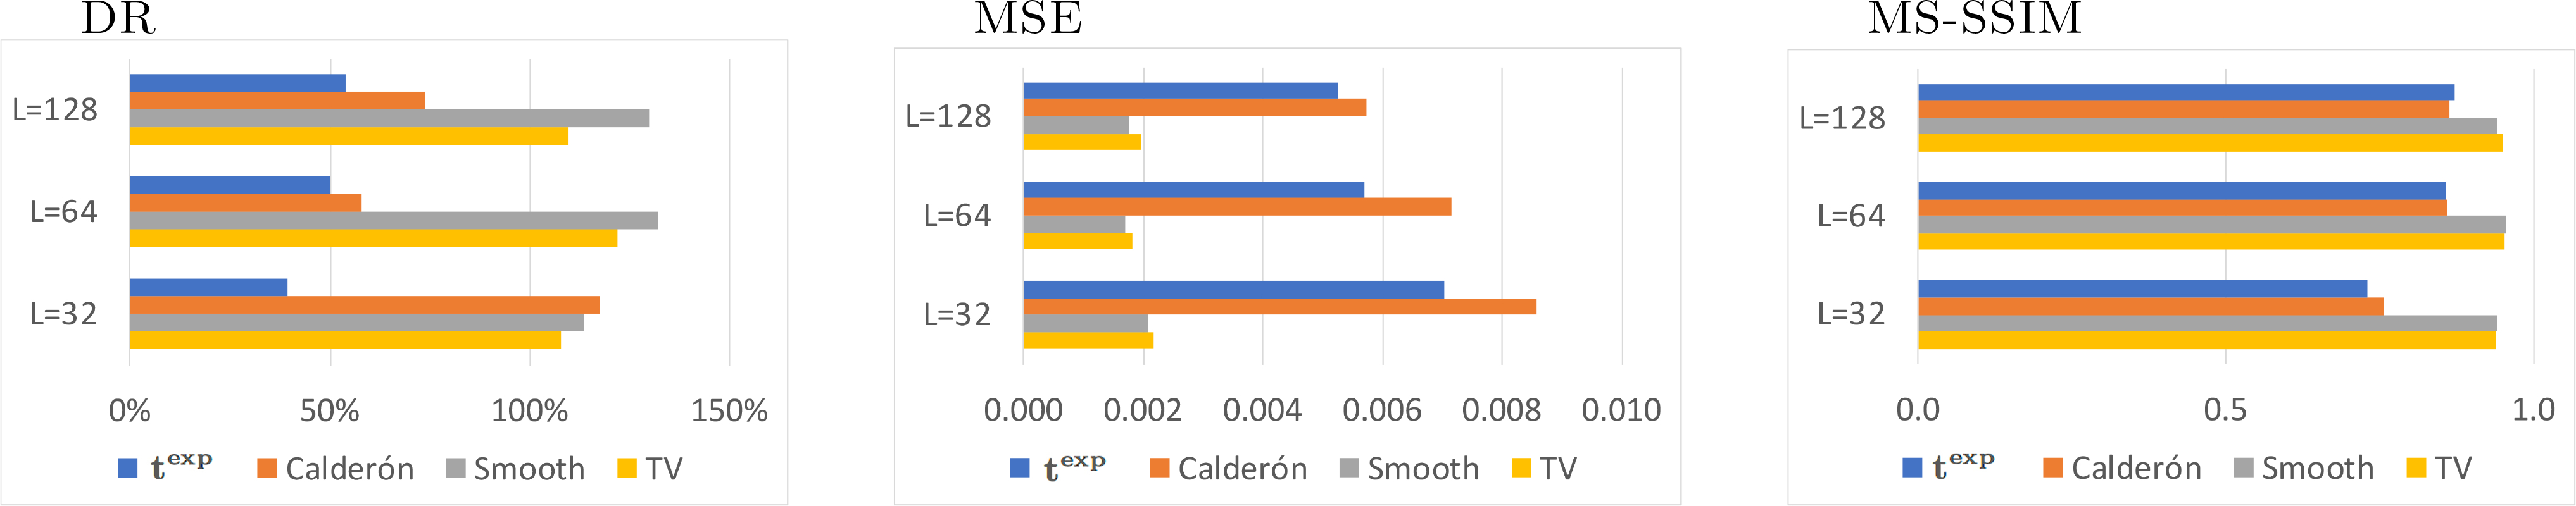
The first numerical implementation of a t exp method in 3D using simulated electrode data is presented. Results are compared to Calderón's method as well as more common TV and smoothness regularization-based methods. The t exp method for EIT is based on tailor-made non-linear Fourier transforms involving the measured current and voltage data. Low-pass filtering in the non-linear Fourier domain is used to stabilize the reconstruction process. In 2D, t exp methods have shown great promise for providing robust real-time absolute and time-difference conductivity reconstructions but have yet to be used on practical electrode data in 3D, until now. Results are presented for simulated data for conductivity and permittivity with disjoint non-radially symmetric targets on spherical domains and noisy voltage data. The 3D t exp and Calderón methods are demonstrated to provide comparable quality to their 2D counterparts, and hold promise for real-time reconstructions due to their fast, non-optimized, computational cost.

Keywords: Calderón; complete electrode model; complex geometrical optics; conductivity; texp.


Figures

Figure 1.
Figure 1.
Demonstration of the 3D texp Method and Calderón’s Method on the ‘Heart and Lungs’ phantom T2-B, shown on left, using simulated electrode data. The 2D cross-sectional slices above show that the conductive heart is correctly visible in the x1×3 plane but absent from the x2×3 plane. Similarly for the lungs in the x2×3 plane vs the x1×3 plane.
Figure 2.
Figure 2.
The simulated targets considered in this manuscript.
Figure 3.
Figure 3.
The domains used for data simulation showing electrode locations and electrode numbering.
Figure 4.
Figure 4.
Comparison of reconstructed conductivity (Left) and Fourier data, F^, (Right) for T1 using Calderón’s method (equation (2.16)). Tz = 2.7 for the analytic data and Tz = 1.3 for all three simulated electrode data cases. The mollifying parameter is t = 0.1 for both analytic and simulated electrode data. The vertical dashed line indicates where the Fourier domain was truncated for the simulated electrode data cases.
Figure 5.
Figure 5.
Reconstructions of radially symmetric example T1 across algorithms using L = 128 electrodes shown in 3D and a representative x2×3 slice.
Figure 6.
Figure 6.
Comparison of conductivity and susceptivity reconstructions for the complex-valued heart and lungs target T2-A.
Figure 7.
Figure 7.
Comparison of reconstructions for the real-valued heart and lungs target T2-B using L = 128, 64, or 32 electrodes.
Figure 8.
Figure 8.
Comparison of reconstructions for the high contrast target T3 using L = 128, 64, or 32 electrodes.
Figure 9.
Figure 9.
Comparison of reconstructions for the real-valued heart and lungs target T2-B with increasing levels of noise added to the voltage data. Segmented 3D isosurface renderings are shown for each reconstruction as well as the x1×2 cross-sectional slice.
Figure 10.
Figure 10.
Comparison of reconstructions for the high contrast target T3 using various levels of noise. Segmented 3D isosurface renderings are shown for each reconstruction as well as the x1×2 cross-sectional slice.
Figure 11.
Figure 11.
Whole-image evaluation metrics for the real-valued heart and lungs target T2-B with decreasing numbers of simulated electrodes. Left: Dynamic Range, Middle: Mean Square Error, Right: Multi-Scale Structural Similarity Index.
Figure 12.
Figure 12.
Whole-image evaluation metrics for target T3 with decreasing numbers of simulated electrodes. Left: Dynamic Range, Middle: Mean Square Error, Right: Multi-Scale Structural Similarity Index
Figure 13.
Figure 13.
Whole-image evaluation metrics for the real-valued heart and lungs target T2-B with increasing levels of noise added to the voltage data. Left: Dynamic Range, Middle: Mean Square Error, Right: Multi-Scale Structural Similarity Index
Figure 14.
Figure 14.
Whole-image evaluation metrics for the target T3 with increasing levels of noise added to the voltage data. Left: Dynamic Range, Middle: Mean Square Error, Right: Multi-Scale Structural Similarity Index

References

    1. Adler A, Arnold JH, Bayford R, Borsic A, Brown B, Dixon P, Faes TJ, Frerichs I, Gagnon H, Gärber Y, and Grychtol B, Greit: a unified approach to 2d linear eit reconstruction of lung images, no. 6, S35–S55. - PubMed
    1. Alsaker M, Hamilton SJ, and Hauptmann A, A direct D-bar method for partial boundary data Electrical Impedance Tomography with a priori information, Inverse Problems and Imaging 11 (2017), no. 3, 427–454.
    1. Alessandrini G, Stable determination of conductivity by boundary measurements, Applicable Analysis 27 (1988), 153–172.
    1. Alsaker M and Mueller JL, A D-bar algorithm with a priori information for 2-D Electrical Impedance Tomography, SIAM J. on Imaging Sciences 9 (2016), no. 4, 1619–1654.
    1. Alsaker M and Mueller JL, EIT images of human inspiration and expiration using a D-bar method with spatial priors, Applied Computational Electromagnetics Society Journal 34 (2019), no. 2.

LinkOut - more resources