

Prognostic nomogram for Siewert type II adenocarcinoma of the esophagogastric junction patients with and without neoadjuvant radiotherapy: a retrospective cohort study
- PMID: 35173834
- PMCID: PMC8829609
Prognostic nomogram for Siewert type II adenocarcinoma of the esophagogastric junction patients with and without neoadjuvant radiotherapy: a retrospective cohort study
Abstract
Objective: To compare the prognostic factors of Siewert type II AEG patients who had received neoadjuvant radiotherapy (nRT) versus those who did not receive nRT. Nomograms for outcome prediction were constructed for the two treatment modalities.
Materials and methods: Data for 1,745 Siewert II type AEG patients who underwent radical surgery between 2010 and 2015 were retrieved from SEER (Surveillance, Epidemiology, and End Results) database. Patients were assigned to neoadjuvant radiotherapy (nRT) and non-neoadjuvant radiotherapy (non-nRT) groups based on treatment modality. Independent prognostic predictors were used to develop nomograms. Concordance index (C-index), receiver operating characteristic (ROC), calibration curves, and decision curve analyses (DCA) were used to determine the performance and prognostic value of the nomograms. The predictive accuracy of nomograms was compared with the prognostic value of the Tumor-Node-Metastasis (TNM) staging system.
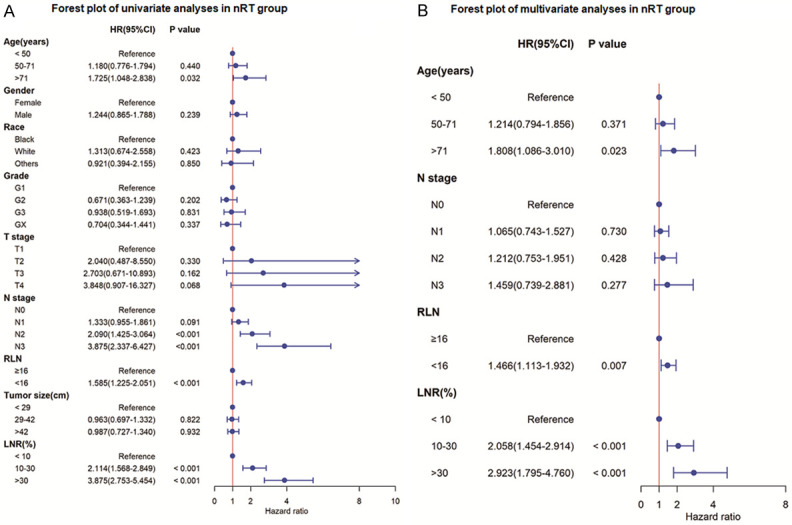
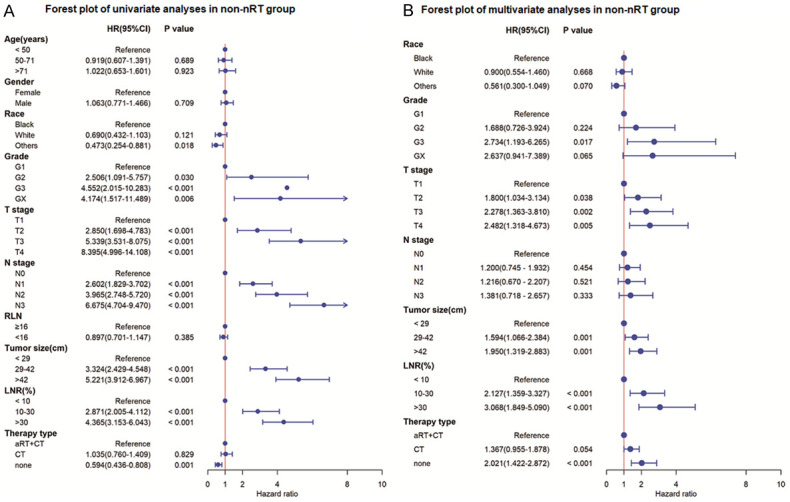
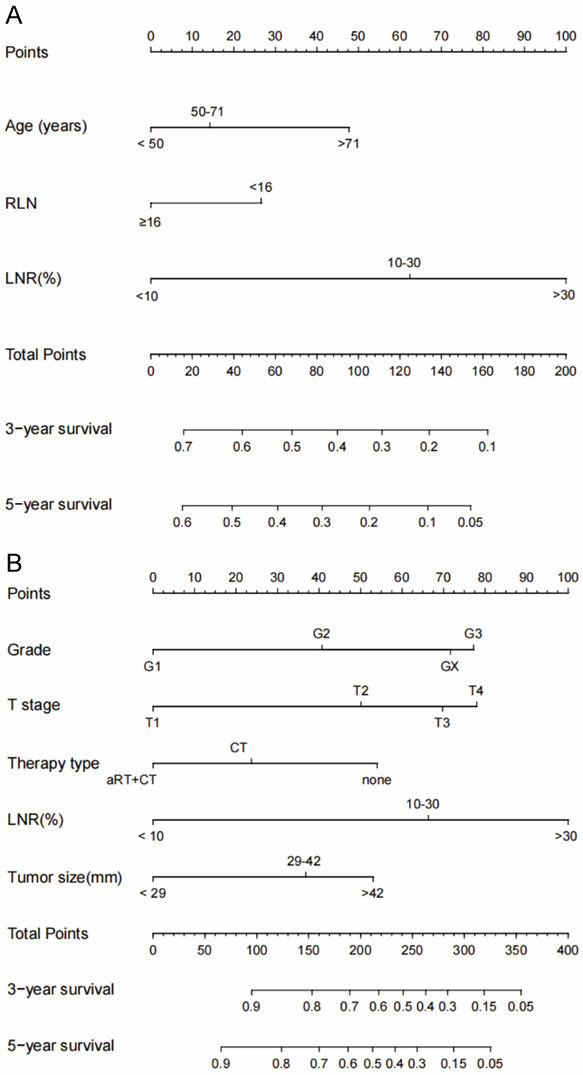
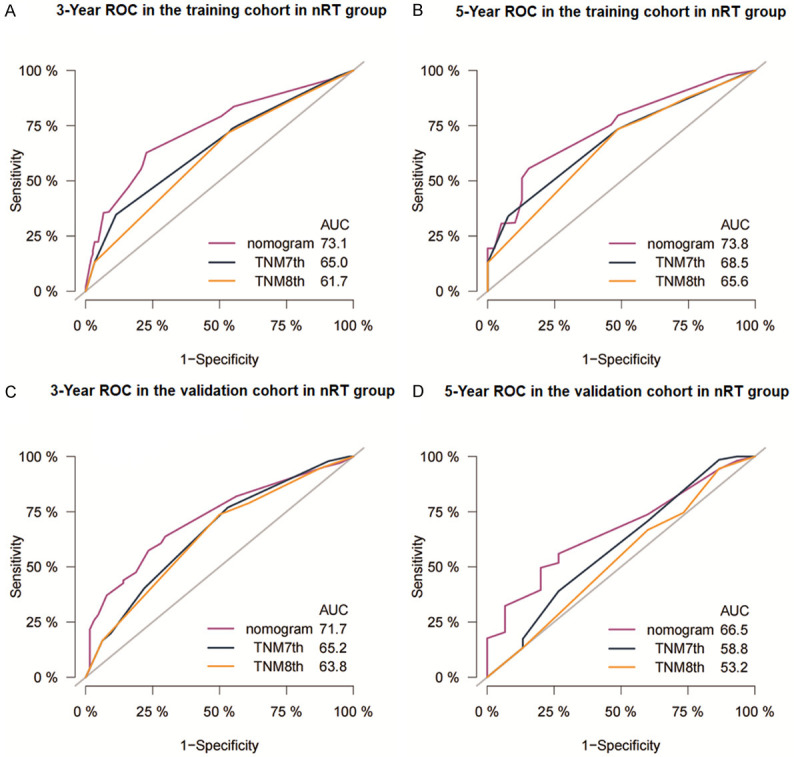
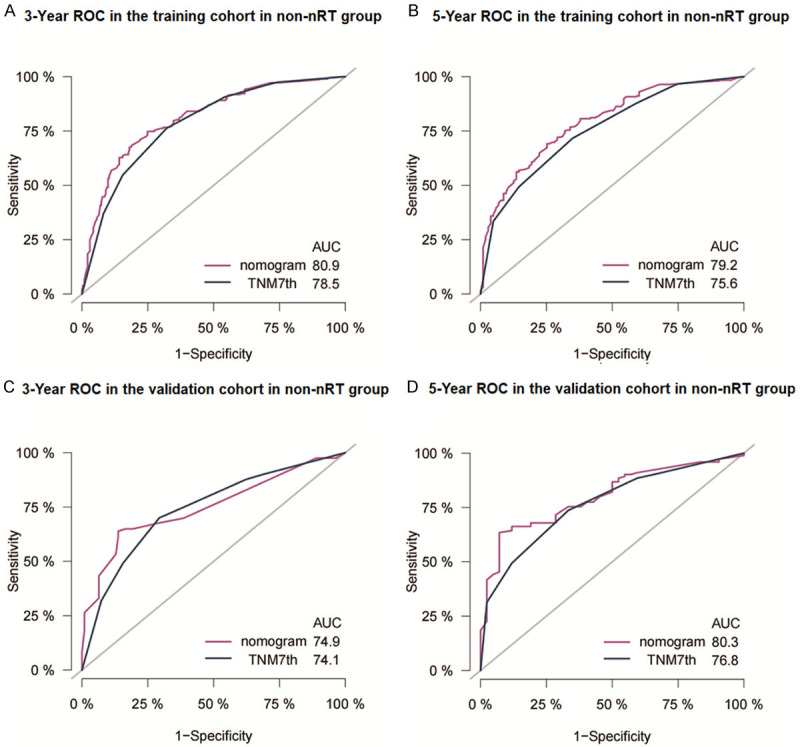
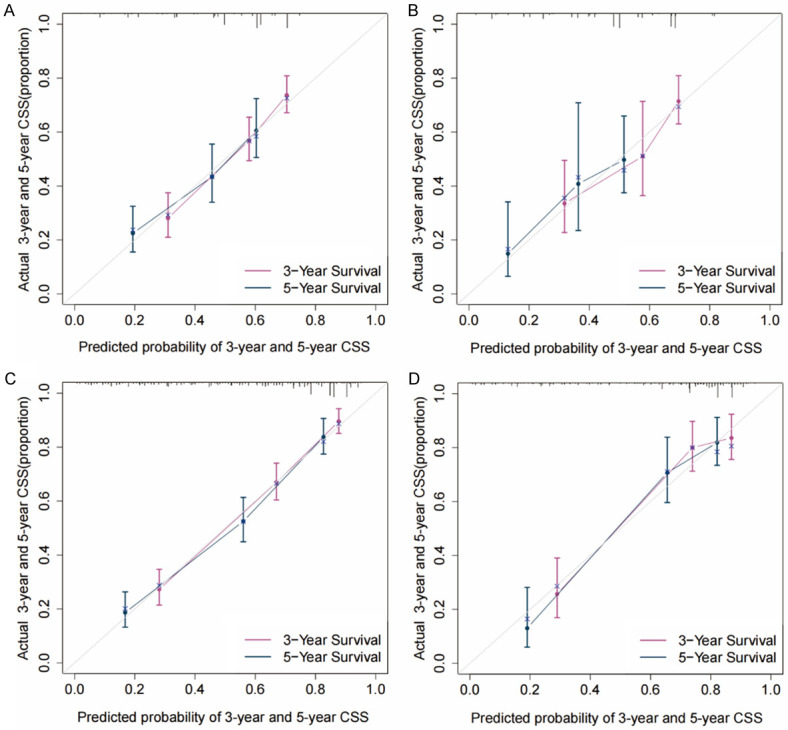
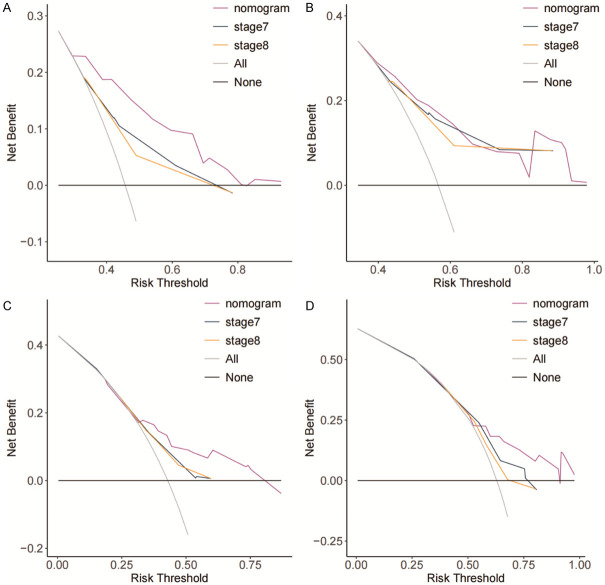
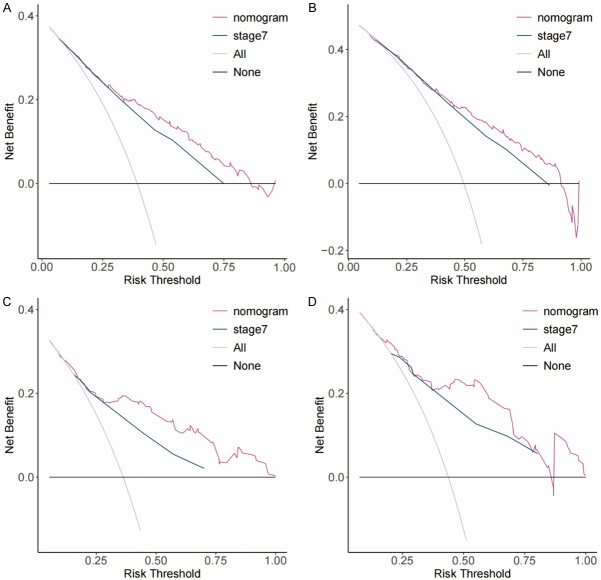
Results: The results showed that age, lymph node rate (LNR), and the number of removed lymph nodes (RLN) were independent prognostic factors for CSS in the nRT group. Tumor size, tumor grade, T stage, LNR, and therapy type were independent prognosis factors for CSS in patients in the non-nRT group. The C-indices for the nomograms were 0.652 (95% CI, 0.614-0.690) and 0.663 (95% CI, 0.606-0.720) in the training and validation cohort, respectively, for the nRT group. C-indices for the nomogram in non-nRT group were 0.754 (95% CI, 0.723-0.785) and 0.747 (95% CI, 0.688-0.800) for the training and validation cohorts, respectively. C-indices and ROC curves showed good predictive value compared with the TNM staging system in both groups. C-indices, as well as the AUC values of the nomograms and the TNM staging system for both cohorts in the non-nRT group were higher compared with those in the nRT group. Analysis of the survival calibration curve revealed high consistency between actual versus predicted outcomes determined by the nomograms. Decision curve analyses revealed that the new models had higher prediction value and clinical significance compared with TNM staging system.
Conclusion: The established nomograms showed high prognostic value for Siewert type II AEG patients in both nRT and non-nRT groups. In addition, the nomogram and the TNM staging systems showed better prognostic performance for patients in the non-nRT group compared with patients in the nRT group.
Keywords: Esophagogastric junction adenocarcinoma; SEER; cancer specific survival; neoadjuvant radiotherapy; nomogram; prognosis.
AJTR Copyright © 2022.
Conflict of interest statement
None.
Figures
Similar articles
-
Nomograms for Predicting Disease-Free Survival in Patients With Siewert Type II/III Adenocarcinoma of the Esophagogastric Junction Receiving Neoadjuvant Therapy and Radical Surgery.Front Oncol. 2022 Jun 8;12:908229. doi: 10.3389/fonc.2022.908229. eCollection 2022. Front Oncol. 2022. PMID: 35756688 Free PMC article.
-
Development and validation of a survival nomogram for patients with Siewert type II/III adenocarcinoma of the esophagogastric junction based on real-world data.BMC Cancer. 2021 May 10;21(1):532. doi: 10.1186/s12885-021-08249-x. BMC Cancer. 2021. PMID: 33971833 Free PMC article.
-
Development and validation of a nomogram for Siewert II esophagogastric junction adenocarcinoma: a retrospective analysis.Ther Adv Med Oncol. 2024 Feb 4;16:17588359241229425. doi: 10.1177/17588359241229425. eCollection 2024. Ther Adv Med Oncol. 2024. PMID: 38322753 Free PMC article.
-
Nomograms for prognosis prediction in esophageal adenocarcinoma: realities and challenges.Clin Transl Oncol. 2025 Feb;27(2):449-457. doi: 10.1007/s12094-024-03589-z. Epub 2024 Jul 31. Clin Transl Oncol. 2025. PMID: 39083141 Review.
-
Acute hematologic toxicity of radiation therapy - a comprehensive analysis and predictive nomogram.J Radiat Res. 2023 Nov 21;64(6):954-961. doi: 10.1093/jrr/rrad069. J Radiat Res. 2023. PMID: 37740569 Free PMC article. Review.
Cited by
-
A novel nomogram based on clinical blood indicators for prognosis prediction in curatively resected esophagogastric junction adenocarcinoma patients.J Cancer. 2023 May 21;14(9):1553-1561. doi: 10.7150/jca.83588. eCollection 2023. J Cancer. 2023. PMID: 37325058 Free PMC article.
-
Marital Status Is a Prognostic Factor for Cardiovascular Mortality but Not a Prognostic Factor for Cancer Mortality in Siewert Type II Adenocarcinoma of the Esophagogastric Junction.Gastroenterology Res. 2023 Dec;16(6):307-317. doi: 10.14740/gr1670. Epub 2023 Dec 9. Gastroenterology Res. 2023. PMID: 38186587 Free PMC article.
-
Development of a novel staging classification for Siewert II adenocarcinoma of the esophagogastric junction after neoadjuvant chemotherapy.World J Gastrointest Oncol. 2024 Jun 15;16(6):2541-2554. doi: 10.4251/wjgo.v16.i6.2541. World J Gastrointest Oncol. 2024. PMID: 38994140 Free PMC article.
References
-
- Steevens J, Botterweck AA, Dirx MJ, van den Brandt PA, Schouten LJ. Trends in incidence of oesophageal and stomach cancer subtypes in Europe. Eur J Gastroenterol Hepatol. 2010;22:669–678. - PubMed
-
- Siewert JR, Stein HJ. Classification of adenocarcinoma of the oesophagogastric junction. Br J Surg. 1998;85:1457–1459. - PubMed
-
- Giacopuzzi S, Bencivenga M, Weindelmayer J, Verlato G, de Manzoni G. Western strategy for EGJ carcinoma. Gastric Cancer. 2017;20:60–68. - PubMed
-
- Yoon HH, Gibson MK. Combined-modality therapy for esophageal and gastroesophageal junction cancers. Curr Oncol Rep. 2007;9:184–192. - PubMed
LinkOut - more resources
Full Text Sources