

Combination therapy with artemether and enalapril improves type 1 diabetic nephropathy through enhancing antioxidant defense
- PMID: 35173839
- PMCID: PMC8829612
Combination therapy with artemether and enalapril improves type 1 diabetic nephropathy through enhancing antioxidant defense
Abstract
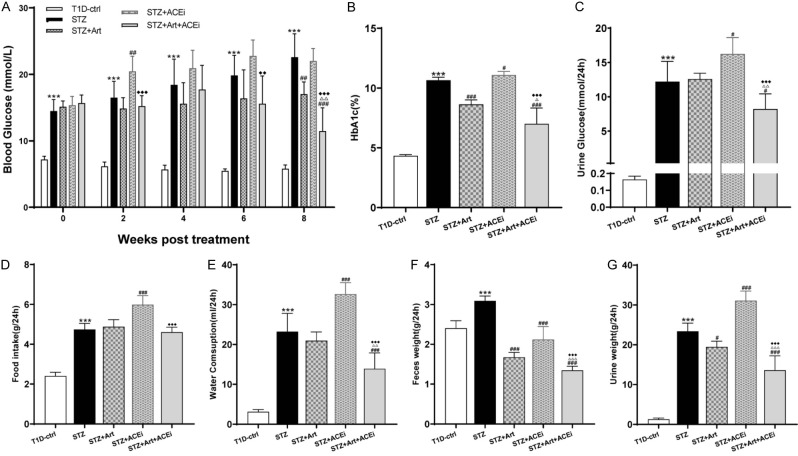
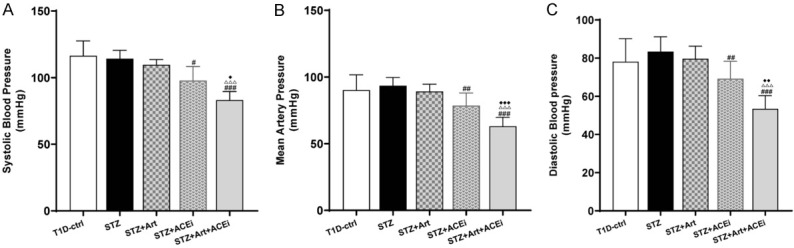
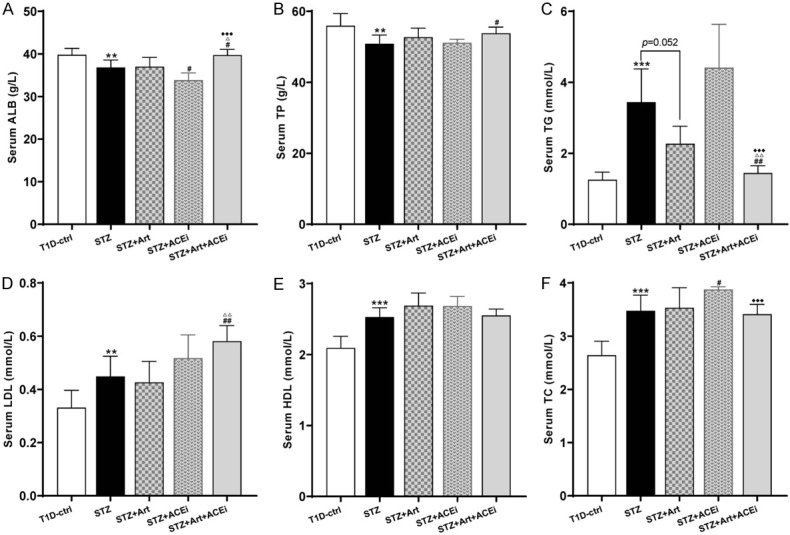
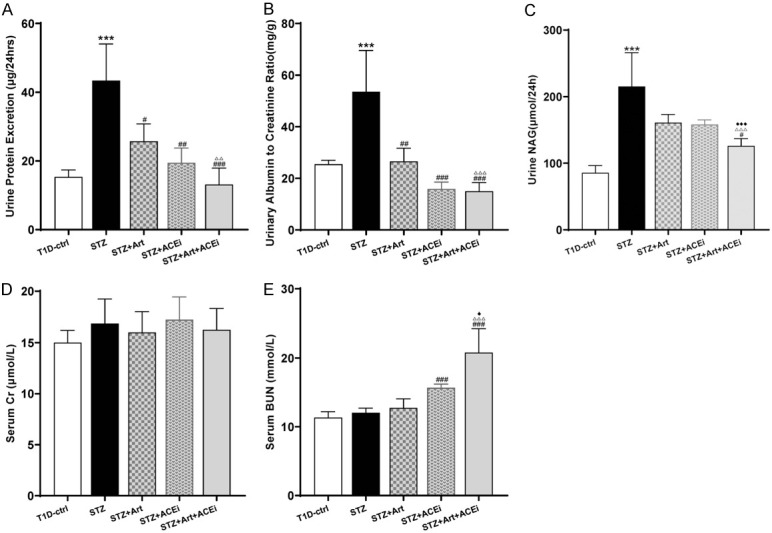
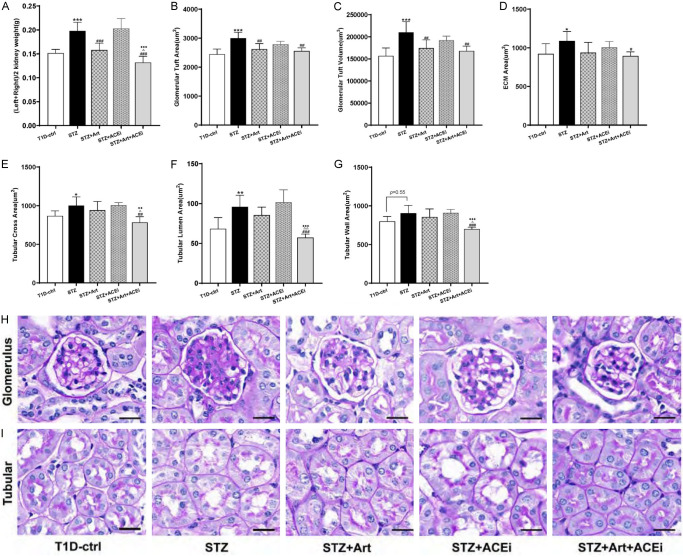
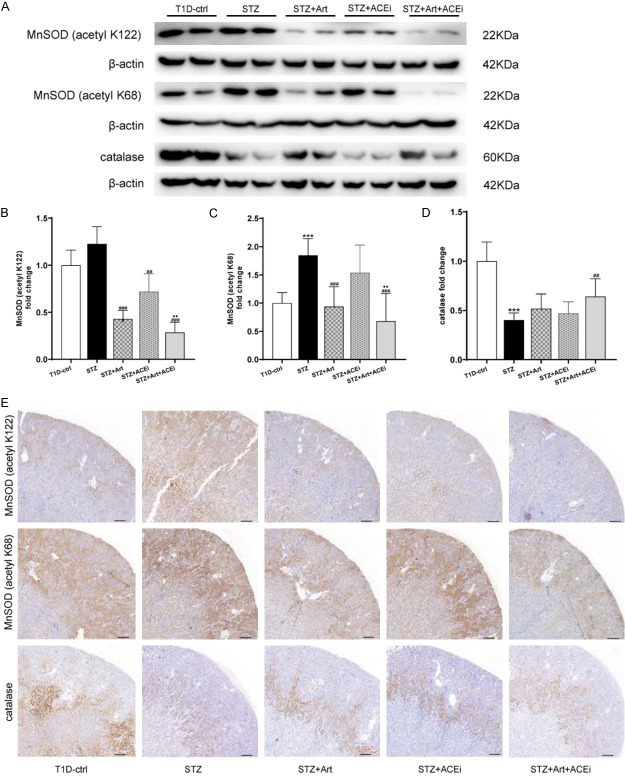
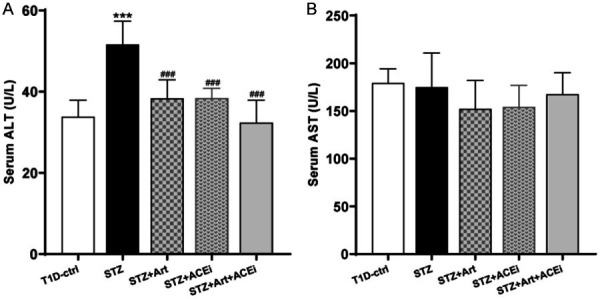
Previous studies have demonstrated that both artemether and enalapril are effective in treating diabetic nephropathy (DN). However, the effects and underlying mechanisms of their combination in treating DN remain unknown. The experimental DN model was induced by injecting streptozotocin (STZ) into male C57BL/6J mice. Mice were randomly allocated to the Type 1 diabetes control (T1D-ctrl), STZ, STZ + artemether (STZ + Art), STZ + enalapril (STZ + ACEi), or STZ + artemether + enalapril (STZ + Art + ACEi) group. The interventions lasted for 8 weeks. At the end of the experiment, related urine and serum biochemical values, such as urinary albumin excretion (UAE) and fasting blood glucose (FBG), were measured. In addition, blood pressure (BP) and kidney morphologic changes were also evaluated. The expression of oxidative stress related molecules, such as catalase, acetylated SOD2 (k68) and acetylated SOD2 (k122) in the kidney were measured. Results: combination therapy showed more pronounced effects in reducing UAE, FBG, and BP than any single drug. Typical diabetic kidney injuries, such as heavier kidney weight, and glomerular and tubular hypertrophy, were also further alleviated by combination therapy. Combination therapy also up-regulated the expression of catalase and down-regulated the expression of acetylated SOD2 (k68) and acetylated SOD2 (k122). Combination therapy with artemether and enalapril exhibited renoprotective effects in STZ-induced T1D mice superior to a single drug. The mechanism might be associated with their synergistic effects in enhancing antioxidant defense.
Keywords: ACEi; Diabetic nephropathy; artemether; combination; enalapril.
AJTR Copyright © 2022.
Conflict of interest statement
None.
Figures
Similar articles
-
Effects of enalapril and paricalcitol treatment on diabetic nephropathy and renal expressions of TNF-α, p53, caspase-3 and Bcl-2 in STZ-induced diabetic rats.PLoS One. 2019 Sep 17;14(9):e0214349. doi: 10.1371/journal.pone.0214349. eCollection 2019. PLoS One. 2019. PMID: 31527864 Free PMC article.
-
Superior renoprotective effects of the combination of breviscapine with enalapril and its mechanism in diabetic rats.Phytomedicine. 2013 Jul 15;20(10):820-7. doi: 10.1016/j.phymed.2013.03.027. Epub 2013 May 10. Phytomedicine. 2013. PMID: 23664882
-
Effect of Costus pictus per se and in combination with Metformin and Enalapril in streptozotocin induced diabetic nephropathy in rats.J Diabetes Metab Disord. 2022 Jul 18;21(2):1349-1358. doi: 10.1007/s40200-022-01065-5. eCollection 2022 Dec. J Diabetes Metab Disord. 2022. PMID: 36404856 Free PMC article.
-
Artemether attenuates renal tubular injury by regulating iron metabolism in mice with streptozotocin-induced diabetes.Am J Transl Res. 2022 Sep 15;14(9):6095-6106. eCollection 2022. Am J Transl Res. 2022. PMID: 36247243 Free PMC article.
-
Combination of astragaloside IV and ACEi ameliorates renal injuries in db/db mice.Int J Clin Exp Pathol. 2020 May 1;13(5):827-836. eCollection 2020. Int J Clin Exp Pathol. 2020. PMID: 32509053 Free PMC article.
Cited by
-
Therapeutic potential of artemisinin and its derivatives in managing kidney diseases.Front Pharmacol. 2023 Feb 15;14:1097206. doi: 10.3389/fphar.2023.1097206. eCollection 2023. Front Pharmacol. 2023. PMID: 36874000 Free PMC article. Review.
References
-
- Saeedi P, Petersohn I, Salpea P, Malanda B, Karuranga S, Unwin N, Colagiuri S, Guariguata L, Motala AA, Ogurtsova K, Shaw JE, Bright D, Williams R IDF Diabetes Atlas Committee. Global and regional diabetes prevalence estimates for 2019 and projections for 2030 and 2045: results from the International Diabetes Federation Diabetes Atlas, 9th edition. Diabetes Res Clin Pract. 2019;157:107843. - PubMed
-
- Macisaac RJ, Ekinci EI, Jerums G. Markers of and risk factors for the development and progression of diabetic kidney disease. Am J Kidney Dis. 2014;63(Suppl 2):S39–62. - PubMed
-
- Tuttle KR, Bakris GL, Bilous RW, Chiang JL, de Boer IH, Goldstein-Fuchs J, Hirsch IB, Kalantar-Zadeh K, Narva AS, Navaneethan SD, Neumiller JJ, Patel UD, Ratner RE, Whaley-Connell AT, Molitch ME. Diabetic kidney disease: a report from an ADA consensus conference. Diabetes Care. 2014;37:2864–2883. - PMC - PubMed
-
- Forbes JM, Coughlan MT, Cooper ME. Oxidative stress as a major culprit in kidney disease in diabetes. Diabetes. 2008;57:1446–1454. - PubMed
-
- Kandhare AD, Mukherjee A, Bodhankar SL. Antioxidant for treatment of diabetic nephropathy: a systematic review and meta-analysis. Chem Biol Interact. 2017;278:212–221. - PubMed
LinkOut - more resources
Full Text Sources
Molecular Biology Databases