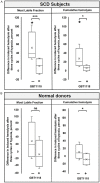
GBT1118, a voxelotor analog, protects red blood cells from damage during severe hypoxia
- PMID: 35173841
- PMCID: PMC8829590
GBT1118, a voxelotor analog, protects red blood cells from damage during severe hypoxia
Abstract
A lack of objective metrics in Sickle Cell Disease (SCD) makes it difficult to assess individual patient therapy options or assess the effects of therapy. This is further complicated by mechanisms of action involving multiple interconnected effects, that combine to relieve SCD symptoms. In 2019, based on the increase in hemoglobin concentration observed in the HOPE trial, the Food and Drug Administration approved voxelotor (Oxbryta®, Global Blood Therapeutics) for SCD patients 12 years and older. The main mechanism of action for voxelotor was increased hemoglobin-oxygen affinity, but other mechanisms may apply. In this study, we assessed the effect of GBT1118, an Oxbryta analog, on hypoxia-induced lethal and sub-hemolytic red blood cell (RBC) membrane damage using RBC Mechanical Fragility (MF), a metric of existing membrane damage and prospective hemolysis. RBC MF was measured non-invasively using a proprietary system comprising an electromagnetic bead mill and fiberoptic spectrophotometry detection. Three cycles of severe hypoxia (<5% oxygenated hemoglobin) with follow-up reoxygenation resulted in a significant increase in RBC MF for all SCD (Hb-S >60%) samples. Supplementation with GBT1118 caused no significant changes in pre-hypoxia RBC MF. However, following GBT1118 treatment, cell stability showed significantly less degradation, as evidenced by a significantly smaller RBC MF increase after three cycles of hypoxia-reoxygenation. These findings indicate that GBT1118 prevents hypoxia-induced membrane damage in sickled RBC, in part by alternative mechanisms not associated with induced changes in hemoglobin-oxygen affinity.
Keywords: Sickle cell disease; erythrocyte; hypoxia; mechanical fragility; polymerization; voxelotor.
AJTR Copyright © 2022.
Conflict of interest statement
M. Ferranti, A. Herppich are employees, and P. Hines and M. Tarasev are employees and shareholders of Functional Fluidics Incorporated, a company developing and commercializing assays for blood cell assessment. Financial support was received from Global Blood Therapeutics Incorporated for the completion of the study. Global Blood Therapeutics Incorporated did not participate in the conductance of the study, data analysis or interpretation of the experimental study results.
Figures


Similar articles
-
Rheological Impact of GBT1118 Cessation in a Sickle Mouse Model.Front Physiol. 2021 Sep 24;12:742784. doi: 10.3389/fphys.2021.742784. eCollection 2021. Front Physiol. 2021. PMID: 34630162 Free PMC article.
-
The effect of the antisickling compound GBT1118 on the permeability of red blood cells from patients with sickle cell anemia.Physiol Rep. 2019 Mar;7(6):e14027. doi: 10.14814/phy2.14027. Physiol Rep. 2019. PMID: 30916477 Free PMC article.
-
Increased hemoglobin affinity for oxygen with GBT1118 improves hypoxia tolerance in sickle cell mice.Am J Physiol Heart Circ Physiol. 2021 Aug 1;321(2):H400-H411. doi: 10.1152/ajpheart.00048.2021. Epub 2021 Jul 2. Am J Physiol Heart Circ Physiol. 2021. PMID: 34213392 Free PMC article.
-
Systematic Review of Voxelotor: A First-in-Class Sickle Hemoglobin Polymerization Inhibitor for Management of Sickle Cell Disease.Pharmacotherapy. 2020 Jun;40(6):525-534. doi: 10.1002/phar.2405. Epub 2020 May 19. Pharmacotherapy. 2020. PMID: 32343424
-
Voxelotor for the treatment of sickle cell disease.Expert Rev Hematol. 2021 Mar;14(3):253-262. doi: 10.1080/17474086.2021.1893688. Epub 2021 Mar 4. Expert Rev Hematol. 2021. PMID: 33602029 Review.
Cited by
-
Resveratrol, a New Allosteric Effector of Hemoglobin, Enhances Oxygen Supply Efficiency and Improves Adaption to Acute Severe Hypoxia.Molecules. 2023 Feb 22;28(5):2050. doi: 10.3390/molecules28052050. Molecules. 2023. PMID: 36903296 Free PMC article.
-
Effects of GBT1118, a voxelotor analog, on bone disease in sickle cell disease mice.Sci Rep. 2024 Sep 27;14(1):22330. doi: 10.1038/s41598-024-69589-9. Sci Rep. 2024. PMID: 39333172 Free PMC article.
-
Metabolite and protein shifts in mature erythrocyte under hypoxia.iScience. 2024 Feb 23;27(4):109315. doi: 10.1016/j.isci.2024.109315. eCollection 2024 Apr 19. iScience. 2024. PMID: 38487547 Free PMC article. Review.
-
Newer Modalities and Updates in the Management of Sickle Cell Disease: A Systematic Review.J Blood Med. 2024 Sep 12;15:435-447. doi: 10.2147/JBM.S477507. eCollection 2024. J Blood Med. 2024. PMID: 39286637 Free PMC article. Review.
References
-
- Steinberg MH. Predicting clinical severity in sickle cell anaemia. Br J Haematol. 2005;129:465–481. - PubMed
-
- Alli NA, Patel M, Alli HD, Bassa F, Coetzee MJ, Davidson A, Essop MR, Lakha A, Louw VJ, Novitzky N, Philip V, Poole JE, Wainwright RD. Recommendations for the management of sickle cell disease in South Africa. S Afr Med J. 2014;104:743–751. - PubMed
-
- Kuypers FA. Red cell membrane lipids in hemoglobinopathies. Curr Mol Med. 2008;8:633–638. - PubMed
LinkOut - more resources
Full Text Sources
