. 2022 Jan 15;14(1):554-571.
eCollection 2022.

Repair phase modeling of ischemic acute kidney injury: recovery vs. transition to chronic kidney disease

Affiliations

Repair phase modeling of ischemic acute kidney injury: recovery vs. transition to chronic kidney disease

Kyungho Lee et al. Am J Transl Res. .

Abstract

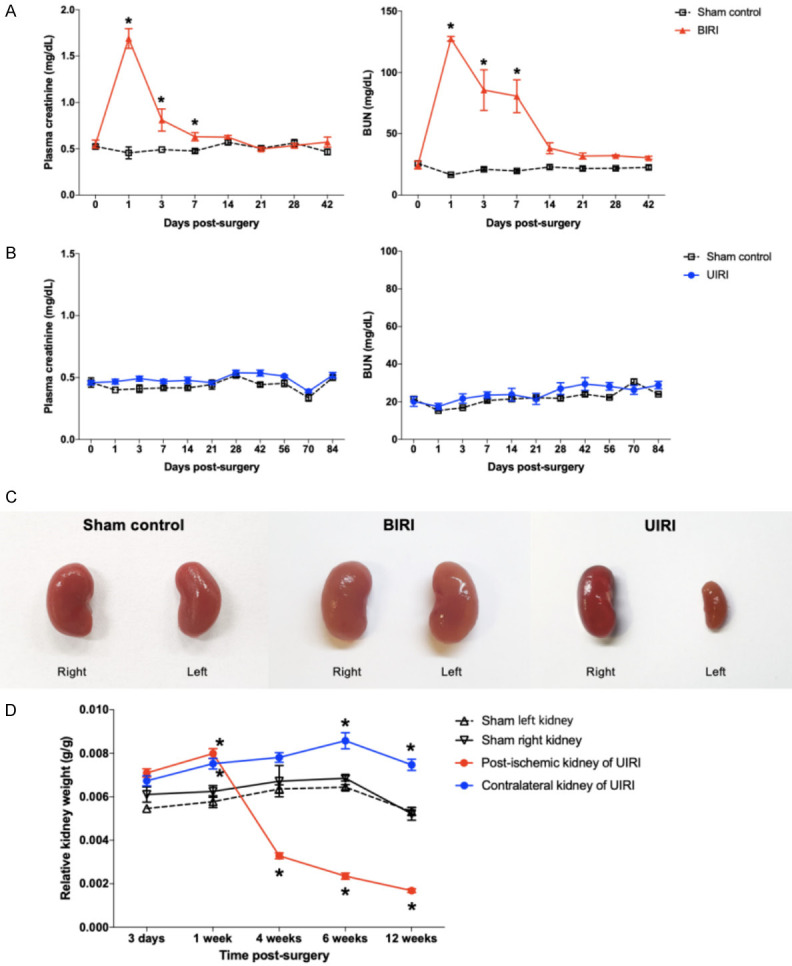
The repair mechanism after ischemic acute kidney injury (AKI) involves complex immunologic processes, which determine long-term renal outcomes. Through investigating two murine ischemia-reperfusion injury (IRI) models: bilateral IRI (BIRI) and unilateral IRI (UIRI), we aimed to determine an appropriate murine model that could simulate the recovery phase of ischemic AKI. Changes in renal function, phenotypes of kidney mononuclear cells, renal fibrosis, and intrarenal cytokine/chemokine expression were serially analyzed up to 12 weeks after IRI. Plasma creatinine and BUN concentrations increased and remained elevated in the BIRI group until 7 days but decreased to comparable levels with the sham control group at 2 weeks after surgery and thereafter, whereas plasma creatinine and BUN concentrations remained unchanged in the UIRI group. Intrarenal total leukocytes, and effector memory and activated phenotypes of CD4 and CD8 T cells markedly increased in the postischemic kidneys in both IRI groups. Expression of proinflammatory cytokines/chemokines and TGF-β1 was enhanced in the postischemic kidneys of both IRI groups with a higher degree in the UIRI group. Importantly, intrarenal immunologic changes of the BIRI group persisted until 6 weeks despite full functional recovery. The postischemic kidneys of the UIRI group showed earlier and more pronounced proinflammatory conditions as well as more severe atrophic and fibrotic changes compared to the BIRI group. These findings support the utility of longer follow-ups of BIRI and UIRI models for investigating the adaptive repair process, which facilitates recovery of ischemic AKI and maladaptive repair process may result in AKI to CKD transition, respectively.

Keywords: Ischemic acute kidney injury; chronic kidney disease; ischemia-reperfusion injury; recovery; repair.


Conflict of interest statement

None.

Figures

Figure 1
Figure 1
Serial follow-ups of renal function and kidney weights following IRI. A. Plasma creatinine and BUN concentrations of the BIRI group were elevated after IRI and significantly higher than those of the control group until 7 days. B. Plasma creatinine and BUN concentrations of the UIRI group were comparable with those of the control group during the whole follow-up period. *P<0.05, compared with the control group (n=5-8 in each group). C. Representative gross kidney findings at 6 weeks after IRI. The postischemic kidney of the UIRI group (left kidney) showed significant atrophic change. D. The weights of the postischemic kidneys (left) in the UIRI group were significantly reduced during the recovery phase and lower than those of the control group and the contralateral kidneys from 4 weeks after IRI. Kidney weights were corrected for body weight. *P<0.05, compared with the left kidney of the control group for the postischemic (left) kidney and the right kidney of the control for the contralateral (right) kidney of the UIRI group (n=4-8 in each group). Statistical analysis was performed using the Mann-Whitney U-test. BIRI, bilateral ischemia-reperfusion injury; BUN, blood urea nitrogen; IRI, ischemia-reperfusion injury; UIRI, unilateral ischemia-reperfusion injury.
Figure 2
Figure 2
Structural renal injury following IRI. (A, B) Representative H&E staining findings of the postischemic kidneys at 4 weeks (A) and 6 weeks (B) after IRI. The postischemic kidneys of both IRI groups showed tubular damage, tubular atrophy, and inflammatory cell infiltration (×100).
Figure 3
Figure 3
Quantitative analyses of structural renal injury in renal cortex and outer medulla. (A, B) Comparison of proportions of damaged tubules, atrophic tubules, and intact tubules for each group in renal cortex (A) and outer medulla (B). Tubular damage and atrophic changes were significant in both IRI groups. The proportions of damaged tubules and atrophic tubules in the renal cortex and outer medulla were significantly higher in the UIRI group than those of the BIRI group at each time point. A total of 10 magnified fields (×200) were scored for each mouse by a pathologist blinded to the groups. Data are from four independent experiments. The boxplots display the IQR and median (+, mean). Whiskers describe minimum to maximum range. *P<0.05 (n=5-8 in each group). Statistical analysis was performed using the Mann-Whitney U test. BIRI, bilateral ischemia-reperfusion injury; IRI, ischemia-reperfusion injury; UIRI, unilateral ischemia-reperfusion injury; IQR, interquartile range.
Figure 4
Figure 4
Renal fibrosis following IRI. A, B. Representative images of Masson’s trichrome staining at 4 and 6 weeks after IRI. The postischemic kidneys of both IRI models showed interstitial fibrosis (Masson’s trichrome-stained slides showing fibrosis with blue color, ×100). C. Calculated areas of fibrosis for each group. The area of blue collagen fibers was quantified using software analyses of processed images of Masson’s trichrome staining. Both IRI groups showed significant fibrotic changes compared to the control group at each time point. Fibrotic area for the UIRI group showed an increasing trend until 6 weeks after IRI and was significantly greater than for the BIRI group at 1, 4, and 6 weeks. The boxplots display the IQR and median (+, mean). Whiskers describe minimum to maximum range. *P<0.05, between two groups at each time point; †P<0.05, compared with 1 week in the same group (n=5-7 in each group). Statistical analysis was performed using the Mann-Whitney U-test. BIRI, bilateral ischemia-reperfusion injury; IRI, ischemia-reperfusion injury; UIRI, unilateral ischemia-reperfusion injury; IQR, interquartile range.
Figure 5
Figure 5
Intrarenal leukocytes trafficked into the postischemic kidneys. A, B. Representative immunohistochemistry findings and semiquantitative analyses of CD45-positive leukocytes with tissue FAXS in the postischemic kidneys at 4 and 6 weeks after IRI. Arrows indicate CD45-positive leukocytes (×200). C. Semiquantitative analysis of CD45-positive leukocytes using an automated imaging analysis system (TissueFAXS). The whole fields of slides including both the cortex and medulla were calculated. The proportions of total leukocytes expressing CD45 among total nucleated cells were higher in both IRI groups than in the control group at each time point. The UIRI group showed a greater increase compared to the BIRI group at 4 and 6 weeks after IRI. Data are from four independent experiments. *P<0.05, between the groups at each time point; †P<0.05, compared with 1 week in the same group (n=6-10 in each group). Statistical analysis was performed using the Mann-Whitney U-test. BIRI, bilateral ischemia-reperfusion injury; CD, cluster of differentiation; IRI, ischemia-reperfusion injury; UIRI, unilateral ischemia-reperfusion injury.
Figure 6
Figure 6
Flow cytometry analyses of KMNCs isolated from postischemic kidneys. A. Changes in subpopulations of KMNCs according to the IRI models. The proportion of total T cells among total lymphocytes increased in both IRI groups. The UIRI group showed relatively reduced infiltration of total B cells and facilitated infiltration of neutrophils. B. Representative flow plots showing T cells, B cells, and neutrophils at 6 weeks after IRI. *P<0.05, compared with the control group; †P<0.05, compared with the BIRI group (n=7-8 in each group). Statistical analyses were performed using ANOVA followed by Tukey’s post-hoc analysis. BIRI, bilateral ischemia-reperfusion injury; KMNCs, kidney-infiltrating mononuclear cells; IRI, ischemia-reperfusion injury; UIRI, unilateral ischemia-reperfusion injury.
Figure 7
Figure 7
Flow cytometry analyses of postischemic kidney T cell subpopulations. A. Changes in intrarenal T cell subpopulations according to the IRI models. Effector memory CD4 and CD8 T cells, activated CD4 and CD8 T cells, and regulatory T cells markedly increased in the postischemic kidneys in both IRI groups. B. Representative flow plots showing CD4 and CD8 T cells, activated and effector memory subsets of CD4 and CD8 T cells, and regulatory T cells at 6 weeks after IRI. *P<0.05, compared with the control group; †P<0.05, compared with the BIRI group (n=7-8 in each group). Statistical analyses were performed using ANOVA followed by Tukey’s post-hoc analysis. BIRI, bilateral ischemia-reperfusion injury; KMNCs, kidney-infiltrating mononuclear cells; IRI, ischemia-reperfusion injury; UIRI, unilateral ischemia-reperfusion injury.
Figure 8
Figure 8
Expressions of intrarenal cytokines/chemokines and TGF-β1 following IRI. A. The expression of MCP-1, RANTES, TNF-α, and IL-6 were significantly higher in the UIRI group than those in the control and BIRI groups. The expression of VEGF was lower in the UIRI group than that in the control and BIRI groups. *P<0.05 (n=5-8 in each group). Statistical analyses were performed using ANOVA followed by Tukey’s post-hoc analysis. B. The expression of TGF-β1 was significantly higher in the UIRI group than in the control and BIRI groups (n=5-10 in each group). Statistical analyses were performed using ANOVA followed by Tukey’s post-hoc analysis. BIRI, bilateral ischemia-reperfusion injury; IRI, ischemia-reperfusion injury; MCP-1, monocyte chemoattractant protein-1; RANTES, regulated on activation, normal T cell expressed and secreted (CCL5); UIRI, unilateral ischemia-reperfusion injury; TGF-β1, transforming growth factor-β1.

Similar articles

Cited by

References

    1. Palevsky PM, Zhang JH, O’Connor TZ, Chertow GM, Crowley ST, Choudhury D, Finkel K, Kellum JA, Paganini E, Schein RM, Smith MW, Swanson KM, Thompson BT, Vijayan A, Watnick S, Star RA, Peduzzi P. Intensity of renal support in critically ill patients with acute kidney injury. N Engl J Med. 2008;359:7–20. - PMC - PubMed
    1. Kurzhagen JT, Dellepiane S, Cantaluppi V, Rabb H. AKI: an increasingly recognized risk factor for CKD development and progression. J Nephrol. 2020;33:1171–1187. - PubMed
    1. Ishani A, Xue JL, Himmelfarb J, Eggers PW, Kimmel PL, Molitoris BA, Collins AJ. Acute kidney injury increases risk of ESRD among elderly. J Am Soc Nephrol. 2009;20:223–228. - PMC - PubMed
    1. Yang L, Besschetnova TY, Brooks CR, Shah JV, Bonventre JV. Epithelial cell cycle arrest in G2/M mediates kidney fibrosis after injury. Nat Med. 2010;16:535–543. - PMC - PubMed
    1. Kumar S. Cellular and molecular pathways of renal repair after acute kidney injury. Kidney Int. 2018;93:27–40. - PubMed

LinkOut - more resources