. 2022 Jan 31:9:798319.
doi: 10.3389/fcell.2021.798319. eCollection 2021.

Pan-Cancer Study on Protein Kinase C Family as a Potential Biomarker for the Tumors Immune Landscape and the Response to Immunotherapy

Affiliations

Pan-Cancer Study on Protein Kinase C Family as a Potential Biomarker for the Tumors Immune Landscape and the Response to Immunotherapy

Alaa Abdelatty et al. Front Cell Dev Biol. .

Abstract

The protein kinase C (PKC) family has been described with its role in some cancers, either as a promoter or suppressor. PKC signaling also regulates a molecular switch between transactivation and transrepression activity of the peroxisome proliferator-activated receptor alpha (PPARalpha). However, the role of different PKC enzymes in tumor immunity remains poorly defined. This study aims to investigate the correlation between PKC genes and tumor immunity, in addition to studying the probability of their use as predictive biomarkers for tumor immunity and immunotherapeutic response. The ssGSEA and the ESTIMATE methods were used to assess 28 tumor-infiltrating lymphocytes (TILs) and the immune component of each cancer, then correlated with PKC levels. Prediction of PKC levels-dependent immunotherapeutic response was based on human leukocytic antigen (HLA) gene enrichment scores and programmed cell death 1 ligand (PD-L1) expression. Univariate and multivariate Cox analysis was performed to evaluate the prognostic role of PKC genes in cancers. Methylation level and CNAs could drive the expression levels of some PKC members, especially PRKCI, whose CNGs are predicted to elevate their level in many cancer types. The most crucial finding in this study was that PKC isoenzymes are robust biomarkers for the tumor immune status, PRKCB, PRKCH, and PRKCQ as stimulators, while PRKCI and PRKCZ as inhibitors in most cancers. Also, PKC family gene levels can be used as predictors for the response to immunotherapies, especially HLAs dependent and PD-L1 blockade-dependent ones. In addition to its prognostic function, all PKC family enzymes are promising tumor immunity biomarkers and can help select suitable immune therapy in different cancers.

Keywords: biomarker; immunotherapy; pan-cancer study; protein kinase C; tumors immune landscape.


Conflict of interest statement

The authors declare that the research was conducted in the absence of any commercial or financial relationships that could be construed as a potential conflict of interest.

Figures
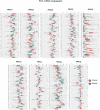
FIGURE 1
FIGURE 1
Pan-cancer analysis of PKC mRNA levels between Cancer and Normal in TCGA cancers. *: p-value < 0.05; **: p-value < 0.01; ***: p-value < 0.001.
FIGURE 2
FIGURE 2
Pan-cancer analysis of PKC genes methylation levels between Cancer and Normal tissues. *: p-value < 0.05; **: p-value < 0.01; ***: p-value < 0.001.
FIGURE 3
FIGURE 3
Correlation heatmap between mRNA expression and methylation level of each PKC gene in all TCGA cancers, the color refers to correlation coefficients; the black border refers to the statistically significant correlation (p-value < 0.05).
FIGURE 4
FIGURE 4
The frequency of copy number alterations and the differences in CNAs-dependent mRNA expressions of each alteration type compared to the diploid copy-associated expression for each PKC gene in all various cancers PRKCA (A), PRKCB (B), PRKCD (C), PRKCE (D), PRKCG (E), PRKCH (F), PRKCI (G), PRKCQ (H), PRKCZ (I). The red color = high-level copy amplification, the orange color = low-level copy gains, the light color = diploid copies, the blue color = monoallelic loss. *: p-value < 0.05; **: p-value < 0.01; ***: p-value < 0.001.
FIGURE 5
FIGURE 5
Survival heatmap for OS (A), PFI (B) analysis comparing the HR of high expressing group versus low expressing group for all PKC genes in the TCGA tumors. The red color indicates HR for the high-expressing group; the blue color indicates the HR for the low-expressing group; the black border refers to the statistically log-rank test (p-value < 0.05).
FIGURE 6
FIGURE 6
KEGG pathways enrichment analysis of PKC significantly correlated genes in different cancers: PRKCA (A), PRKCB (B), PRKCD (C), PRKCE (D), PRKCG (E), PRKCH (F), PRKCI (G), PRKCQ (H), PRKCZ (I). The dot size refers to the number of enriched genes in the pathway, while the color refers to the adjusted p‐value.
FIGURE 7
FIGURE 7
Pan-cancer analysis for the significant correlation between PKC genes expressions and ssGSEA scores of 28 immune cell subpopulations; PRKCA (A), PRKCB (B), PRKCD (C), PRKCE (D), PRKCG (E), PRKCH (F), PRKCI (G), PRKCQ (H), PRKCZ (I). The dot size states the correlation coefficients, while the color refers to the direction of the correlation, blue = positive correlation, and red = negative correlation (p-value < 0.05).
FIGURE 8
FIGURE 8
Pan-cancer predictive analysis for the effect of PKC family on patient’s response to immunotherapies. (A) Correlation of PKC isoforms expressions and ssGSEA HLAs scores. (B) Correlation of PKC genes expressions and PD-L1 expression. The color refers to correlation coefficients, and the black border refers to the statistically significant correlation (p-value < 0.05).

References

    1. Aguiar P. N., Jr, De Mello R. A., Hall P., Tadokoro H., Lima Lopes G. d. (2017). PD-L1 Expression as a Predictive Biomarker in Advanced Non-small-cell Lung Cancer: Updated Survival Data. Immunotherapy 9 (6), 499–506. 10.2217/imt-2016-0150 - DOI - PubMed
    1. Anderson P., Aptsiauri N., Ruiz-Cabello F., Garrido F. (2021). HLA Class I Loss in Colorectal Cancer: Implications for Immune Escape and Immunotherapy. Cell Mol. Immunol., 1–10. 10.1038/s41423-021-00634-7 - DOI - PMC - PubMed
    1. Antal C. E., Hudson A. M., Kang E., Zanca C., Wirth C., Stephenson N. L., et al. (2015). Cancer-Associated Protein Kinase C Mutations Reveal Kinase's Role as Tumor Suppressor. Cell 160 (3), 489–502. 10.1016/j.cell.2015.01.001 - DOI - PMC - PubMed
    1. Araki K., Mikami T., Yoshida T., Kikuchi M., Sato Y., Oh-ishi M., et al. (2009). High Expression of HSP47 in Ulcerative Colitis-Associated Carcinomas: Proteomic Approach. Br. J. Cancer 101 (3), 492–497. 10.1038/sj.bjc.6605163 - DOI - PMC - PubMed
    1. Bae K.-M., Wang H., Jiang G., Chen M. G., Lu L., Xiao L. (2007). Protein Kinase Cε Is Overexpressed in Primary Human Non-small Cell Lung Cancers and Functionally Required for Proliferation of Non-small Cell Lung Cancer Cells in a p21/Cip1-dependent Manner. Cancer Res. 67 (13), 6053–6063. 10.1158/0008-5472.can-06-4037 - DOI - PubMed