. 2022 Jan 31:9:812422.
doi: 10.3389/fcell.2021.812422. eCollection 2021.

A Ferroptosis-Related Gene Prognostic Index to Predict Temozolomide Sensitivity and Immune Checkpoint Inhibitor Response for Glioma

Affiliations

A Ferroptosis-Related Gene Prognostic Index to Predict Temozolomide Sensitivity and Immune Checkpoint Inhibitor Response for Glioma

Yonghua Cai et al. Front Cell Dev Biol. .

Abstract

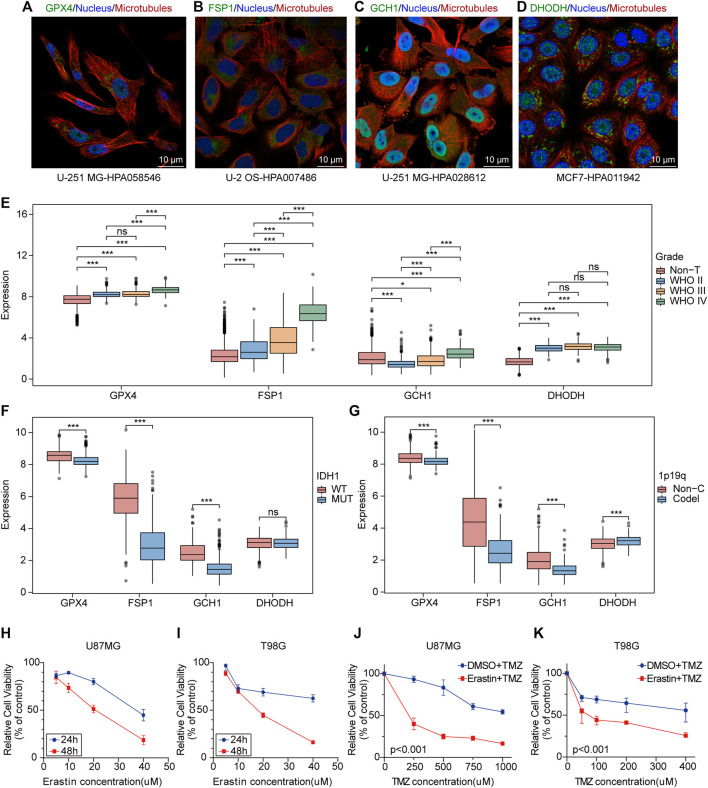
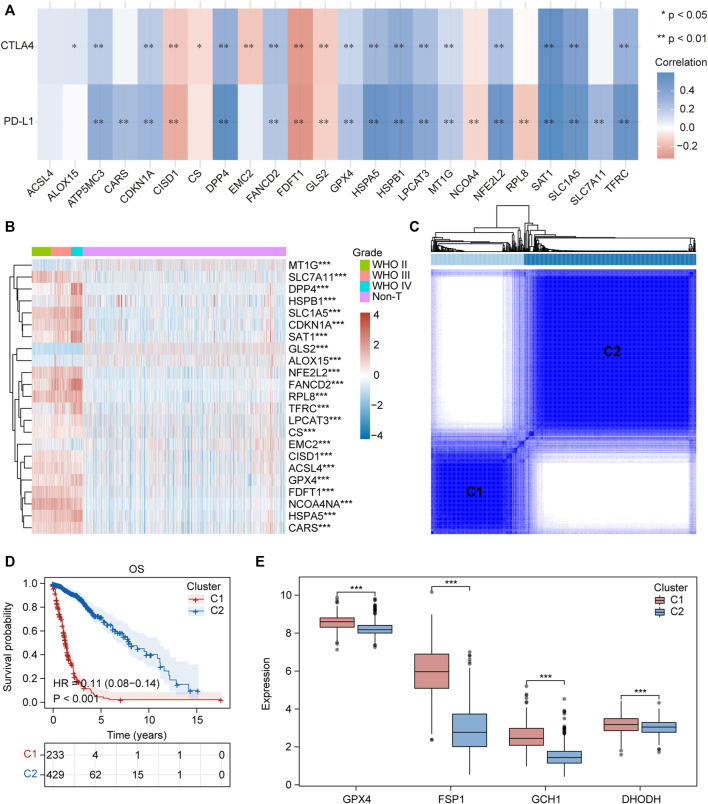
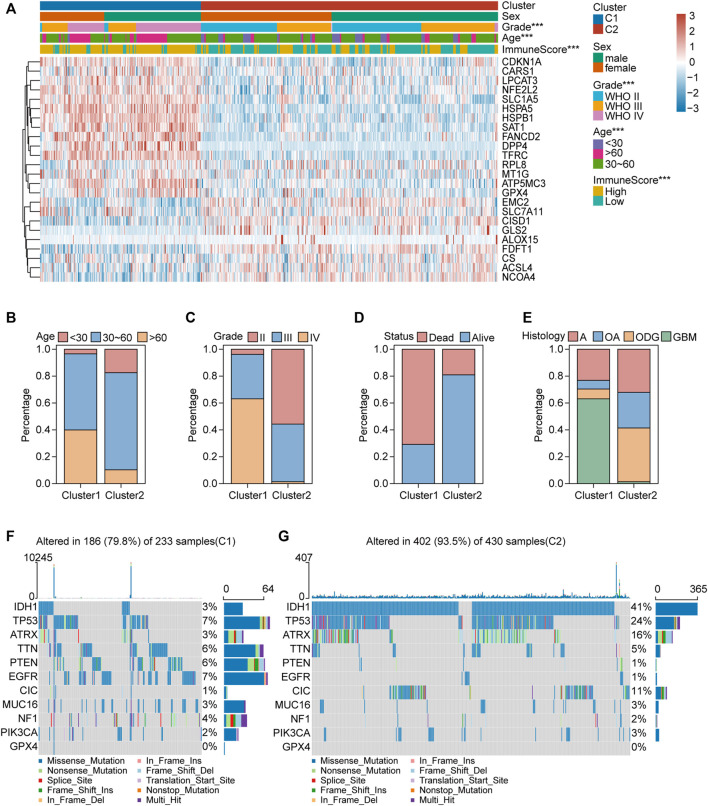
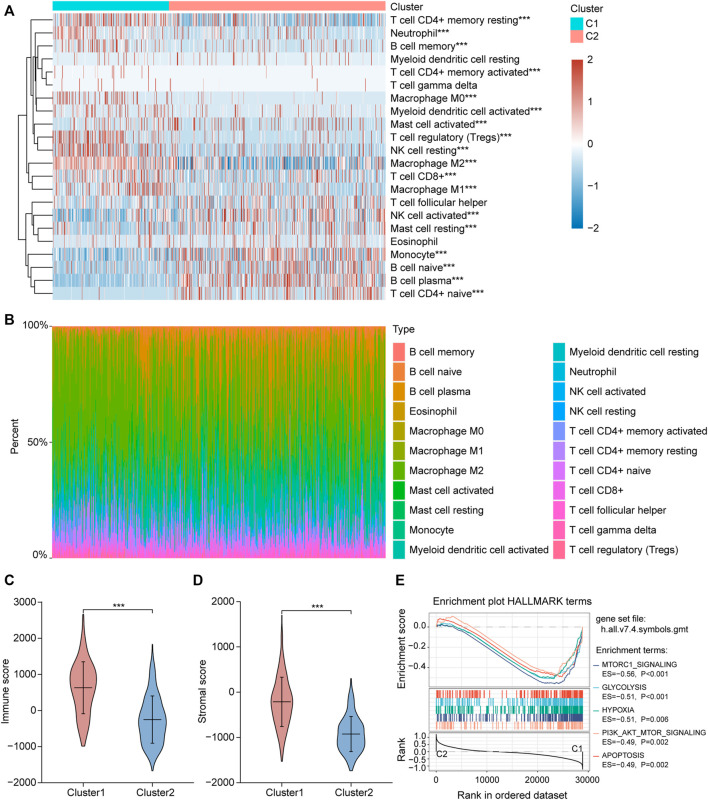
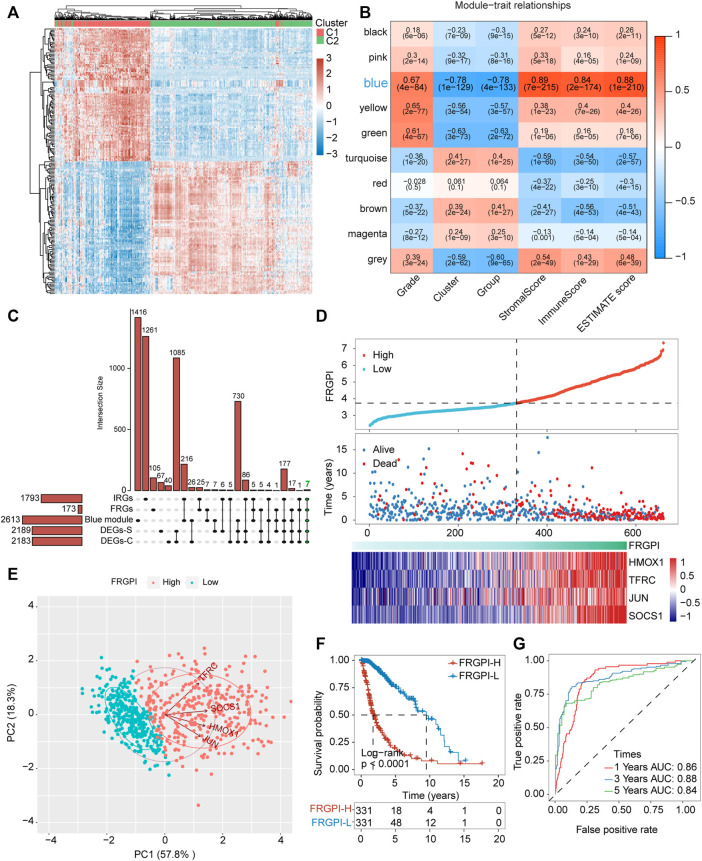
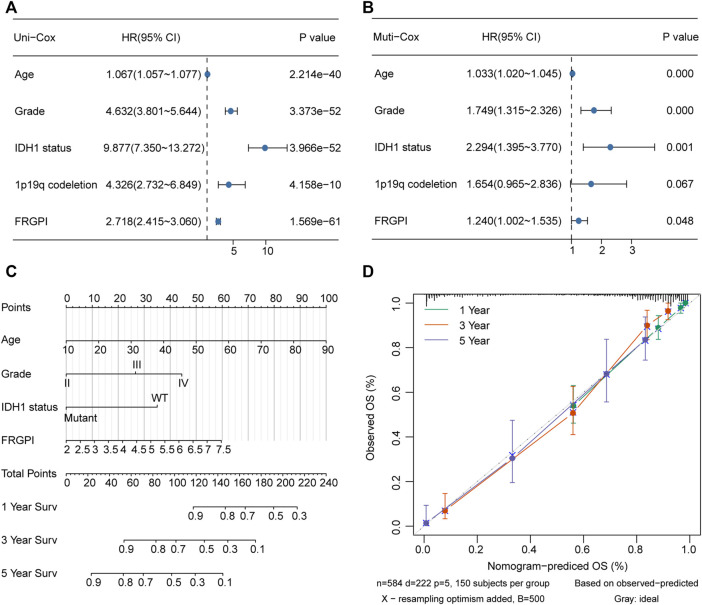
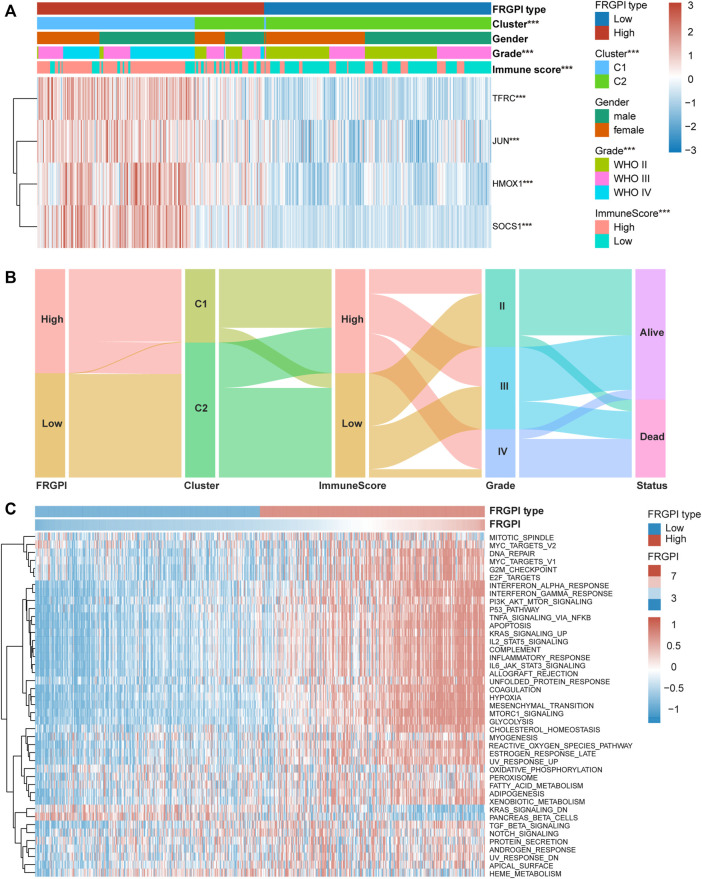
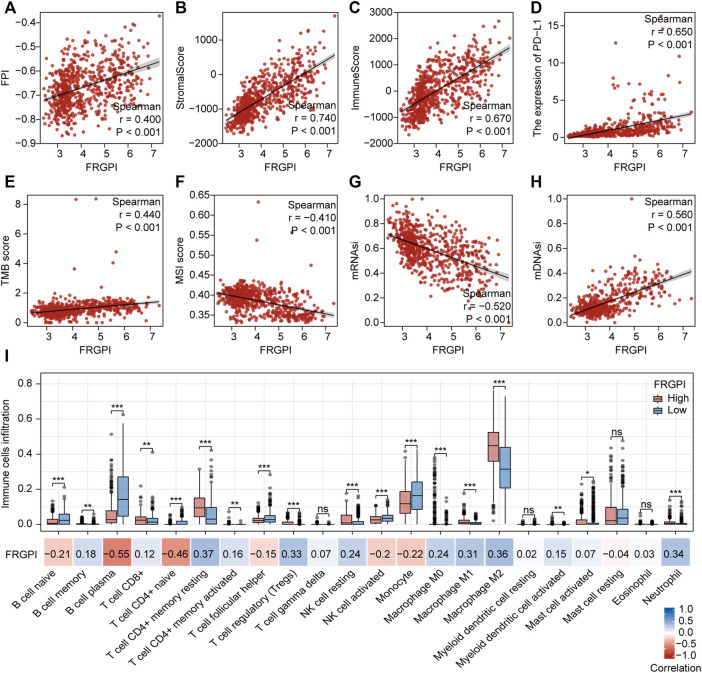
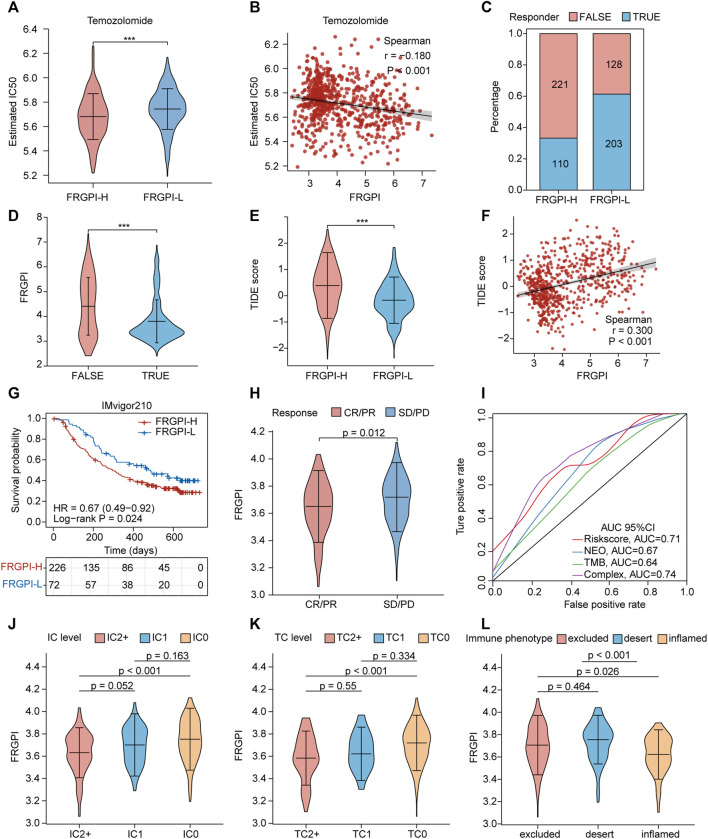
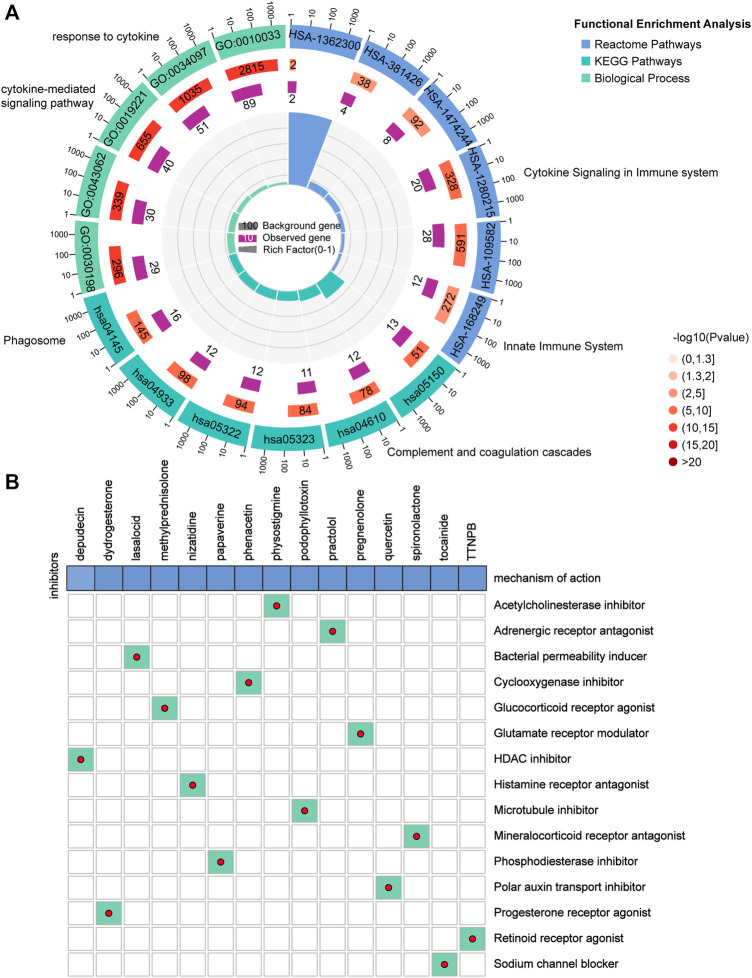
Background: Gliomas are highly lethal brain tumors. Despite multimodality therapy with surgery, radiotherapy, chemotherapy, and immunotherapy, glioma prognosis remains poor. Ferroptosis is a crucial tumor suppressor mechanism that has been proven to be effective in anticancer therapy. However, the implications of ferroptosis on the clinical prognosis, chemotherapy, and immune checkpoint inhibitor (ICI) therapy for patients with glioma still need elucidation. Methods: Consensus clustering revealed two distinct ferroptosis-related subtypes based on the Cancer Genome Atlas (TCGA) glioma dataset (n = 663). Subsequently, the ferroptosis-related gene prognostic index (FRGPI) was constructed by weighted gene co-expression network analysis (WGCNA) and "stepAIC" algorithms and validated with the Chinese Glioma Genome Atlas (CGGA) dataset (n = 404). Subsequently, the correlation among clinical, molecular, and immune features and FRGPI was analyzed. Next, the temozolomide sensitivity and ICI response for glioma were predicted using the "pRRophetic" and "TIDE" algorithms, respectively. Finally, candidate small molecular drugs were defined using the connectivity map database based on FRGPI. Results: The FRGPI was established based on the HMOX1, TFRC, JUN, and SOCS1 genes. The distribution of FRGPI varied significantly among the different ferroptosis-related subtypes. Patients with high FRGPI had a worse overall prognosis than patients with low FRGPI, consistent with the results in the CGGA dataset. The final results showed that high FRGPI was characterized by more aggressive phenotypes, high PD-L1 expression, high tumor mutational burden score, and enhanced temozolomide sensitivity; low FRGPI was associated with less aggressive phenotypes, high microsatellite instability score, and stronger response to immune checkpoint blockade. In addition, the infiltration of memory resting CD4+ T cells, regulatory T cells, M1 macrophages, M2 macrophages, and neutrophils was positively correlated with FRGPI. In contrast, plasma B cells and naïve CD4+ T cells were negatively correlated. A total of 15 potential small molecule compounds (such as depactin, physostigmine, and phenacetin) were identified. Conclusion: FRGPI is a promising gene panel for predicting the prognosis, immune characteristics, temozolomide sensitivity, and ICI response in patients with glioma.

Keywords: ferroptosis; ferroptosis-based anticancer therapy; glioma; immune checkpoint inhibitor; immunotherapy; temozolomide; tumor microenvironment.


Conflict of interest statement

The authors declare that the research was conducted in the absence of any commercial or financial relationships that could be construed as a potential conflict of interest.

Figures

FIGURE 1
FIGURE 1
Ferroptosis plays an potential biological role in the progression and treatment of glioma. (A–D) Confocal immunofluorescence staining for GPX4, DHODH, GCH1, FSP1 in cell lines from HPA database. Green, antibody; blue, nucleus; red, microtubules. (E–G) Boxplots of GPX4, GCH1, FSP1 and DHODH expression in different grade, IDH1-status and 1p19q-codeletion-status glioma samples from TCGA database. ns, no significance; *p < 0.05; **p < 0.01; ***p < 0.001. (H,I) The cell viability of U87MG and T98G cells transfected with erastin was evaluated by the CCK-8 assays in 24 and 48 h. Five technical repeats were performed for two biological repeats. (G,K) The cell viability of U87MG and T98G cells transfected with erastin and temozolomide was evaluated by the CCK8 assays in 48 h. Five technical repeats were performed for two biological repeats.
FIGURE 2
FIGURE 2
Two ferroptosis-related subtypes were identified based on the expression profile of FRGs. (A) Correlation heatmap between 24 FRGs expression and PDL-L1/CTAL4. Blue, positive correlation; red, negative correlation. *p < 0.05, **p < 0.01. (B) Heatmap depicted the FRGs expression profile landscape in gliomas of TCGA database. Red, high expression, blue, low expression. (C) Consensus clustering matrix for k = 2. (D) Kaplan–Meier analysis of patients in the two different ferroptosis-related subtypes. (E) Boxplots of GPX4, GCH1, FSP1 and DHODH expression level in the two different ferroptosis-related subtypes. ns, no significance; *p < 0.05; **p < 0.01; ***p < 0.001.
FIGURE 3
FIGURE 3
Clinical features and somatic landscapes of two ferroptosis-related subtypes. (A) Heatmap visualized the distribution of sex, age, grade, immuneScore between the two ferroptosis-related subtypes. *p < 0.05; **p < 0.01; ***p < 0.001. (B–E) Histograms depicted the differences of age, grade, status and histology between two ferroptosis-related subtypes. (F,G) Oncoplot displaying the somatic landscape of glioma cohort of two ferroptosis-related subtypes. Genes are ordered by their mutation frequency, and samples are ordered according to disease histology as indicated by the annotation bar (bottom). Side bar plot shows log10 transformed Q-values estimated by MutSigCV. Landscape of mutation profiles in OC samples. Mutation information of each gene in each sample was shown in the waterfall plot, where different colors with specific annotations at the bottom meant the various mutation types. The bar plot above the legend exhibited the number of mutation burden.
FIGURE 4
FIGURE 4
Different immune cell infiltration between two ferroptosis-related subtypes. (A) Immune cell score heat map, where different colors represent the expression trend in each sample between two ferroptosis-related subtypes. *p < 0.05, **p < 0.01, ***p < 0.001. (B) The percentage abundance of tumor infiltrating immune cells in each sample, with different colors and different types of immune cells. The abscissa represents the sample, and the ordinate represents the percentage of immune cell content in a single sample. (C,D) Violin plots of the immuneScore and stromalScore between the two ferroptosis-related subtypes. *p < 0.05, **p < 0.01, ***p < 0.001. (E) The enrichment plots of representative Gene Set Enrichment Analysis (GSEA) results. ES, enrichment score.
FIGURE 5
FIGURE 5
FRGPI was developed based on FRGs for glioma. (A) Differential gene expression heat map, where different colors represent expression trends in different tissues. Due to the large number of differential genes, the 50 up-regulated genes and 50 down-regulated genes with the largest differential changes are shown here. (B) Correlation of weighted gene correlation network analysis (WGCNA) modules with ferroptosis-related subtypes and immuneScore. (C) Upset plot for DEGs between the two ferroptosis-related subtypes, DEGs between the two ferroptosis-related subgroups, FRGs, IRGs and genes in blue module. IRGs, immune-related genes. (D) FRGPI, survival outcome and HMOX1, TFRC, JUN and SOCS1 expression profiles of each sample are shown. (E) Principal component analysis (PCA) plot of glioma samples based on HMOX1, TFRC, JUN and SOCS1 expression profiles. (F) Kaplan–Meier analysis of glioma patients with low or high FRGPI. (G) ROC curves predicted prognostic value of FRGPI in glioma patients.
FIGURE 6
FIGURE 6
Nomogram was constructed to calculated prognostic risk score for individual. (A,B) Hazard ratio and p-value of constituents involved in univariate and multivariate Cox regression for FRGPI, age, grade, IDH1 status and 1p19q codeletion in TCGA glioma samples. (C) Nomogram to predict the 1-, 3- and 5-year OS of glioma patients. (D) Calibration curve indicated that predicted 1-, 3- and 5-year survival rates were close to the actual survival rates. The gray dashed diagonal line represents the ideal nomogram, and the green line, red line and blue line represent the 1-, 3- and 5-y observed nomograms.
FIGURE 7
FIGURE 7
High FRGPI is associated with glioma progression. (A) Heatmap showed that ferroptosis-related subtypes, grade and immuneScore were significantly associated with FRGPI. *p < 0.05; **p < 0.01; ***p < 0.001. (B) The relationship between FRGPI, ferroptosis-related subtypes, immuneScore, grade and survival status in glioma patients was illustrated by the Sankey diagram. (C) Heatmap of Gene set variation analysis (GSVA) results between High and Low FRGPI groups.
FIGURE 8
FIGURE 8
Anti-tumor immunity and intrinsic immune escape associated with FRGPI. Spearman correlation coefficients and associated p-value of FRGPI with (A) FPI, (B) stromalScore, (C) immuneScore, (D) the expression of PD-L1, (E) TMB score, (F) MSI score, (G) mRNAsi, (H) mDNAsi are shown. r, Spearman coefficient; ns, no significance; *p < 0.05; **p < 0.01; ***p < 0.001. (I) Different immune cell infiltration between high and low FRGPI group, and the correlation between FRGPI and immune cells infiltration. ns, no significance; *p < 0.05; **p < 0.01; ***p < 0.001; blue, positive correlation; red, negative correlation.
FIGURE 9
FIGURE 9
FRGPI is predictive of temozolomide sensitivity and ICI response in glioma. (A) Different estimated temozolomide IC50 between high and low FRGPI group. (B) The spearman correlation between FRGPI and estimated temozolomide IC50. The ICI response of each patient in high and low FRGPI group was predicted by TIDE algorithm, (C) stacked histogram showed the distribution of “TURE” or “FALSE” responder in high and low FRGPI group; (D,E) Violin plots showed the FRGPI level of “TURE”- and “FALSE”-responder group, and the different TIDE score between high- and low-FRGPI group. (F) The spearman correlation between FRGPI and TIDE score. (G) Kaplan–Meier curves showing overall survival in patients with low or high FRGPI in the anti-PD-L1 cohort. (H) The distribution of FRGPI in distinct anti-PD-L1 clinical response groups. (I) Roc curves showing predicting value of FRGPI, neoantigen (NEO), TMB and complex (FRGPI combined with NEO and TMB) group for anti-PD-L1 therapy response. CR, complete response; PD, disease progression, PR, partial response; SD, stable disease. (J–L) Distribution of the FRGPI in distinct IC-level, TC-level and immune-phenotype group respectively in the anti-PD-L1 cohort. IC-level, PD-L1 expression level on immune cells; TC-level, PD-L1 expression level on tumor cells.
FIGURE 10
FIGURE 10
Potential small molecule compounds based on PRGPI. (A) Function enrichment analysis results of 263 DEGs between the high and low FRGPI groups. (B) Candidate small molecular drugs and mechanisms of action were discovered based on FRGPI. The abscissa represents the drugs, and the ordinate represents drug mechanisms of action.

Similar articles

Cited by

References

    1. Aldape K., Brindle K. M., Chesler L., Chopra R., Gajjar A., Gilbert M. R., et al. (2019). Challenges to Curing Primary Brain Tumours. Nat. Rev. Clin. Oncol. 16, 509–520. 10.1038/s41571-019-0177-5 - DOI - PMC - PubMed
    1. Angeli J. P. F., Krysko D. V., Conrad M. (2019). Ferroptosis at the Crossroads of Cancer-Acquired Drug Resistance and Immune Evasion. Nat. Rev. Cancer 19, 405–414. 10.1038/s41568-019-0149-1 - DOI - PubMed
    1. Arnold J. N., Magiera L., Kraman M., Fearon D. T. (2014). Tumoral Immune Suppression by Macrophages Expressing Fibroblast Activation Protein-α and Heme Oxygenase-1. Cancer Immunol. Res. 2, 121–126. 10.1158/2326-6066.cir-13-0150 - DOI - PMC - PubMed
    1. Bellmunt J., De Wit R., Vaughn D. J., Fradet Y., Lee J.-L., Fong L., et al. (2017). Pembrolizumab as Second-Line Therapy for Advanced Urothelial Carcinoma. N. Engl. J. Med. 376, 1015–1026. 10.1056/nejmoa1613683 - DOI - PMC - PubMed
    1. Bersuker K., Hendricks J. M., Li Z., Magtanong L., Ford B., Tang P. H., et al. (2019). The CoQ Oxidoreductase FSP1 Acts Parallel to GPX4 to Inhibit Ferroptosis. Nature 575, 688–692. 10.1038/s41586-019-1705-2 - DOI - PMC - PubMed