. 2022 May;8(3):217-232.
doi: 10.1002/cjp2.255. Epub 2022 Feb 17.

Intra- and extra-cranial BCOR-ITD tumours are separate entities within the BCOR-rearranged family

Affiliations

Intra- and extra-cranial BCOR-ITD tumours are separate entities within the BCOR-rearranged family

Yassine Bouchoucha et al. J Pathol Clin Res. 2022 May.

Abstract

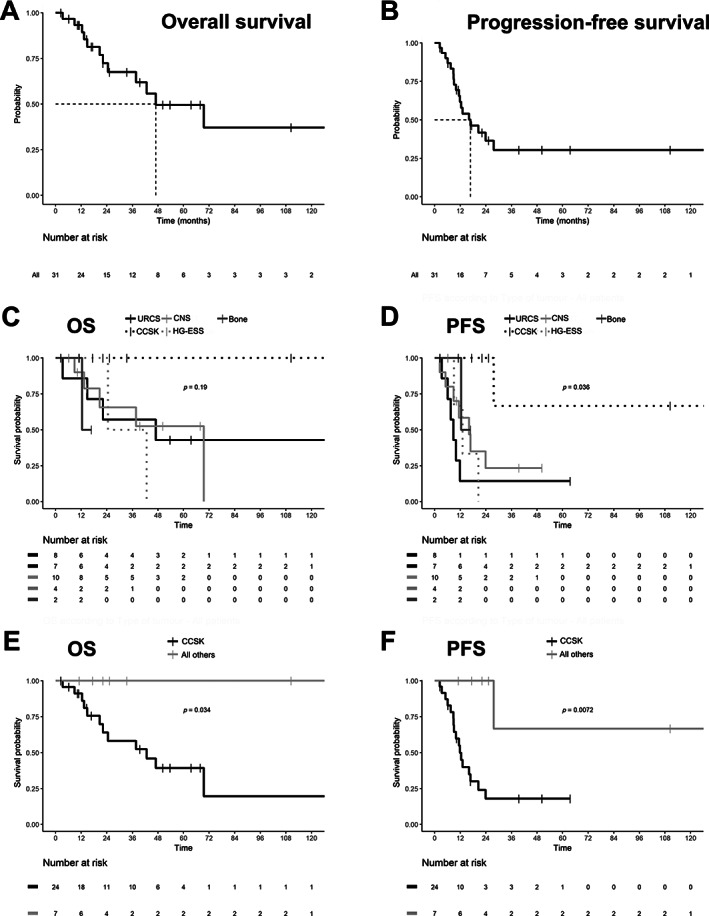
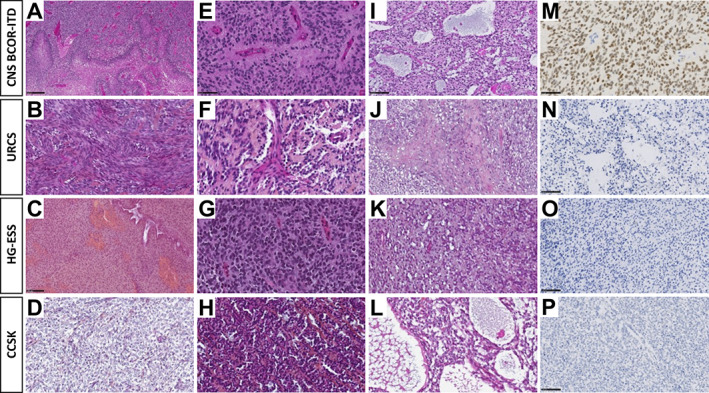
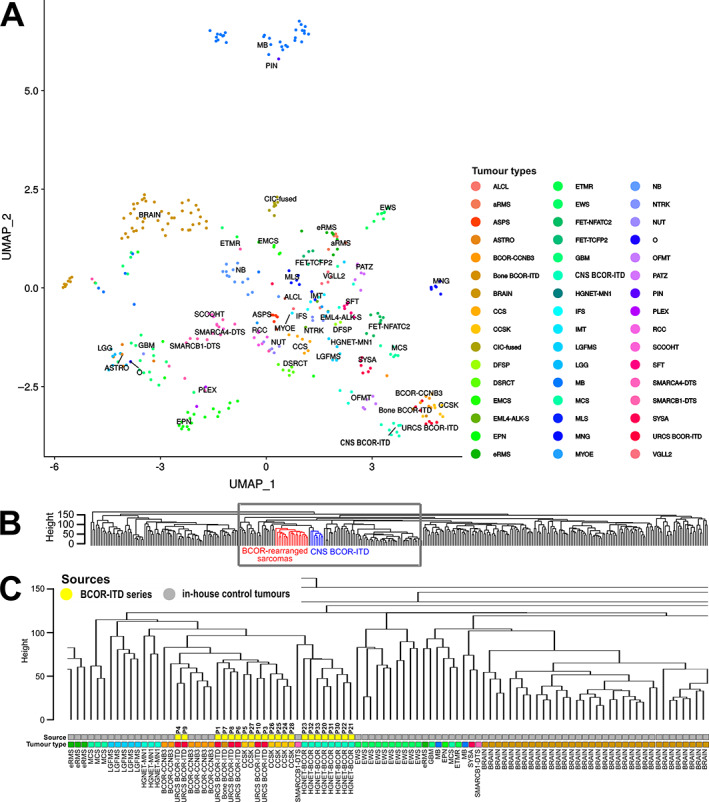
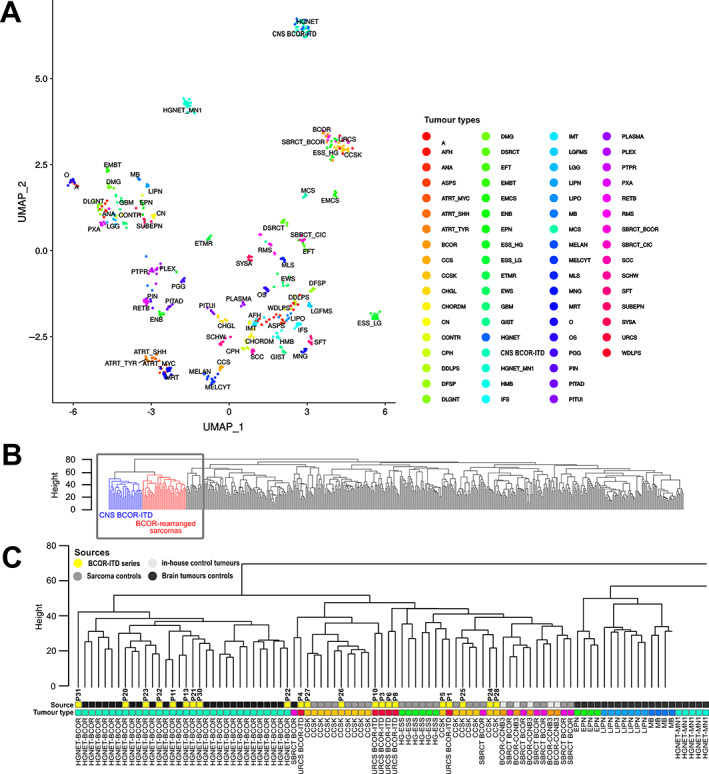
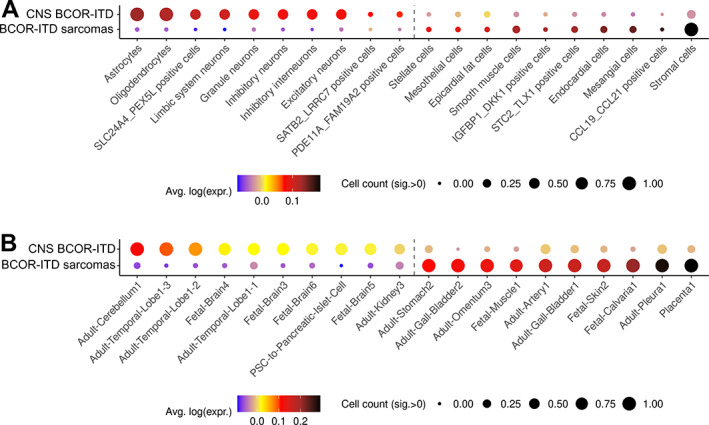
BCOR-ITD tumours form an emerging family of aggressive entities with an internal tandem duplication (ITD) in the last exon of the BCOR gene. The family includes cerebral tumours, termed central nervous system BCOR-ITD (CNS BCOR-ITD), and sarcomatous types described in the kidney as clear cell sarcoma of the kidney (CCSK), in the endometrium as high-grade endometrial stromal sarcoma, and in the bone and soft tissue as undifferentiated round cell sarcoma or primitive myxoid mesenchymal tumour of infancy. Based on a series of 33 retrospective cases, including 10 CNS BCOR-ITD and 23 BCOR-ITD sarcomas, we interrogated the homogeneity of the entity regarding clinical, radiological, and histopathological findings, and molecular signatures. Whole-transcriptomic sequencing and DNA methylation profiling were used for unsupervised clustering. BCOR-ITD tumours mostly affected young children with a median age at diagnosis of 2.1 years (range 0-62.4). Median overall survival was 3.9 years and progression-free survival was 1.4 years. This dismal prognosis is shared among tumours in all locations except CCSK. Histopathological review revealed marked differences between CNS BCOR-ITD and BCOR-ITD sarcomas. These two groups were consistently segregated by unsupervised clustering of expression (n = 22) and DNA methylation (n = 21) data. Proximity between the two groups may result from common somatic changes within key pathways directly related to the novel activity of the ITD itself. Conversely, comparison of gene signatures with single-cell RNA-Seq atlases suggests that the distinction between BCOR-ITD sarcomas and CNS BCOR-ITD may result from differences in cells of origin.

Keywords: BCOR-ITD sarcomas; CCSK; CNS BCOR-ITD; ESS; clustering; methylome; transcriptome.


Figures

Figure 1
Figure 1
Prognosis of BCOR‐ITD tumours. Kaplan–Meier plots showing OS and PFS of the whole BCOR‐ITD cohort (A, B) and the five histological subgroups (C, D). The two metrics are also shown for the CCSK subgroup in comparison with all other groups (E, F). Survival was calculated as the delay between the date of first treatment and the date of decease or last medical visit. Log‐rank test P values are shown in C–F. NS, not significant; p, P value.
Figure 2
Figure 2
Histopathology of BCOR‐ITD tumours. Each line shows histopathological and immunohistochemical findings of one representative case of CNS BCOR‐ITD, URCS, ESS, and CCSK. A case of CNS BCOR‐ITD showing pseudo‐palisading necrosis (A, HPS, magnification, ×100), ependymal pseudorosettes (E, HPS, magnification, ×400), microcystic modifications (I, HPS, magnification, ×200), and diffuse Olig2 immunoexpression (M, magnification, ×400). A case of URCS showing a fascicular pattern composed of spindle cells (B, HPS, magnification, ×400), with some papillary structures and pseudorosettes (F, HPS, magnification, ×400), necrosis, and apoptotic bodies (J, HPS, magnification, ×200), without immunoexpression for Olig2 (N, magnification, ×200). A case of ESS showing spindle cells (C, HPS, magnification, ×200), some pseudorosettes (G, HPS, magnification, ×400), and microcysts (K, HPS, magnification, ×200), with no expression of Olig2 (O, magnification, ×200). A case of CCSK showing an alveolar pattern (D, HPS, magnification, ×400), with some pseudorosettes (H, HPS, magnification, ×400), and microcysts (L, HPS, magnification, ×400), but without immunostaining for Olig2 (P, magnification, ×200). HPS, haematoxylin phloxine saffron. Black scale bars represent 50 μm (E, M), 100 μm (I, N, C, O, P), and 250 μm (A).
Figure 3
Figure 3
Unsupervised clustering using RNA‐Seq data. (A) Unsupervised clustering of gene expression levels of 22 BCOR‐ITD samples, with 346 reference tumours of known histology (previously published sarcomas from Watson et al [27] and unpublished brain tumours from in‐house clinical cohorts), using UMAP dimensionality reduction. (B) Dendrogram of hierarchical clustering using Euclidian distances and the complete linkage method applied to the same dataset as in (A). Locations of BCOR‐ITD sarcomas and CNS BCOR‐ITD tumours are depicted in red and blue, respectively. The grey square outlines the position of the zoom‐in shown in (C). (C) Zoom‐in on the dendrogram. The ‘Source’ bar refers to the control tumours in grey and the cases of the series in yellow, with the corresponding P numbers. The ‘Tumour type’ bar allocates a tumour type to each case, with the same colour code as in (A). Abbreviations: ALCL, anaplastic lymphoma; aRMS, alveolar rhabdomyosarcoma; ASPS, alveolar soft part sarcoma; ASTRO, astrocytoma; BRAIN, normal brain tissue from GTEX database; CCS, clear cell sarcoma of soft tissue; CCSK, clear cell sarcoma of the kidney; CIC‐fused, CIC‐fused sarcoma; DFSP, dermatofibrosarcoma protuberans; DSRCT, desmoplastic small round cell tumour; EMCS, extraskeletal myxoid chondrosarcoma; EML4‐ALK‐S, EML4‐ALK sarcoma; EPN, ependymoma; eRMS, embryonal rhabdomyosarcoma; ETMR, embryonal tumour with multi‐layered rosettes; EWS, Ewing sarcoma; FET‐NFATC2, FET‐NFATC2 sarcoma; FET‐TCFP2, FET‐TCFP2 sarcoma; GBM, glioblastoma; IFS, infantile fibrosarcoma; IMT, inflammatory myofibroblastic tumour; LGFMS, low‐grade fibromyxoid sarcoma; LGG, low‐grade astrocytoma and ganglioglioma; MB, medulloblastoma; MCS, chondrosarcoma; MLS, myxoid liposarcoma; MNG, meningioma; MYOE, myoepithelioma; NB, neuroblastoma; NTRK, NTRK fused sarcoma; NUT, NUT midline carcinoma; O, anaplastic oligodendroglioma; OFMT, ossifying fibromyxoid tumour; PATZ, EWSR1‐PATZ1 sarcoma; PIN, pineoblastoma; PLEX, choroid plexus carcinoma; RCC, renal cell carcinoma; SCCOHT, small cell carcinoma of the ovary hypercalcaemic type; SFT, solitary fibrous tumour; SMARCA4‐DTS, SMARCA4‐deficient thoracic sarcoma; SMARCB1‐DTS, SMARCB1‐deficient thoracic sarcoma; SYSA, synovial sarcoma; VGLL2, VGLL2‐fused sarcoma.
Figure 4
Figure 4
Unsupervised clustering of DNA methylation profiles. (A) UMAP dimension reduction of the 100 first principal components derived from the most variable methylation β values (SD > 0.2, n = 32,500 probes). Twenty‐one BCOR‐ITD samples, with 528 reference tumours (310 brain tumours from Capper et al [29], 212 sarcomas from Koelsche et a. [28], and 6 in‐house BCOR‐CCNB3 tumours). (B) Dendrogram of hierarchical clustering using Euclidian distances and the complete linkage method applied to the same dataset as in (A). Locations of BCOR‐ITD sarcomas and CNS BCOR‐ITD tumours are depicted in red and blue, respectively. The grey square outlines the position of the zoom‐in shown in (C). (C) Zoom‐in on the dendrogram. The ‘Source’ bar refers to the control tumours (light grey for sarcoma cases, dark grey for brain tumours) and the cases of the series in yellow, with the corresponding P numbers. The ‘Tumour type’ bar allocates a tumour type to each case, with the same colour code as in (A) and Figure 3. Abbreviations: A, diffuse astrocytoma IDH mutant; AFH, angiomatoid fibrous histiocytoma; ANA, anaplastic pilocytic astrocytoma; ASPS, alveolar soft part sarcoma; ATRT_MYC, atypical teratoid/rhabdoid tumour MYC subgroup; ATRT_SHH, atypical teratoid/rhabdoid tumour SHH subgroup; ATRT_TYR, atypical teratoid/rhabdoid tumour TYR subgroup; CCS, clear cell sarcoma of soft tissue; CCSK, clear cell sarcoma of the kidney; CHGL, chordoid glioma of the third ventricle; CHORDM, chordoma; CN, central neurocytoma; CPH, adamantinomatous craniopharyngioma; DDLPS, dedifferentiated liposarcoma; DFSP, dermatofibrosarcoma protuberans; DLGNT, diffuse leptomeningeal glioneuronal tumour; DMG, diffuse midline glioma H3K27M; DSRCT, desmoplastic small round cell tumour; EFT, CNS embryonal tumour NOS; EMCS, extraskeletal myxoid chondrosarcoma; EML4‐ALK‐S, EML4‐ALK sarcomas; ENB, esthesioneuroblastoma; EPN, ependymoma; ESS_HG, high‐grade endometrial stromal sarcoma; ESS_LG, low‐grade endometrial stromal sarcoma; ETMR, embryonal tumour with multi‐layered rosettes; EWS, Ewing sarcoma; GBM, glioblastoma; GIST, gastrointestinal stromal tumour; HMB, haemangioblastoma; IFS, infantile fibrosarcoma; IMT, inflammatory myofibroblastic tumour; LGFMS, low‐grade fibromyxoid sarcoma; LGG, low‐grade astrocytoma and ganglioglioma; LIPN, cerebellar liponeurocytoma; LIPO, lipoma; MB, medulloblastoma; MCS, chondrosarcoma; MELAN, malignant melanoma; MELCYT, melanocytoma; MLS, myxoid liposarcoma; MNG, meningioma; MRT, malignant rhabdoid tumour; O, anaplastic oligodendroglioma; OS, osteosarcoma; PGG, paraganglioma; PIN, pineoblastoma; PITAD, pituitary adenoma; PITUI, spindle cell oncocytoma; PLASMA, plasmacytoma; PLEX, choroid plexus carcinoma; PTPR, papillary tumour of the pineal region; PXA, pleiomorphic xanthoastrocytoma; RETB, retinoblastoma; RMS, rhabdomyosarcoma; SBRCT_BCOR, small blue round cell tumour with BCOR alteration; SBRCT_CIC, small blue round cell tumour with CIC alteration; SCC, squamous cell carcinoma; SCHW, melanocytic schwannoma; SFT, solitary fibrous tumour; SUBEPN, subependymoma; UMAP, Uniform Manifold Approximation and Projection
Figure 5
Figure 5
Dot plot summarising the distributions of CNS BCOR‐ITD and BCOR‐ITD sarcoma signatures over cell types independently analysed by single‐cell/single‐nuclei RNA‐Seq. The signatures were computed from the DEGs between CNS BCOR‐ITD and the BCOR‐ITD sarcoma with a minimal fold‐change of 2.5. Dot colour represents the average of each distribution and size represents the count of cells within a cell type with a signature intensity strictly higher than 0 brought to the [0, 1] range: a gene signature is highly represented in a cell type of the atlas when the dot gets bigger (several cells of one type express the signature) and tends towards black colour (several genes of the signature are expressed within a cell type). (A) Dot plot of the CNS BCOR‐ITD signature (upper line) and the BCOR‐ITD sarcomas signature (lower lines) over selected cell types of the Cao et al's atlas. Only significant cell types are shown. The complete list of this atlas' cell types is shown in supplementary material, Figure S5. The number of genes in common between the signatures and the reference database is as follows: CNS BCOR‐ITD n = 114; BCOR‐ITD sarcomas n = 43. (B) Dot plot of the CNS BCOR‐ITD signature (upper line) and the BCOR‐ITD sarcoma signature (lower line) over selected cell types of the Han et al's atlas. Only significant cell types are shown. The complete list of this atlas' cell types is shown in supplementary material, Figure S5. Number of genes in signatures is also in the reference database: CNS BCOR‐ITD n = 103; BCOR‐ITD sarcomas n = 38.

References

    1. Ueno‐Yokohata H, Okita H, Nakasato K, et al. Consistent in‐frame internal tandem duplications of BCOR characterize clear cell sarcoma of the kidney. Nat Genet 2015; 47: 861–863. - PubMed
    1. Astolfi A, Melchionda F, Perotti D, et al. Whole transcriptome sequencing identifies BCOR internal tandem duplication as a common feature of clear cell sarcoma of the kidney. Oncotarget 2015; 6: 40934–40939. - PMC - PubMed
    1. Roy A, Kumar V, Zorman B, et al. Recurrent internal tandem duplications of BCOR in clear cell sarcoma of the kidney. Nat Commun 2015; 6: 8891. - PMC - PubMed
    1. Karlsson J, Valind A, Gisselsson D. BCOR internal tandem duplication and YWHAE‐NUTM2B/E fusion are mutually exclusive events in clear cell sarcoma of the kidney. Genes Chromosomes Cancer 2016; 55: 120–123. - PubMed
    1. Kenny C, Bausenwein S, Lazaro A, et al. Mutually exclusive BCOR internal tandem duplications and YWHAE‐NUTM2 fusions in clear cell sarcoma of kidney: not the full story. J Pathol 2016; 238: 617–620. - PubMed

Publication types