

A clinically compatible drug-screening platform based on organotypic cultures identifies vulnerabilities to prevent and treat brain metastasis
- PMID: 35174975
- PMCID: PMC8899920
- DOI: 10.15252/emmm.202114552
A clinically compatible drug-screening platform based on organotypic cultures identifies vulnerabilities to prevent and treat brain metastasis
Abstract
We report a medium-throughput drug-screening platform (METPlatform) based on organotypic cultures that allows to evaluate inhibitors against metastases growing in situ. By applying this approach to the unmet clinical need of brain metastasis, we identified several vulnerabilities. Among them, a blood-brain barrier permeable HSP90 inhibitor showed high potency against mouse and human brain metastases at clinically relevant stages of the disease, including a novel model of local relapse after neurosurgery. Furthermore, in situ proteomic analysis applied to metastases treated with the chaperone inhibitor uncovered a novel molecular program in brain metastasis, which includes biomarkers of poor prognosis and actionable mechanisms of resistance. Our work validates METPlatform as a potent resource for metastasis research integrating drug-screening and unbiased omic approaches that is compatible with human samples. Thus, this clinically relevant strategy is aimed to personalize the management of metastatic disease in the brain and elsewhere.
Keywords: drug-screen; metastasis; organotypic cultures; patient-derived; resistance.
© 2022 The Authors. Published under the terms of the CC BY 4.0 license.
Figures
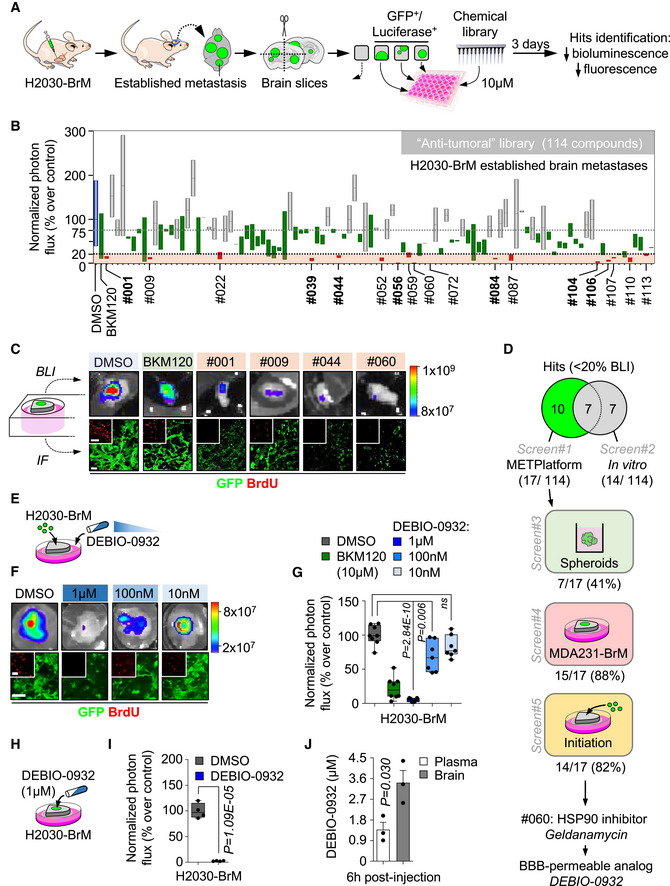
Schema of the experimental design.
Quantification of the bioluminescence signal emitted by established H2030‐BrM brain metastases in each organotypic culture at day 3 normalized by their initial value at day 0 (before the addition of DMSO or any compound). The final value in the graph is normalized to the organotypic cultures treated with DMSO. Blue: DMSO‐treated organotypic cultures; red: hits, compounds with normalized BLI ≤ 20%; green: BKM120 and compounds with similar efficacy to BKM120; gray: compounds that do not reduce BLI values. Values are shown in box‐and‐whisker plots where the line in the box corresponds to the mean. Boxes extend from the minimum to the maximum value (n = 28 DMSO; n = 21 BKM120‐treated organotypic cultures; each experimental compound of the library was assayed by duplicate, 8 independent experiments). Hits highlighted in bold are common to those obtained in the in vitro screening (Fig EV1A). Gray dashed line indicates the minimum decrease in BLI (25%) that we considered as a positive phenotype. The black dashed line represents 80% decrease in BLI, which identifies top hits.
Representative images of bioluminescence (BLI) and histology of organotypic cultures with established brain metastases from H2030‐BrM treated with DMSO, BKM120 or the indicated hits. Cancer cells are in green (GFP) and proliferative cells are in red (BrdU). Scale bar: 75 µm.
Venn diagram showing the number of hits ex vivo (17) and in vitro (14) and common to both approaches (7). Compounds tested in additional screens (screen#3: H2030‐BrM spheroids; screen#4: established MDA231‐BrM breast cancer brain metastasis; and screen#5: metastasis initiation H2030‐BrM) only include those considered as hits ex vivo in panel B. Number of hits in each screen are indicated over the total number of hits obtained in screen#1 (B).
Schema of the experimental design. Organotypic cultures with H2030‐BrM cells mimicking the early steps of colonization were used to perform dose‐response optimization with DEBIO‐0932.
Representative BLI and histology of organotypic cultures with H2030‐BrM cancer cells treated with DMSO or decreasing concentrations of DEBIO‐0932. Scale bar: 100 µm; high magnification: 50 µm.
Quantification of the bioluminescence signal emitted by each condition shown in (F) at Day 3 normalized by the initial value obtained at Day 0 and normalized to the organotypic cultures treated with DMSO. Day 0 is considered 12–16 h after the addition of cancer cells and treatment or DMSO. Values are shown in box‐and‐whisker plots where each dot is an organotypic culture and the line in the box corresponds to the median. The boxes go from the upper to the lower quartiles and the whiskers go from the minimum to the maximum value (n = 8 DMSO, n = 8 BKM120 and n = 7 per concentration of DEBIO‐0932‐treated organotypic cultures, 2 independent experiments). P value was calculated using two‐tailed t‐test.
Schema of the experimental design. Organotypic cultures with H2030‐BrM established metastases were used to test the efficacy of DEBIO‐0932.
Quantification of the bioluminescence signal emitted by H2030‐BrM established metastases in organotypic cultures at Day 3 normalized by the initial value obtained at Day 0 and normalized to the organotypic cultures treated with DMSO. Day 0 is considered right before addition of the treatment or DMSO. Values are shown in box‐and‐whisker plots where each dot is an organotypic culture and the line in the box corresponds to the median. The boxes go from the upper to the lower quartiles and the whiskers go from the minimum to the maximum value (n = 4 organotypic cultures per experimental condition, 2 independent experiments). P value was calculated using two‐tailed t‐test.
Quantification of the concentration of DEBIO‐0932 reached in animals harboring H2030‐BrM established brain metastases 6 h after oral administration of DEBIO‐0932 at 160 mg/kg. The concentration was measured in both the plasma and the brain for each mouse. Values are shown as mean + s.e.m. (n = 3 mice per experimental condition). P value was calculated using two‐tailed t‐test.
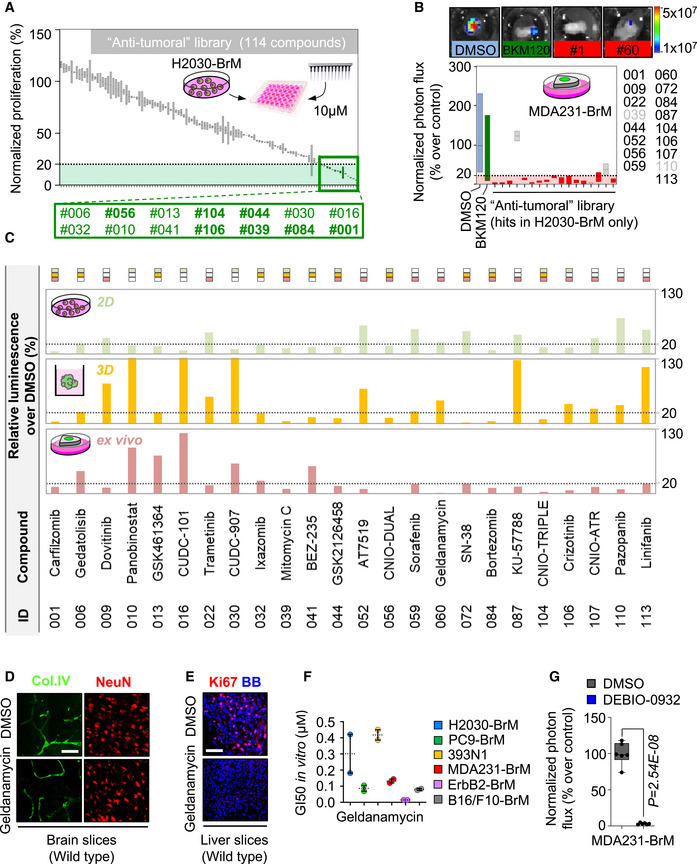
Quantification of the proliferation of H2030‐BrM cells at day 3 normalized to the cells treated with DMSO measured with CellTiter‐Glo®. Green: hits, compounds with ≤ 20% proliferation; gray: compounds with > 20% proliferation. Values are shown in box‐and‐whisker plots where the line in the box corresponds to the mean. Each experimental compound of the library was assayed by duplicate. Hits highlighted in bold were common to the ex vivo screening (Fig 1B).
Quantification of the bioluminescence signal from MDA231‐BrM established brain metastases in organotypic culture after 3 days in culture. Values were normalized by the level of bioluminescence at Day 0 for each culture (before the addition of DMSO or any compound). Final data is shown in percentage respect to reference, the organotypic cultures treated with DMSO. Blue: DMSO‐treated organotypic cultures; red: hits, compounds with normalized BLI ≤ 20% (dashed line); green: BKM120; gray: compounds with normalized BLI > 20%. Values are shown in box‐and‐whisker plots where the line in the box corresponds to the mean. Boxes extend from the minimum to the maximum value (n = 14 DMSO; n = 13 BKM120‐treated organotypic cultures; each experimental compound was assayed by duplicate, 4 independent experiments).
Detailed representation of the data shown in Figs 1B, EV1A and Table EV1 indicating relative viability using bioluminescence generated by H2030‐BrM cells ex vivo (established brain metastases, light red), in vitro 2D (green) and in vitro 3D (spheroids, yellow) treated with compounds of the anti‐tumoral library (compounds were assayed by duplicate in each assay). All hits for any condition are shown. The rectangles of the top indicate whether a given compound was effective (< 20% luminescence respect to control) ex vivo (light red rectangle), in vitro 2D (green rectangle), in vitro 3D (yellow rectangle).
Representative wild‐type brain slices treated with DMSO or the HSP90 inhibitor geldanamycin stained with anti‐Col.IV (endothelial cells) and anti‐NeuN (neurons). Scale bar: 50 µm.
Representative wild‐type liver slices treated with DMSO or the HSP90 inhibitor geldanamycin and stained with anti‐Ki67 to score proliferation. BB: bisbenzamide. Scale bar: 50 µm.
Quantification of GI50 values of geldanamycin in a panel of BrM cell lines in vitro from various primary origins and oncogenomic profiles. Nine serial concentrations of geldanamycin were assayed by duplicate and GI50 was calculated from a viability curve normalized to DMSO‐treated cells of the corresponding cell line. Values are shown as mean + s.e.m. (each concentration was assayed by technical duplicates for each cell line and the experiment was performed twice).
Quantification of the bioluminescence signal emitted by MDA231‐BrM established metastases in organotypic cultures incubated in the presence of DEBIO‐0932 (1 µM) during 3 days. Bioluminescence at Day 3 is normalized by the initial value obtained at day D and quantified relative to the organotypic cultures treated with DMSO. Day 0 is considered right before addition of the treatment or DMSO. Values are shown in box‐and‐whisker plots where each dot is an organotypic culture and the line in the box corresponds to the median. The boxes go from the upper to the lower quartiles and the whiskers go from the minimum to the maximum value (n = 6 organotypic cultures per experimental condition, 1 experiment). P value was calculated using two‐tailed t‐test.
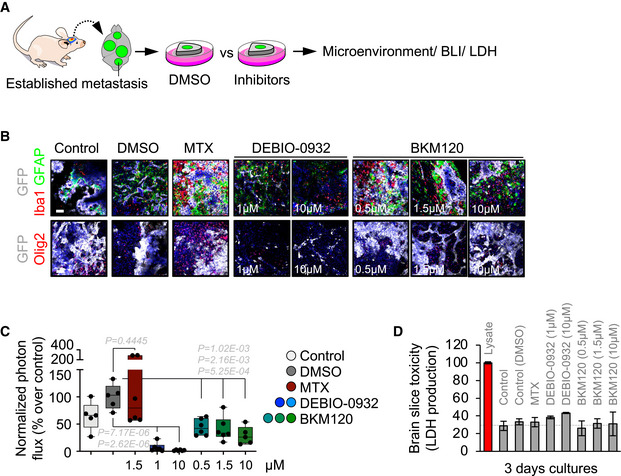
Schema of the experimental design.
Representative images of organotypic cultures with established metastases with various glial components of the microenvironment labeled. Scale bar: 75 µm. Each individual condition was evaluated in several organotypic cultures (3–6 slices).
Quantification of the bioluminescence signal emitted by established H2030‐BrM brain metastases in each organotypic culture at Day 3 normalized by their initial value at Day 0 (before the addition of DMSO or any compound). The final value in the graph is normalized to the organotypic cultures treated with DMSO. Values are shown in box‐and‐whisker plots where the line in the box corresponds to the mean. The boxes go from the upper to the lower quartiles and the whiskers go from the minimum to the maximum value (n = 5–6 organotypic cultures, 1 independent experiment). P value was calculated using two‐tailed t‐test.
Quantification of LDH levels in the conditioned media of organotypic slices cultured during 3 days relative to a lysate of the same preparation. Values are shown as mean + s.e.m. (n = 3 organotypic cultures per experimental condition, 1 independent experiment).
- A–C
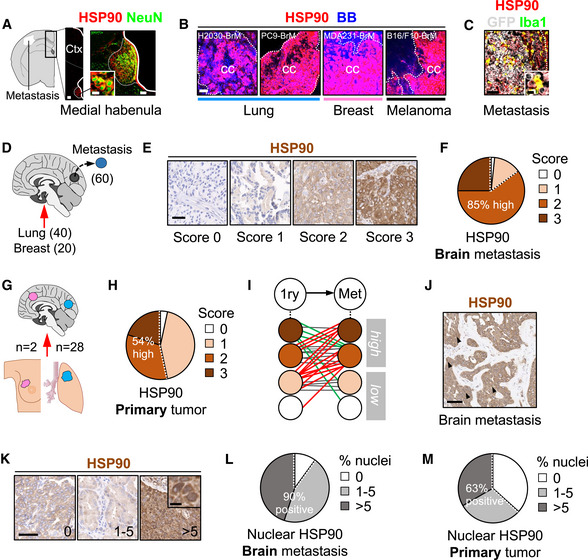
Immunofluorescence against HSP90 in mouse brains with established metastases. (A) HSP90 positive structures in areas not affected by the metastasis includes the medial habenula, where neurons co‐localize with the chaperone. Scale bars: 100 µm (low magnification), 50 µm (medial habenula nucleus), 12 µm (high magnification neurons). (B) Established metastases from different primary origins and oncogenomic profiles stained with HSP90. Dotted lines delineate the metastasis (cc: cancer cells). Scale bars: 75 µm. (C) Iba1 colocalizes with HSP90 within areas affected by metastases. BB: bisbenzamide. Scale bar: 75 µm (low magnification), 12 µm (high magnification).
- D
Immunohistochemistry against HSP90 was performed in human brain metastases (n = 60) from lung (40 cases) and breast cancer (20 cases).
- E
Representative human brain metastases showing different intensities or scores for HSP90. Scale bar: 50 µm.
- F
Quantification of HSP90 in human brain metastases. 59 out of 60 (98%) showed positive staining of HSP90 in the tumor, 15 (25%) scored with 3 (strong), 36 (60%) with 2 (moderate), and 8 (13%) with 1 (weak) according to the signal intensity of HSP90 in the cytoplasm of cancer cells.
- G
Human brain metastases (n = 30) and their matched primary tumors (n = 28 lung and n = 2 breast) were evaluated and compared for HSP90 expression by immunohistochemistry.
- H
Quantification of HSP90 in human primary tumors. 29 out of 30 (97%) showed positive staining of HSP90 in the tumor, 6 (20%) scored with 3 (strong), 10 (34%) with 2 (moderate), and 13 (43%) with 1 (weak) according to the signal intensity of HSP90 in the cytoplasm of cancer cells.
- I
Schema showing HSP90 scores in matched pairs of primary tumor and brain metastasis. Red: increase of HSP90 score from primary to brain metastasis; green: decrease of HSP90 score; gray: no changes in HSP90 score.
- J, K
Representative human brain metastases showing different percentages of nuclear HSP90. Scale bars: (J) 50 µm; (K) low magnification: 100 µm; high magnification: 10 µm. Black arrows point to cancer cells positive for HSP90 in the nucleus.
- L
Quantification of nuclear HSP90 in human brain metastases. 54 out of 60 samples (90%) showed positive nuclear HSP90 in the tumor. 27 (45%) showed 1–5% (moderate) and 27 (45%) showed > 5% (high) of nuclear HSP90.
- M
Quantification of nuclear HSP90 in human primary tumors. 19 out of 30 (63%) showed positive nuclear HSP90 in the tumor. 9 (30%) showed 1–5% (moderate) and 10 (33%) showed > 5% (high) of nuclear HSP90.
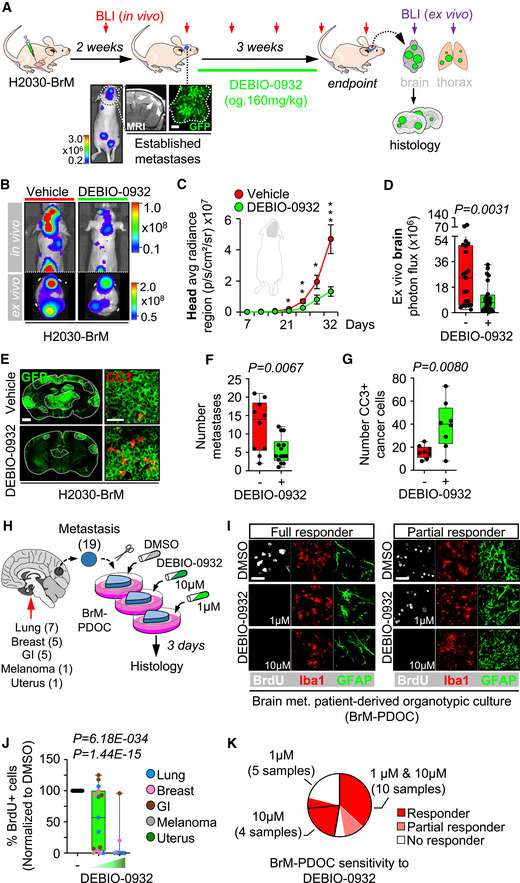
Schema of the experimental design. H2030‐BrM cells were inoculated intracardially into nude mice and established brain metastases were detected 2 weeks after by BLI, MRI (arrows) and histology (GFP+ cancer cells). DEBIO‐0932 was administered orally at 160 mg/kg for 3 weeks (daily during the first week and every 48 h during the two following weeks) and ex vivo BLI of brains and thoracic regions were analyzed. Brains were processed for histological analysis. Scale bar: 100 µm.
Representative in vivo and ex vivo images of vehicle and DEBIO‐0932‐treated mice 5 weeks (experimental endpoint) after intracardiac inoculation of H2030‐BrM cells.
Quantification of metastatic progression as measured by in vivo BLI of head of animals. Values are shown as mean ± s.e.m. (n = 23 vehicle and n = 25 DEBIO‐0932‐treated mice, 3 independent experiments). P value was calculated using two‐tailed t‐test (P values: *P < 0.05, **P < 0.01, ***P < 0.001).
Quantification of ex vivo BLI of brains at the endpoint of the experiment. Values are shown in box‐and‐whisker plots where every dot represents a different animal and the line in the box corresponds to the median. The boxes go from the upper to the lower quartiles and the whiskers go from the minimum to the maximum value (n = 21 vehicle and n = 24 DEBIO‐0932‐treated mice, three independent experiments). P value was calculated using two‐tailed t‐test.
Representative sections of brains from vehicle and DEBIO‐0932‐treated mice in (B–D). The dotted lines surround the metastases (GFP+). Representative field of view of metastasis stained with GFP and cleaved caspase 3. Scale bars: slices, 1 mm; cleaved caspase 3, 50 µm.
Quantification of established metastases found in vehicle and DEBIO‐0932‐treated brains from panel (E). Values are shown in box‐and‐whisker plots where every dot represents a different brain and the line in the box corresponds to the median. The boxes go from the upper to the lower quartiles and the whiskers go from the minimum to the maximum value (vehicle: n = 10 brains; DEBIO‐0932: n = 14 brains). P value was calculated using two‐tailed t‐test.
Quantification of number of cleaved caspase 3 (CC3+) in cancer cells found in vehicle and DEBIO‐0932‐treated brains from panel (E). Values are shown in box‐and‐whisker plots where every dot is a metastatic lesion and the line in the box corresponds to the median. The boxes go from the upper to the lower quartiles, and the whiskers go from the minimum to the maximum value (n = 8 metastatic lesions from 4 brains per condition). P value was calculated using two‐tailed t‐test.
Schema of the experimental design. Fresh surgically resected human brain metastases (n = 19) from various primary origins were used to perform patient‐derived organotypic cultures (BrM‐PDOC) and treated with DEBIO‐0932 at 10 µM and 1 µM for 3 days.
Representative BrM‐PDOC stained with proliferation markers (BrdU) and markers of the microenvironment (GFAP for astrocytes, Iba1 for microglia/ macrophages). Scale bar: 50 µm.
Quantification of the relative number of BrdU+ cancer cells found in DMSO DEBIO‐0932‐treated BrM‐PDOC respect to the corresponding PDOC treated with DMSO. Values are shown in box‐and‐whisker plots where every dot represents a patient (mean value obtained from all PDOC from the same condition and patient) and the line in the box corresponds to the median. The boxes go from the upper to the lower quartiles, and the whiskers go from the minimum to the maximum value (n = 19 patients with DMSO‐treated PDOC, n = 14 DEBIO‐0932 10 µM and n = 15 DEBIO‐0932 1 µM, each patient is an independent experiment). P value was calculated using two‐tailed t‐test. Dots are colored according to the primary source of the metastasis.
Pie chart showing all BrM‐PDOC in (J) classified according to the specific dose tested and the type of response observed. Partial responder means that the response was different depending on the dose of DEBIO‐0932, with PDOC not responding at 1 µM.
- A
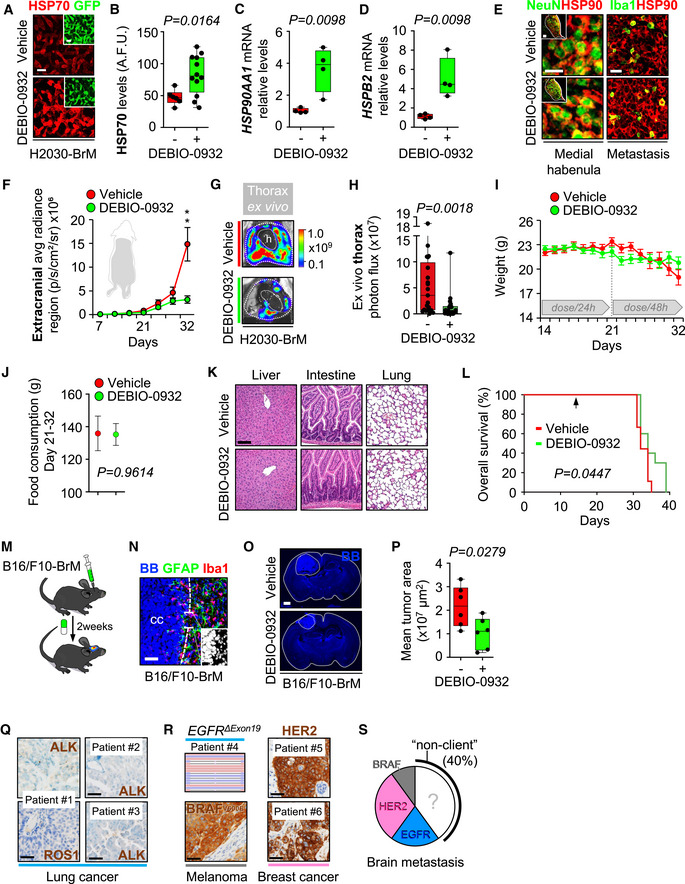
Representative images showing HSP70 levels in brain metastases (generated by intracardiac inoculation of H2030‐BrM) found at endpoint of vehicle and DEBIO‐0932‐treated animals. Scale bar: 75 µm.
- B
Quantification of HSP70 levels shown in (A) in arbitrary fluorescent units (A.F.U.). Values are shown in box‐and‐whisker plots where each dot is a metastatic lesion and the line in the box corresponds to the median. The boxes go from the upper to the lower quartiles, and the whiskers go from the minimum to the maximum value (n = 6–12 metastatic lesions from 3 to 6 brains per condition). P value was calculated using two‐tailed t‐test.
- C, D
HSP90AA1 (C) and HSPB2 (D) expression levels obtained by qRT–PCR of H2030‐BrM brain metastases obtained at endpoint of vehicle and DEBIO‐0932‐treated animals. Values are shown in box‐and‐whisker plots where every dot represents a different animal and the line in the box corresponds to the median. The boxes go from the upper to the lower quartiles, and the whiskers go from the minimum to the maximum value (n = 4 mice per experimental condition). P value was calculated using two‐tailed t‐test.
- E
Representative images of HSP90+ non‐cancer cell compartments including the medial habenula and the Iba1+ microglia/macrophages in the metastasis‐associated microenvironment from vehicle and DEBIO‐0932‐treated brains at the endpoint of the experiment (Fig 4A). Scale bars: Medial habenula low magnification (nucleus): 50 µm; Medial habenula high magnification (cells): 12.5 µm; Metastasis: 32 µm.
- F
Quantification of metastatic progression as measured by in vivo BLI of extracranial region of animals. Values are shown as mean ± s.e.m. (n = 23 vehicle and n = 25 DEBIO‐0932‐treated mice, 3 independent experiments). P value was calculated using two‐tailed t‐test (P values: **P < 0.01).
- G
Representative images of thorax from vehicle and DEBIO‐0932‐treated mice at the endpoint of the experiment.
- H
Quantification of ex vivo BLI of thoracic regions at the endpoint of the experiment. Values are shown in box‐and‐whisker plots where every dot represents a different animal and the line in the box corresponds to the median. The boxes go from the upper to the lower quartiles, and the whiskers go from the minimum to the maximum value. (n = 21 vehicle and n = 24 DEBIO‐0932‐treated mice, three independent experiments). P value was calculated using two‐tailed t‐test.
- I
Animal weight from vehicle and DEBIO‐0932‐treated mice during the treatment period. DEBIO‐0932 treatment started 2 weeks (day 14) after inoculation of cancer cells and was maintained for 3 weeks, once every 24 h during the first week and once every 48 h during the two following weeks. Values are shown as mean ± s.e.m. (n = 9 vehicle and n = 10 DEBIO‐0932‐treated mice).
- J
Quantification of mean food consumption during the interval of time between 21 and 32 days in both vehicle and DEBIO‐0932‐treated mice. Values are shown as mean ± s.e.m. (n = 6 mice per experimental condition. Mice were divided in two individual cages per experimental condition with 3 mice each). P value was calculated using two‐tailed t‐test.
- K
Hematoxylin eosin staining of three organs from vehicle and DEBIO‐0932‐treated mice at experimental endpoint. (n = 3 mice per experimental condition were evaluated for each organ). Scale bar: 50 µm.
- L
Kaplan‐Meier curve comparing overall survival of vehicle and DEBIO‐0932‐treated mice following the schedule depicted in Fig 4A. (n = 9 mice treated with vehicle and n = 10 mice treated with DEBIO‐0932). P value was calculated using log‐rank (Mantel‐Cox) test. The arrow indicates when the treatment was initiated.
- M
Schema of experimental design. The brain metastatic melanoma cell line B16/F10‐BrM was intracranially injected to generate an established tumor so the treatment could start 3 days post‐injection.
- N
Representative image of an established tumor 3 days post‐injection. The interface between the metastasis and the associated microenvironment is well‐defined. Scale bar: 50 µm (low magnification); 25 µm (high magnification).
- O
Representative images of slices with the brain tumor at the end of the experiment. BB: Bisbenzamide. Scale bar: 1 mm.
- P
Quantification of the tumor area at experimental endpoint. Values are shown in box‐and‐whisker plots where every dot represents a different brain and the line in the box corresponds to the median. The boxes go from the upper to the lower quartiles and the whiskers go from the minimum to the maximum value (n = 6 mice per experimental condition). P value was calculated using two‐tailed t‐test.
- Q
Representative images of human brain metastases from which BrM‐PDOC were generated and evaluated as responders (Fig 4H) that showed no correlation with HSP90‐dependent oncogenic drivers ALK and ROS1. Scale bar: 50 µm.
- R
Representative images of human brain metastases from which BrM‐PDOC were generated and evaluated as responders (Fig 4H) that showed positive correlation with HSP90‐dependent oncogenic drivers HER2 and BRAF. Scale bar: 50 µm. Targeting sequencing of the EGFR locus of a lung cancer brain metastasis patient showing a deletion in exon 19 is also shown.
- S
Pie chart showing the distribution of the ten BrM‐PDOCs with oncogenic drivers sensitive to HSP90 inhibition (Non‐HSP90 client: n = 4; EGFR mutant lung cancer: n = 2; HER2+ breast cancer: n = 3; BRAF mutant melanoma: n = 1).
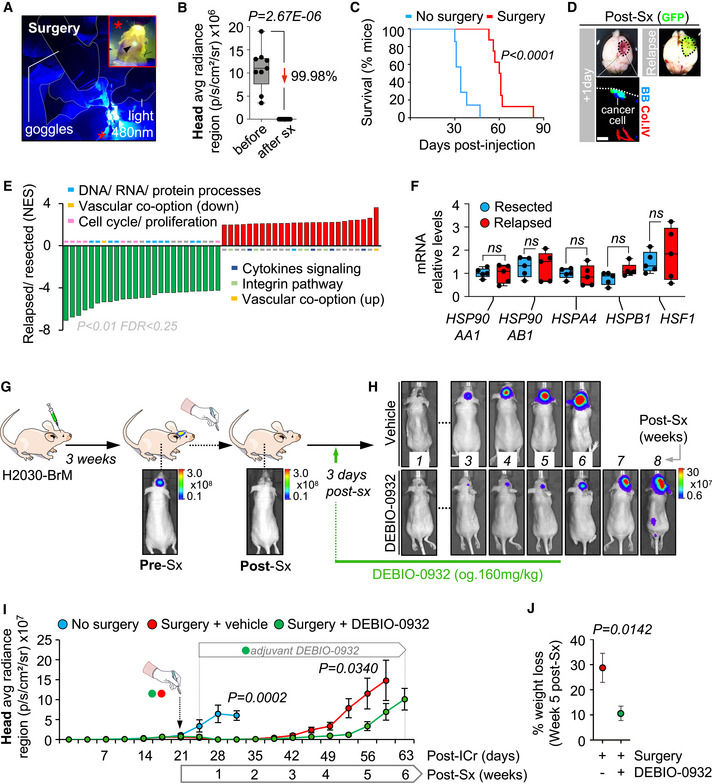
Detailed image of the neurosurgery procedure that visualizes the GFP+ brain tumor (high magnification) with a 480 nm light source and goggles equipped with emission filters. The asterisk in the low magnification labels the field of view for the surgeon, which is amplified in the high magnification through the emission filter equipped in the goggles. The arrow in the high magnification points to the GFP+ tumor as seen by the surgeon.
Quantification of BLI values before and one day after neurosurgery. Values are shown in box‐and‐whisker plots where every dot represents a different animal and the line in the box corresponds to the median. The boxes go from the upper to the lower quartiles, and the whiskers go from the minimum to the maximum value (n = 9 mice before and after surgery). P value was calculated using two‐tailed t‐test.
Kaplan‐Meier curve showing survival proportions of mice without (blue line, n = 7) and with surgery (red line, n = 8). P value was calculated using log‐rank (Mantel‐Cox) test.
Representative images of brains one day after neurosurgery and at the endpoint of local relapse. Remaining cancer cells (GFP+) were found under the microscope in the surgical bed. GFP fluorescence of fully relapsed tumor at the experimental endpoint could be observed macroscopically. BB: bisbenzamide. Col.IV: collagen IV. Scale bar: 25 µm.
GSEA of top 25 up‐ (red) and downregulated (green) signatures comparing matched relapsed and resected brain metastases from animals receiving neurosurgery.
qRT–PCR of H2030‐BrM brain metastases obtained from animals during neurosurgery compared to relapsed metastases from the corresponding animals. A panel of five genes related to HSP90 pathway is evaluated. Values are shown in box‐and‐whisker plots where every dot represents a different animal and the line in the box corresponds to the median. The boxes go from the upper to the lower quartiles, and the whiskers go from the minimum to the maximum value (n = 5 mice per experimental condition). P value was calculated using two‐tailed t‐test.
Schema of experimental design. H2030‐BrM cells were implanted intracranially into nude mice and established brain metastases were surgically resected. DEBIO‐0932 was administered orally at 160 mg/kg 3 days later and during 5–6 weeks following an individualized regimen. Sx: surgery.
Representative images of vehicle and DEBIO‐0932‐treated mice after neurosurgery until experimental endpoint at 6 and 8 weeks for vehicle and DEBIO‐0932‐treated mice, respectively.
Quantification of brain tumor progression as measured by in vivo BLI of head region in animals without surgery, with surgery and vehicle or DEBIO‐0932. DEBIO‐0932 treatment was initiated 3 days after surgery, which was applied 3 weeks post‐injection of BrM cells, and maintained for 5–6 weeks after local treatment. Values are shown as mean ± s.e.m. (n = 7 without surgery, n = 8 surgery + vehicle and n = 11 surgery + DEBIO‐0932‐treated mice, 2 independent experiments). P value was calculated using two‐tailed t‐test (No surgery versus surgery + vehicle (day 32), P = 0.0002; surgery + vehicle versus surgery + DEBIO‐0932 (day 56), P = 0.0340).
Quantification of the percentage of weight loss at advanced stages of local relapse (week 5 post‐surgery). Values were obtained relative to the mean weight for each group at day 19, which corresponds to the highest weight value before any decrease could be detected. Values are shown as mean ± s.e.m. (n = 4 surgery + vehicle and n = 6 surgery + DEBIO‐0932‐treated mice, 1 experiment). P value was calculated using two‐tailed t‐test.
- A
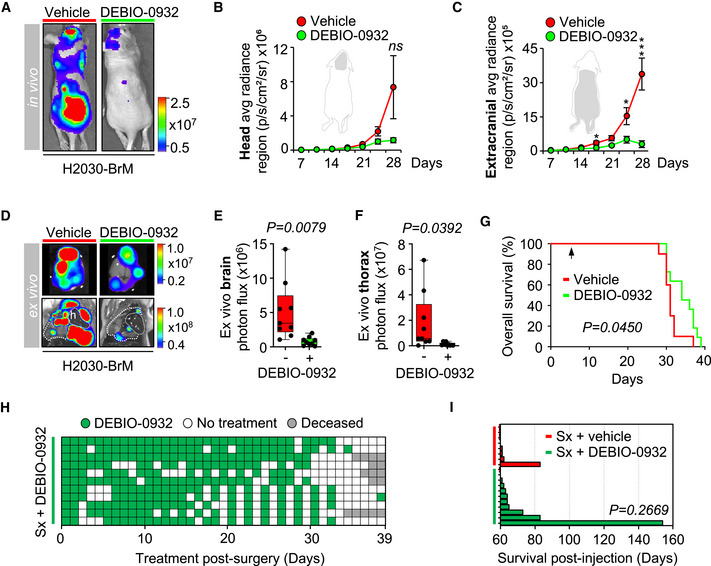
Representative images of mice treated with DEBIO‐0932 (160 mg/kg, o.g.) starting at 7 days after intracardiac inoculation of H2030‐BrM cells. Treatment was given daily during the first week and every 48 h during the two following weeks.
- B, C
Quantification of metastatic progression as measured by in vivo BLI of head (B) and extracranial region (C) of animals. Values are shown as mean ± s.e.m. (n = 9 vehicle and n = 9 DEBIO‐0932‐treated mice, 2 independent experiments). P value was calculated using two‐tailed t‐test (P values: *P < 0.05, ***P < 0.001).
- D
Representative images of brains and thorax from vehicle and DEBIO‐0932‐treated mice at the endpoint of the experiment.
- E, F
Quantification of ex vivo BLI of brains (E) and thoracic regions (F) at the endpoint of the experiment. Values are shown in box‐and‐whisker plots where every dot represents a different animal and the line in the box corresponds to the median. The boxes go from the upper to the lower quartiles, and the whiskers go from the minimum to the maximum value (n = 9 vehicle and n = 9 DEBIO‐0932‐treated mice, 2 independent experiments). P value was calculated using two‐tailed t‐test.
- G
Kaplan‐Meier curve comparing overall survival of vehicle and DEBIO‐0932‐treated mice starting 7 days post‐intracardiac injection (n = 10 mice treated with vehicle and n = 11 mice treated with DEBIO‐0932). P value was calculated using log‐rank (Mantel‐Cox) test. The arrow indicates when the treatment was initiated.
- H
Schema showing the individualized therapy of mice receiving surgery + DEBIO‐0932 during the treatment period starting 3 days after surgery. Each row represents a mouse receiving DEBIO‐0932 (green) o not (white) (n = 11 surgery + DEBIO‐0932‐treated mice, 2 independent experiments). Gray squares indicate decease of the corresponding animal.
- I
Graph showing survival of mice treated with surgery + vehicle or surgery + DEBIO‐0932. The graph represents each mouse with a bar only if the survival is above the median of the group receiving surgery + vehicle (60.5 days) (n = 8 surgery + vehicle and n = 11 surgery + DEBIO‐0932‐treated mice, 2 independent experiments). P value was calculated using two‐tailed t‐test.
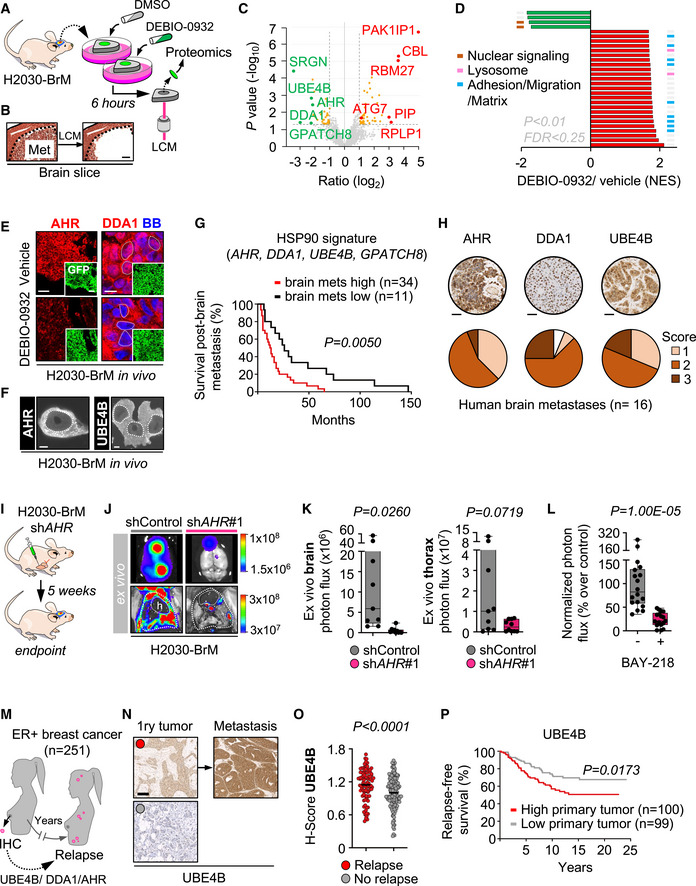
Schema of experimental design. Organotypic cultures with established brain metastases from H2030‐BrM cells were treated with DEBIO‐0932 at 1 µM for 6 h and subjected to laser capture microdissection (LCM) and proteomic profiling.
Representative image of a fully established brain metastasis from H2030‐BrM before and after laser capture microdissection (LCM). The dotted line delimits the metastasis. Scale bar: 100 µm.
Volcano plot with deregulated proteins (red: upregulated; green: downregulated) found in brain metastases treated with DEBIO‐0932 compared to DMSO (n = 3 biological replicates (mice) per condition, n ≥ 12 brain metastases per mouse were pooled together). Proteins with a P < 0.05 and a log2 ratio > 1 or < −1 were defined as deregulated. Gray dotted lines indicate P value and log2 ratio cut offs. The names of the top deregulated proteins are shown.
GSEA of top 25 upregulated (red) and downregulated (green; only four fulfill the filter) pathways upon DEBIO‐0932 treatment. Those biological processes represented with more than one signature are labeled with colored lines.
Representative images showing AHR and DDA1 levels in brain metastases (generated by intracardiac inoculation of H2030‐BrM) found at endpoint of vehicle and DEBIO‐0932‐treated animals. This result was reproduced in 2 independent staining with different brains. BB: bisbenzamide. Scale bars: low magnification (HSP90 and GFP), 50 µm; high magnification (DDA1), 6 µm (dotted lines).
Representative images of squash preparations showing nuclear AHR and UBE4B in established brain metastases from H2030‐BrM generated by intracardiac inoculation. Scale bar: 5 µm. The dashed line surrounds the nucleus.
Kaplan–Meier curves showing significant correlation between worse survival post‐brain metastasis and high expression levels of the HSP90 signature (AHR, DDA1, UBE4B, GPATCH8) in a cohort of 45 breast cancer brain metastasis patients.
Representative images (selected cases obtained from Fig EV6M) and histological score of AHR, DDA1 and UBE4B in human brain metastases (n = 16) according to the signal intensity of the corresponding protein in cancer cells.
Schema of the experimental design. H2030‐BrM cells carrying the corresponding shRNA against AHR or the non‐targeting control were inoculated intracardially into nude mice. Ex vivo BLI of brains and thoracic regions were analyzed 5 weeks after injection of cancer cells. Brains were processed for histological analysis.
Representative images of brains and thorax from shControl and shAHR#1 mice at the endpoint of the experiment.
Quantification of ex vivo BLI of brains and thoracic regions at the endpoint of the experiment. Values are shown in box‐and‐whisker plots where every dot represents a different animal and the line in the box corresponds to the median. The boxes go from the upper to the lower quartiles, and the whiskers go from the minimum to the maximum value (n = 9 shControl mice and n = 10 shAHR#1 mice). P value was calculated using two‐tailed t‐test.
Quantification of the bioluminescence signal emitted by H2030‐BrM established metastases in organotypic cultures at Day 7 normalized by the initial value obtained at Day 0 and normalized to the organotypic cultures treated with DMSO. Day 0 is considered right before addition of the treatment or DMSO. Values are shown in box‐and‐whisker plots where each dot is an organotypic culture and the line in the box corresponds to the median. The boxes go from the upper to the lower quartiles and the whiskers go from the minimum to the maximum value (n = 17 organotypic cultures treated with DMSO; n = 18 organotypic cultures treated with BAY‐218, 2 independent experiments). P value was calculated using two‐tailed t‐test.
Schema depicting the evaluation of a clinical cohort composed of 251 ER+ breast cancer primary tumors with follow‐up to determine the correlation of UBE4B, DDA1 or AHR with relapse.
Representative images of primary tumors with high (red dot) or low (gray dot) UBE4B levels. A few cases of matched primary metastases allowed to evaluate the HSP90‐dependent protein. Scale bar: 100 µm.
H‐score analysis of UBE4B in primary tumors with (red) or without (gray) associated relapse. Values are shown in a scattered plot where each dot is a primary tumor and the line corresponds to the median (n = 100 primary tumors with relapse; n = 147 primary tumors without relapse). P value was calculated using two‐tailed t‐test.
Kaplan–Meier curve comparing relapse‐free survival of primary tumors with high and low values of UBE4B. P value was calculated using log‐rank (Mantel‐Cox) test.
- A
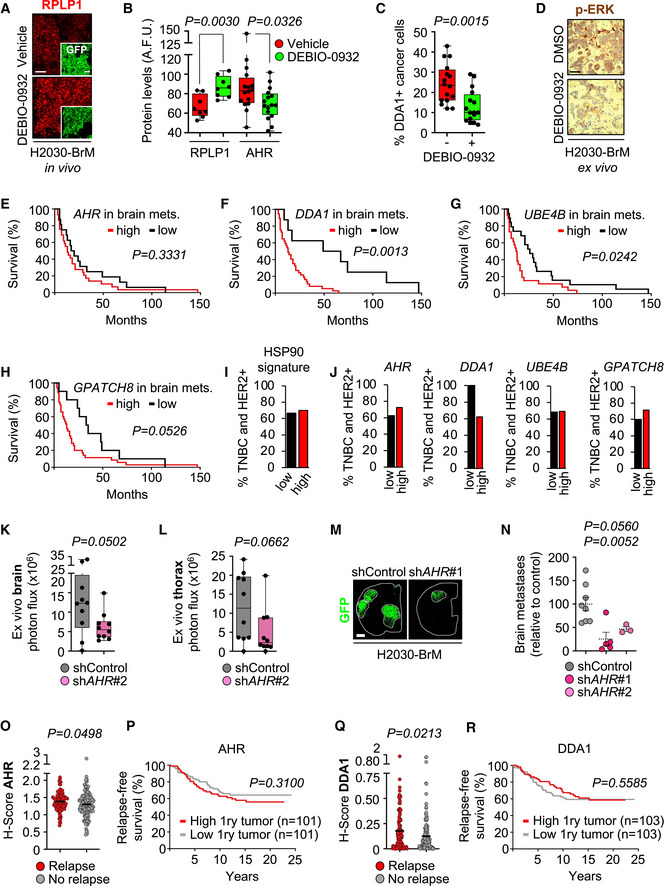
Representative images showing RPLP1 levels in brain metastases (generated by intracardiac inoculation of H2030‐BrM) found at endpoint of vehicle and DEBIO‐0932‐treated animals. This result was reproduced in two independent staining with different brains. Scale bars: 50 µm.
- B
Quantification of RPLP1 and AHR levels shown in (Figs 6E and EV4A) in arbitrary fluorescent units (A.F.U.). Values are shown in box‐and‐whisker plots where each dot is a metastatic lesion and the line in the box corresponds to the median. The boxes go from the upper to the lower quartiles, and the whiskers go from the minimum to the maximum value (n = 8–16 metastatic lesions from 2 to 4 brains per condition, two independent staining with different brains were performed). P value was calculated using two‐tailed t‐test.
- C
Quantification of percentage of nuclear DDA1+ BB+ cells shown in (Fig 6E). Values are shown in box‐and‐whisker plots where each dot is a metastatic lesion, and the line in the box corresponds to the median. The boxes go from the upper to the lower quartiles, and the whiskers go from the minimum to the maximum value (n = 16 metastatic lesions from 4 brains per condition, 2 independent staining with different brains were performed). P value was calculated using two‐tailed t‐test.
- D
Representative images showing p‐ERK levels in organotypic cultures from (Fig 6A). This result was reproduced in three independent staining with organotypic cultures from different mice. Scale bar: 20 µm.
- E–H
Kaplan‐Meier curves showing significant correlation between worse survival post‐brain metastasis and high gene expression levels of AHR (E), DDA1 (F), UBE4B (G), and GPATCH8 (H) in a cohort of 45 breast cancer brain metastasis patients.
- I, J
Distribution of poor prognosis breast cancer subtypes HER2+ and TNBC within the low and high gene expression level cohorts considering the signature (I) or individual genes (J).
- K, L
Quantification of ex vivo BLI of brains (K) and thoracic regions (L) of mice inoculated with H2030‐BrM cells carrying shControl or shAHR#2 at the endpoint of the experiment (5 weeks after injection of cancer cells). Values are shown in box‐and‐whisker plots where every dot represents a different animal and the line in the box corresponds to the median. The boxes go from the upper to the lower quartiles and the whiskers go from the minimum to the maximum value (n = 10 shControl mice and n = 10 shAHR#2 mice). P value was calculated using two‐tailed t‐test.
- M
Representative sections of brains from shControl and shAHR#1 mice 5 weeks (experimental endpoint) after intracardiac inoculation of cancer cells. The dotted lines surround the metastases (GFP+). Scale bar: 1 mm.
- N
Quantification of metastases found in brains inoculated with H2030‐BrM cells with shAHR. Relative metastatic load was normalized to the respective control. Values are shown in dot plots where every dot represents a different brain and the dotted line corresponds to the mean ± s.e.m. (n = 8 shControl; n = 5 shAHR#1; n = 3 shAHR#2 mice). P value was calculated using two‐tailed t‐test.
- O, Q
H‐score analysis of AHR (O) and DDA1 (R) in primary tumors with (red) or without (gray) associated relapse. Values are shown in a scattered plot where each dot is a primary tumor and the line corresponds to the median (n = 100/103 primary tumors with relapse; n = 101/103 primary tumors without relapse, respectively). P value was calculated using two‐tailed t‐test.
- P, R
Kaplan‐Meier curve comparing relapse‐free survival of primary tumors with high and low values of AHR (P) and DDA1 (R). P value was calculated using log‐rank (Mantel‐Cox) test.
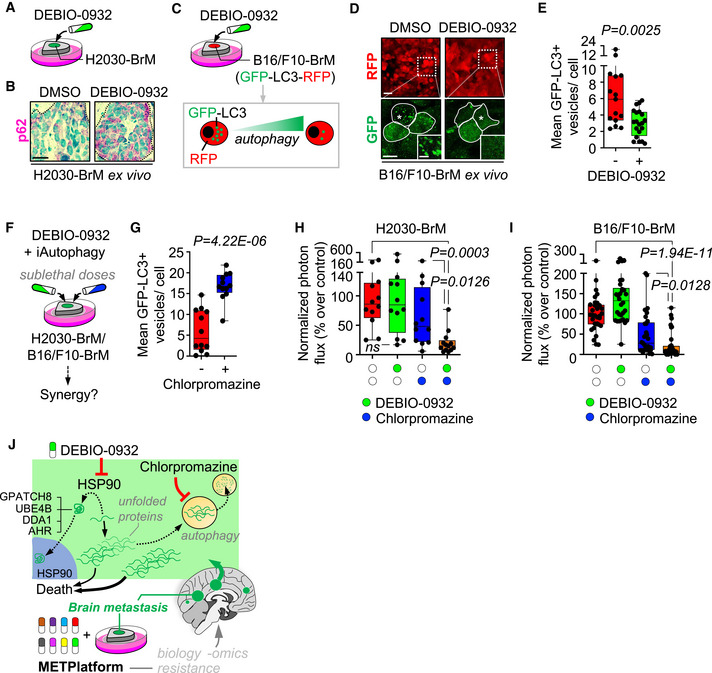
Schema of experimental design. Organotypic cultures with established brain metastases from H2030‐BrM cells were treated with DEBIO‐0932 and evaluated for p62 levels.
Representative images showing p62 levels. This result was reproduced in three independent staining with organotypic cultures from different mice. Dotted lines delimit the metastasis. Scale bar: 10 µm.
Schema of experimental design. Organotypic cultures with brain metastases from B16/F10‐BrM‐GFP‐LC3‐RFP cells were treated with DEBIO‐0932 and monitored for autophagic flux by GFP‐LC3+ puncta (vesicles).
Representative organotypic cultures from the experiment in panel (C). RFP is an internal control probe labeling cancer cells independent of autophagy flux and GFP indicate GFP‐LC3+ puncta. The dotted line in the upper panel delimits a high magnification area shown in the lower panel respect to the GFP signal derived from GFP‐LC3 accumulation. Dotted lines in lower panel surround individual cancer cells. Asterisk labels the area in the cell magnified in the high magnification panel showing the GFP‐LC3+ puncta. Scale bar: low magnification, 25 µm; high magnification (cells), 10 µm; high magnification (puncta), 2.5 µm.
Quantification of GFP‐LC3+ vesicles per cell of the experiment in panel (C). Values are shown in box‐and‐whisker plots where every dot represents a field of view of an organotypic culture and the line in the box corresponds to the median. The boxes go from the upper to the lower quartiles, and the whiskers go from the minimum to the maximum value (DMSO: n = 15 fields of view, 2,232 cancer cells from 3 organotypic cultures; DEBIO‐0932: n = 20 fields of view, 3,260 cancer cells from 4 organotypic cultures). P value was calculated using two‐tailed t‐test.
Schema of experimental design. Organotypic cultures with established brain metastases were treated with DEBIO‐0932 and autophagy inhibitors at sublethal doses.
Quantification of GFP‐LC3+ vesicles per cell in organotypic cultures with brain metastases from B16/F10‐BrM‐GFP‐LC3‐RFP cells treated with chlorpromazine (20 µM) and monitored for autophagic flux by GFP‐LC3+ puncta (vesicles). Values are shown in box‐and‐whisker plots where every dot represents a field of view of an organotypic culture and the line in the box corresponds to the median. The boxes go from the upper to the lower quartiles and the whiskers go from the minimum to the maximum value (DMSO: n = 12 fields of view, 1,919 cancer cells from 3 organotypic cultures; chlorpromazine: n = 12 fields of view, 1,759 cancer cells from 3 organotypic cultures). P value was calculated using two‐tailed t‐test.
Quantification of the bioluminescence signal emitted by H2030‐BrM cells in each organotypic culture with established brain metastases at Day 3 normalized by the initial value at Day 0 (before the addition of any treatment; DEBIO‐0932 was added at 100 nM and chlorpromazine at 20 µM) and normalized to the organotypic cultures treated with DMSO. Values are shown in box‐and‐whisker plots where every dot represents an organotypic culture and the line in the box corresponds to the median. The boxes go from the upper to the lower quartiles and the whiskers go from the minimum to the maximum value (n = 12–13 organotypic cultures per experimental condition, 3 independent experiments). P value was calculated using two‐tailed t‐test.
Quantification of the bioluminescence signal emitted by B16/F10‐BrM cells in each condition (DEBIO‐0932 was added at 100 nM and chlorpromazine at 15 µM) at Day 3 normalized by the initial value obtained at Day 0 and normalized to the organotypic cultures treated with DMSO. Day 0 is considered 12–16 h after the addition of B16/F10‐BrM cancer cells and treatment or DMSO. Values are shown in box‐and‐whisker plots where each dot is an organotypic culture and the line in the box corresponds to the median. The boxes go from the upper to the lower quartiles, and the whiskers go from the minimum to the maximum value (n = 30–33 organotypic cultures per experimental condition, 4 independent experiments). P value was calculated using two‐tailed t‐test.
Graphical summary. METPlatform is a valuable tool for metastasis research that integrates drug‐screening and omic approaches to study pharmacological and biological vulnerabilities. We demonstrate that one vulnerability corresponds to the dependency on HSP90. The BBB‐permeable HSP90 inhibitor DEBIO‐0932 is an effective therapeutic strategy against established brain metastasis and the analysis of such phenotype with in situ proteomics revealed potential novel mediators of brain metastasis downstream HSP90. At the same time, autophagy appears as an actionable mechanism of resistance upon HSP90 inhibition, allowing design of rationale combinations using autophagy inhibitors and DEBIO‐0932 to target brain metastasis more effectively if appropriate drugs could be combined in vivo.
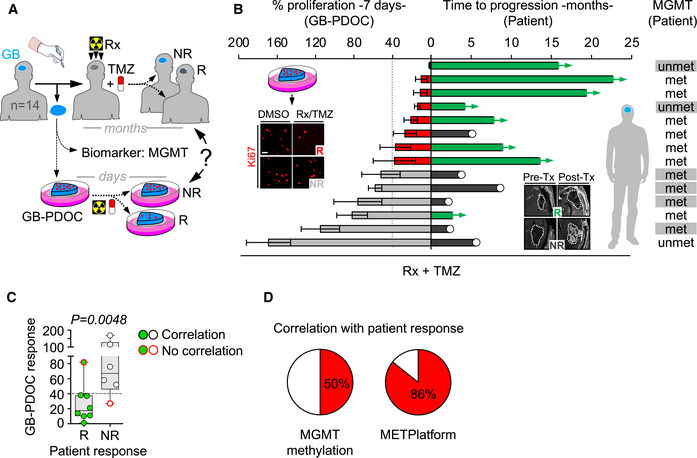
Schema of experimental design using GB‐PDOC.
Correlation between response in GB‐PDOC (left side of the graph) and its respective patient (right side of the graph). Response in GB‐PDOCs was obtained by quantification of number of proliferative cancer cells found in Rx + TMZ treated normalized to DMSO‐treated (100%) PDOCs from the same patient. Representative GB‐PDOC responding (R) or not (NR) to the standard of care that was provided ex vivo (Radiation (Rx): 2 × 10 Gy + temozolomide (TMZ) 250 µM) are shown. Scale bar: 50 µm. Values are shown as mean ± s.e.m. (n = 3–6 PDOCs per experimental condition per patient, each patient is represented in an individual bar. Fourteen patients included; each patient is an independent experiment). Time to progression of the patients after neurosurgery is represented in months. Response to Rx + TMZ was evaluated by volumetric measurement of the lesion (dashed line) based on MRI before and after the treatment. Representative patients responding (R) or not (NR) to the standard of care are shown. A white circle indicates progressive disease. Patients with ongoing response to Rx + TMZ (stable disease) are indicated with green bars. MGMT promoter methylation status is shown for each patient (met: methylated; unmet: unmethylated). N/A: not available.
Correlation between GB‐PDOC and patient responses. GB‐PDOC response is indicated by the mean value in percentage of proliferation post‐treatment, where 40% represents the threshold. Patients are classified as responder (R) (green dots, 8 patients) or non‐responder (NR) (white dots, 6 patients) according to the MRI evaluation. Values are shown in box‐and‐whisker plots where each dot is a patient and the corresponding GB‐PDOC and the line in the box corresponds to the median. The boxes go from the upper to the lower quartiles and the whiskers go from the minimum to the maximum value. P value was calculated using two‐tailed t‐test.
Pie charts representing the percentage of patients where MGMT methylation status correlates with the expected therapeutic response in the patient and the same respect to the response of the GB‐PCOC in METPlatform.
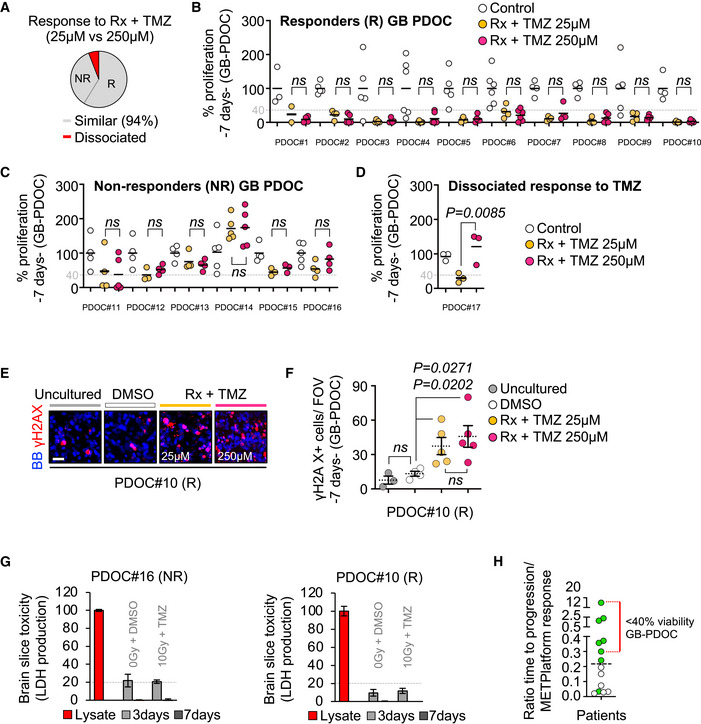
- A
Pie chart categorizing the 17 GB‐PDOC treated with radiation (Rx) and temozolomide (TMZ) into responders (R) and non‐responders (NR) independently of the dose of TMZ given (gray). Red area is labeling the single PDOC with a non‐homogeneous response to the two different doses of TMZ (D).
- B–D
Quantification of the impact of Rx + TMZ on the proliferation of cancer cells from GB‐PDOC. Values are normalized to the respective control without treatment. Each dot represents an organotypic culture from each GB‐PDOC. GB‐PDOC was classified as responder when the mean (line in each dot cluster) is below 40%. P value was calculated using two‐tailed t‐test.
- E
Representative images of a responder GB‐PDOC stained with a DNA‐damage marker, γ‐H2AX (red). BB: bisbenzamide. Scale bar: 25 µm.
- F
Quantification of the number of γ‐H2AX+ cancer cells in the GB‐PDOC shown in (E). Each dot represents and individual organotypic culture where the mean number of cells positive for the DNA‐damage marker was measured. The dotted line represents the mean ± s.e.m. (n = 3, uncultured organotypic slices from the tumor; n = 4 GB‐PDOC treated with DMSO (1%); n = 5 GB‐PDOC treated with Rx + TMZ (25 μM); n = 5 GB‐PDOC treated with Rx + TMZ (250 μM)). P value was calculated using two‐tailed t‐test.
- G
Quantification of LDH levels in the conditioned media of organotypic slices cultured during 3 and 7 days relative to a lysate of the same GB‐PDOC. Values are shown as mean + s.e.m. (n = 3 organotypic cultures per experimental condition, each graph correspond to an individual GB‐PDOC). LDH levels at 7 days measure the accumulation of the enzyme in the media from day 3 on.
- H
Post hoc quantification of the ratio between the number of months with stable disease in each patient (at cut off September 2021) and the corresponding % of proliferation after GB‐PDOC treatment in METPlatform. The dotted line indicates the median. Each dot corresponds to a patient. Green dots: patient with stable disease; white dots: patients with progressive disease. The red line labels those patients with a reduction above 40% in cancer cell proliferation in the corresponding GB‐PDOC.
References
-
- Antonova A, Hummel B, Khavaran A, Redhaber DM, Aprile‐Garcia F, Rawat P, Gundel K, Schneck M, Hansen EC, Mitschke J et al (2019) Heat‐shock protein 90 controls the expression of cell‐cycle genes by stabilizing metazoan‐specific host‐cell factor HCFC1. Cell Rep 29: 1645–1659 - PubMed
-
- Bagatell R, Paine‐Murrieta GD, Taylor CW, Pulcini EJ, Akinaga S, Benjamin IJ, Whitesell L (2000) Induction of a heat shock factor 1‐dependent stress response alters the cytotoxic activity of hsp90‐binding agents. Clin Cancer Res 6: 3312–3318 - PubMed
-
- Bao R, Lai C‐J, Qu H, Wang D, Yin L, Zifcak B, Atoyan R, Wang J, Samson M, Forrester J et al (2009) CUDC‐305, a novel synthetic HSP90 inhibitor with unique pharmacologic properties for cancer therapy. Clin Cancer Res 15: 4046–4057 - PubMed
Publication types
MeSH terms
Substances
Associated data
- Actions
- Actions
Grants and funding
LinkOut - more resources
Full Text Sources
Other Literature Sources
Medical
Molecular Biology Databases
Research Materials
