. 2022 Feb;2(2):e372.
doi: 10.1002/cpz1.372.

Assessing Mitochondrial DNA Release into the Cytosol and Subsequent Activation of Innate Immune-related Pathways in Mammalian Cells

Affiliations

Assessing Mitochondrial DNA Release into the Cytosol and Subsequent Activation of Innate Immune-related Pathways in Mammalian Cells

Joshua D Bryant et al. Curr Protoc. 2022 Feb.

Erratum in

Abstract

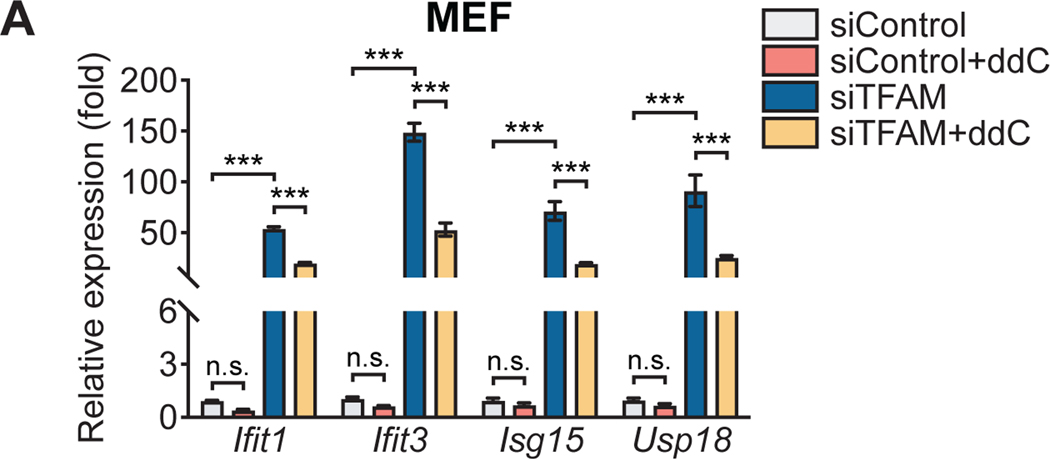
Mitochondria have emerged as key drivers of mammalian innate immune responses, functioning as signaling hubs to trigger inflammation and orchestrating metabolic switches required for phagocyte activation. Mitochondria also contain damage-associated molecular patterns (DAMPs), molecules that share similarity with pathogen-associated molecular patterns (PAMPs) and can engage innate immune sensors to drive inflammation. The aberrant release of mitochondrial DAMPs during cellular stress and injury is an increasingly recognized trigger of inflammatory responses in human diseases. Mitochondrial DNA (mtDNA) is a particularly potent DAMP that engages multiple innate immune sensors, although mounting evidence suggests that cytosolic mtDNA is primarily detected via the cyclic GMP-AMP synthase-stimulator of interferon genes (cGAS-STING) pathway. cGAS and STING are widely expressed in mammalian cells and serve as key regulators of type I interferon and cytokine expression in both infectious and inflammatory diseases. Despite growing roles for the mtDNA-cGAS-STING axis in human disease, assays to quantify mtDNA release into the cytosol and approaches to link mtDNA to cGAS-STING signaling are not standardized, which increases the possibility for experimental artifacts and misinterpretation of data. Here, we present a series of protocols for assaying the release of mtDNA into the cytosol and subsequent activation of innate immune signaling in mammalian cells. We highlight genetic and pharmacological approaches to induce and inhibit mtDNA release from mitochondria. We also describe immunofluorescence microscopy and cellular fractionation assays to visualize morphological changes in mtDNA and quantify mtDNA accumulation in the cytosol. Finally, we include protocols to examine mtDNA-dependent cGAS-STING activation by RT-qPCR and western blotting. These methods can be performed with standard laboratory equipment and are highly adaptable to a wide range of mammalian cell types. They will permit researchers working across the spectrum of biological and biomedical sciences to accurately and reproducibly measure cytosolic mtDNA release and resulting innate immune responses. © 2022 Wiley Periodicals LLC. Basic Protocol 1: siRNA-mediated knockdown of TFAM to induce mtDNA instability, cytosolic release, and activation of the cGAS-STING pathway Alternate Protocol: Pharmacological induction of mtDNA release and cGAS-STING activation using ABT-737 and Q-VD-OPH Basic Protocol 2: Isolation and quantitation of DNA from cytosolic, mitochondrial, and nuclear fractions Basic Protocol 3: Pharmacological inhibition of mtDNA replication and release.

Keywords: STING; cGAS; innate immunity; mitochondria; mitochondrial DNA.


Conflict of interest statement

CONFLICT OF INTEREST STATEMENT:

The authors declare that they have no competing interests.

Figures

Figure 1:
Figure 1:. Graphical overview of the protocols and experimental workflows described in this article.
Mitochondrial DNA (mtDNA); cyclic GMP-AMP synthase (cGAS); stimulator or interferon genes (STING); interferon-stimulated gene (ISG); ABT-737 (Bcl-2 inhibitor); Q-VD-OPH (pan-caspase inhibitor); Nonidet P-40 (NP-40); sodium dodecyl sulfate (SDS); 2’,3′-Dideoxcytidine (ddC); VBIT-4 (Voltage-dependent anion channel inhibitor).
Figure 2:
Figure 2:. Triggering mtDNA release into the cytosol induces type I interferons (IFN-I) and interferon-stimulated gene (ISG) expression in mouse and human fibroblasts.
(A-B) Mouse embryonic fibroblasts (MEFs) (A) or human foreskin fibroblasts (HFFs) (B) were transfected with Control (siControl) or Transcription Factor A, mitochondrial (TFAM) (siTFAM) siRNAs for 72 hrs. RNA was extracted and reverse transcribed into cDNA, and cDNA was then subjected to SYBR Green-based qPCR analysis to profile TFAM and ISG (e.g. Cxcl10, Ifit1, Ifit3, Ifi44) expression. (C) HFF cells were transfected with siRNAs for 72 hrs. Proteins were extracted subjected to western blotting using antibodies against TFAM, heat shock protein 60 (HSP60), and ISGs (RIG-I, STAT1, IFIT2). (D) MEFs were treated with 10 μM ABT-737 (Bcl-2 inhibitor) and 10 μM Q-VD-OPH (pan-caspase inhibitor) for 6 (left) or 24 (right) hours. RNA was extracted and reverse transcribed into cDNA, and cDNA was then subjected to SYBR Green-based qPCR analysis to profile ISG (e.g., Cxcl10, Ifit1, Ifi44, Ifnb1) expression. In A, B and D, plots show mean fold change and error bars represent standard error of the mean. N=3. Statistical significance was determined using unpaired Student’s t test after Shapiro-Wilk normality test. **P < 0.01 and ***P < 0.001.
Figure 3:
Figure 3:. Knockdown of transcription factor A, mitochondrial (TFAM) results in mitochondrial DNA (mtDNA) nucleoid enlargement and mitochondrial network elongation in mouse fibroblasts.
(A) Mouse embryonic fibroblasts (MEFs) were mounted on coverslips and transfected with Control (siControl) or TFAM (siTFAM) siRNAs for 72 hrs. Cells were fixed and stained with primary antibodies against DNA, TFAM, and heat shock protein 60 (HSP60). After counterstaining with fluorescently conjugated secondary antibodies, coverslips were mounted on slides and imaged on a confocal microscope equipped with a 60X oil-immersion objective. Inset panels represent 3X digital zoom. (B) Example image of how to bend the tip of a 21G needle to aid in picking up coverslips.
Figure 4:
Figure 4:. Graphical overview of the experimental workflow described in Basic Protocol 2.
Western blot (WB); Nonidet P-40 (NP-40); sodium dodecyl sulfate (SDS); supernatant (sup.); mouse embryonic fibroblasts (MEFs).
Figure 5:
Figure 5:. Transcription factor A, mitochondrial (TFAM) deficient cells exhibit elevated levels of mitochondrial DNA (mtDNA) in the cytosol.
(A-C) TFAM knockdown mouse embryonic fibroblasts (MEFs) were subjected to subcellular fractionation as described in Basic Protocol 2. DNA was isolated from whole cell (WCE) and cytosolic extracts, and subjected to SYBR Green-based qPCR analysis to quantitate nuclear (TERT) and mitochondrial (D-loop) DNA using specific primers. Raw Cq values from WCE and cytosolic extracts are shown (A). Raw values and formulas for calculating total cellular mtDNA abundance in WCE are shown, and plotted on the right, as mean values (B). Raw values and formulas for calculating mtDNA abundance in cytosolic extracts are shown, and plotted on the right, as mean values (C). N=3. Statistical significance was determined using unpaired Student’s t test after Shapiro-Wilk normality test. **P < 0.01 and ***P < 0.001. Error bars represent standard error of the mean.
Figure 6:
Figure 6:. Depletion of mitochondrial DNA reduces interferon-stimulated gene (ISG) expression induced by cytosolic mtDNA.
Mouse embryonic fibroblasts (MEFs) (A) or human foreskin fibroblasts (HFFs) (B) were transfected with Control (siControl) or Transcription Factor A, mitochondrial (TFAM) (siTFAM) siRNAs for 72 hrs in the presence or absence of 150 μM 2’,3′-Dideoxcytidine (ddC). RNA was extracted and reverse transcribed into cDNA, and cDNA was then subjected to SYBR Green-based qPCR analysis to profile ISG (Ifit1, Ifit3, Isg15, Usp18) expression. Plots show mean fold change and error bars represent standard error of the mean. N=3. Statistical significance was determined using unpaired Student’s t test after Shapiro-Wilk normality test. **P < 0.01 and ***P < 0.001.

References

    1. Ablasser A, Goldeck M, Cavlar T, Deimling T, Witte G, Röhl I, Hopfner K-P, Ludwig J, and Hornung V 2013. cGAS produces a 2’–5′-linked cyclic dinucleotide second messenger that activates STING. Nature 498:380–384. - PMC - PubMed
    1. Ader NR, Hoffmann PC, Ganeva I, Borgeaud AC, Wang C, Youle RJ, and Kukulski W 2019. Molecular and topological reorganizations in mitochondrial architecture interplay during Bax-mediated steps of apoptosis. eLife 8:e40712. - PMC - PubMed
    1. Akira S, and Takeda K 2004. Toll-like receptor signalling. Nature Reviews Immunology 4:499–511. - PubMed
    1. Andersen CL, Jensen JL, and Ørntoft TF 2004. Normalization of real-time quantitative reverse transcription-PCR data: a model-based variance estimation approach to identify genes suited for normalization, applied to bladder and colon cancer data sets. Cancer Research 64:5245–5250. - PubMed
    1. Bai J, and Liu F 2019. The cGAS-cGAMP-STING Pathway: A Molecular Link Between Immunity and Metabolism. Diabetes 68:1099–1108. - PMC - PubMed