Editorial
. 2022 May 5;3(3):194-207.
doi: 10.1158/2643-3230.BCD-21-0160.

Integrated Genomic Analysis Identifies UBTF Tandem Duplications as a Recurrent Lesion in Pediatric Acute Myeloid Leukemia

Affiliations
Editorial

Integrated Genomic Analysis Identifies UBTF Tandem Duplications as a Recurrent Lesion in Pediatric Acute Myeloid Leukemia

Masayuki Umeda et al. Blood Cancer Discov. .

Abstract

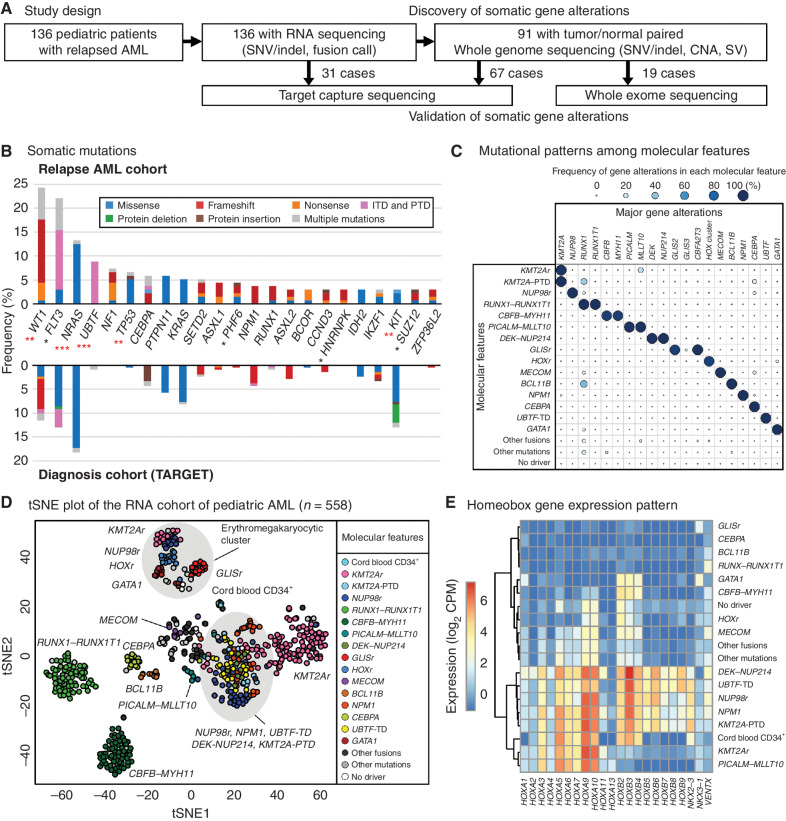
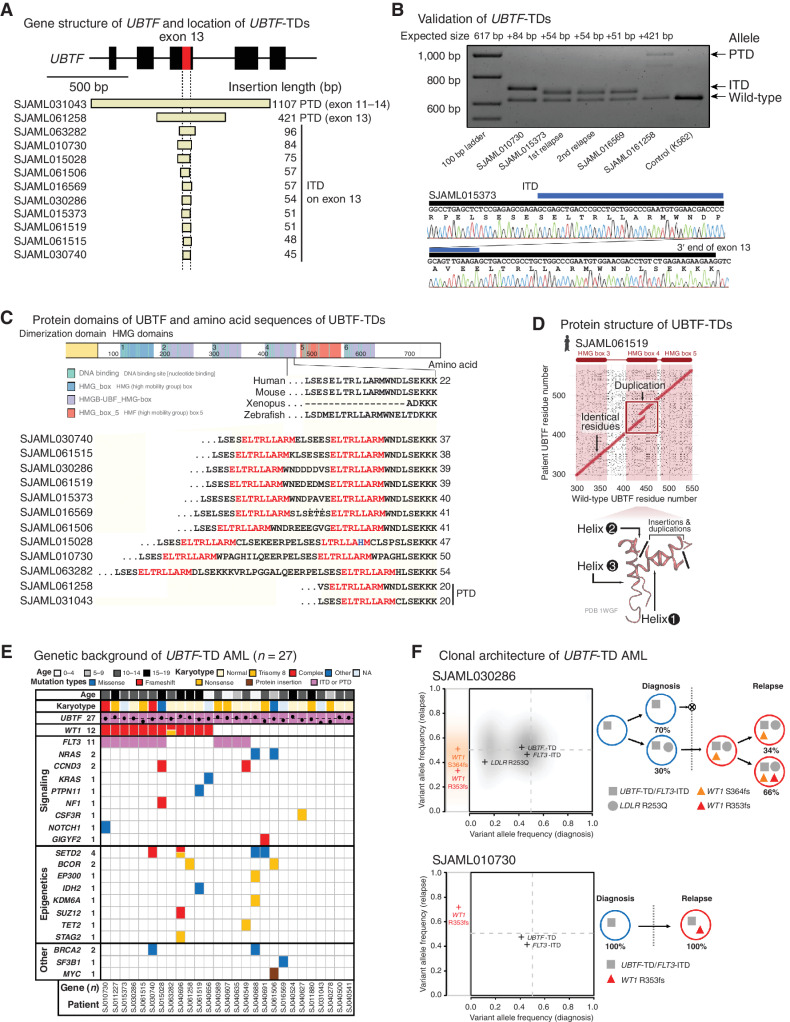
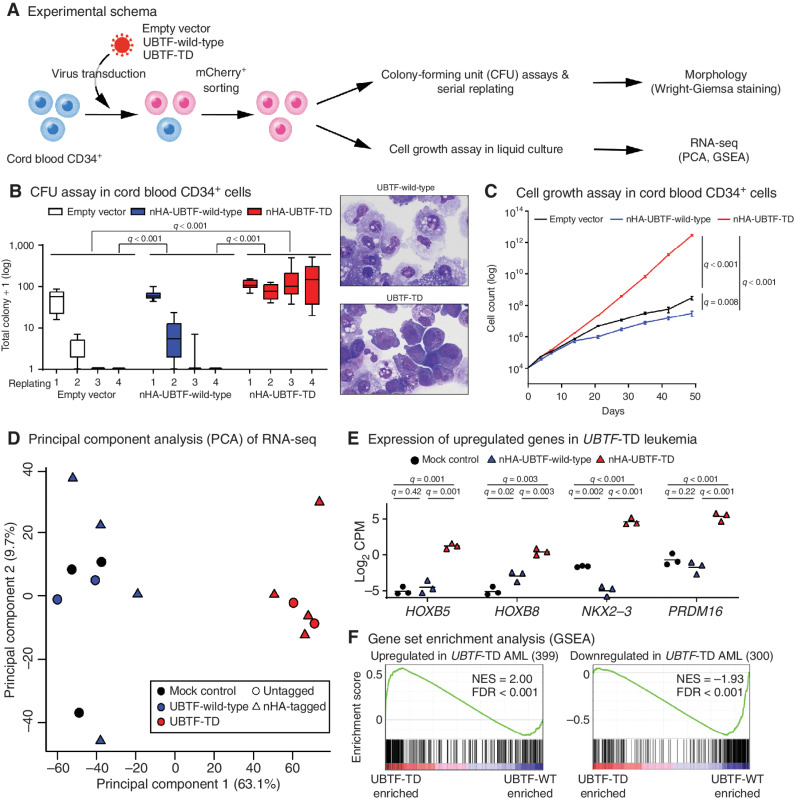
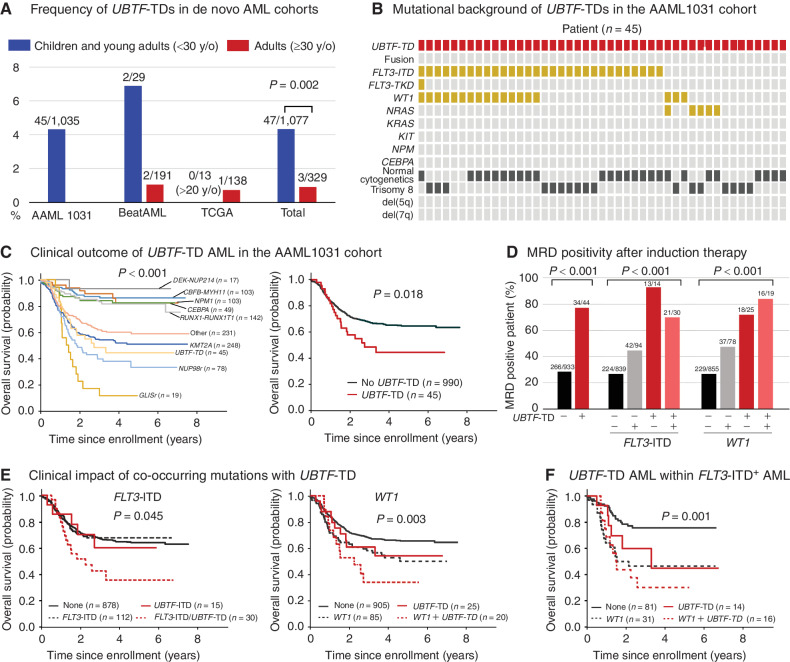
The genetics of relapsed pediatric acute myeloid leukemia (AML) has yet to be comprehensively defined. Here, we present the spectrum of genomic alterations in 136 relapsed pediatric AMLs. We identified recurrent exon 13 tandem duplications (TD) in upstream binding transcription factor (UBTF) in 9% of relapsed AML cases. UBTF-TD AMLs commonly have normal karyotype or trisomy 8 with cooccurring WT1 mutations or FLT3-ITD but not other known oncogenic fusions. These UBTF-TD events are stable during disease progression and are present in the founding clone. In addition, we observed that UBTF-TD AMLs account for approximately 4% of all de novo pediatric AMLs, are less common in adults, and are associated with poor outcomes and MRD positivity. Expression of UBTF-TD in primary hematopoietic cells is sufficient to enhance serial clonogenic activity and to drive a similar transcriptional program to UBTF-TD AMLs. Collectively, these clinical, genomic, and functional data establish UBTF-TD as a new recurrent mutation in AML.

Significance: We defined the spectrum of mutations in relapsed pediatric AML and identified UBTF-TDs as a new recurrent genetic alteration. These duplications are more common in children and define a group of AMLs with intermediate-risk cytogenetic abnormalities, FLT3-ITD and WT1 alterations, and are associated with poor outcomes. See related commentary by Hasserjian and Nardi, p. 173. This article is highlighted in the In This Issue feature, p. 171.


Figures

Figure 1. Molecular landscape of relapsed pediatric acute myeloid leukemia (AML). A, The study design. Tumor samples from 136 pediatric patients with relapsed AML were subjected to RNA-seq followed by WGS, WES, and TCS when patient samples were available. B, The ratio of patients with recurrent somatic coding mutations in the relapsed AML cohort. The color in each bar represents the type of mutation. Asterisks denote the significance of the difference with the TARGET cohort calculated by Fisher exact test (*, P < 0.05; **, P < 0.01; ***, P < 0.001) and red asterisks denote q < 0.05 after adjustment for multiple testing by the Benjamini-Hochberg method. C, Mutually exclusive gene alteration patterns. Each dot's color and size denote the ratio of patients with the gene alteration. D, t-Distributed Stochastic Neighbor Embedding (tSNE) of expression profiles of the pediatric AML cohort (n = 558) performed with the top 250 most variably expressed genes. The color of each dot denotes the molecular feature of the sample. E, An expression heat map of representative homeobox genes in each molecular feature. The colors denote averaged log2 CPM (counts per million) within each molecular feature.
Figure 1.
Molecular landscape of relapsed pediatric acute myeloid leukemia (AML). A, The study design. Tumor samples from 136 pediatric patients with relapsed AML were subjected to RNA-seq followed by WGS, WES, and TCS when patient samples were available. B, The ratio of patients with recurrent somatic coding mutations in the relapsed AML cohort. The color in each bar represents the type of mutation. Asterisks denote the significance of the difference with the TARGET cohort calculated by Fisher exact test (*, P < 0.05; **, P < 0.01; ***, P < 0.001) and red asterisks denote q < 0.05 after adjustment for multiple testing by the Benjamini-Hochberg method. C, Mutually exclusive gene alteration patterns. Each dot's color and size denote the ratio of patients with the gene alteration. D, t-Distributed Stochastic Neighbor Embedding (tSNE) of expression profiles of the pediatric AML cohort (n = 558) performed with the top 250 most variably expressed genes. The color of each dot denotes the molecular feature of the sample. E, An expression heat map of representative homeobox genes in each molecular feature. The colors denote averaged log2 CPM (counts per million) within each molecular feature.
Figure 2. UBTF-TDs in pediatric AML. A, Exons 11–15 of UBTF gene and the location of UBTF-TDs (n = 12) identified in the relapse AML cohort. B, The results of validation of UBTF-TDs in the relapsed AML cohort by polymerase chain reaction (PCR) and Sanger sequencing. Blue bars denote duplicated sequences. C, Illustrative schema of UBTF protein and amino acid sequences within the HMG domain 4 of both UBTF-wild-type and UBTF-TDs. A part of UBTF-TDs encoded on exon 13 of UBTF genes is shown in comparison with UBTF-wild-type of human and other vertebrates. Amino acid sequences highlighted in red denote leucine-rich sequences duplicated in all UBTF-TDs. D, Comparisons of amino acid sequences of UBTF-wild-type and UBTF-TD at the likely insertion site in helix 2 of HMB box 4 for observed UBTF-TDs. E, Mutational landscape of UBTF-TD AML. F, Clonal dynamics of WT1 mutations in UBTF-TD AMLs. Comparison of variant allele frequency between diagnosis (x-axis) and relapse (y-axis) tumors for cases SJAML030286 and SJAML010730 (left). SNVs/Indels detected from SJAML030286 WGS were drawn as density clouds, and representative mutations for each subclone were marked by crosses. Relapse-specific mutations are shown to the left. The clonal evolution scheme for the patients imputed from bulk WGS data (SJAML030286) or RNA-seq and TCS (SJAML010730; right).
Figure 2.
UBTF-TDs in pediatric AML. A, Exons 11–15 of UBTF gene and the location of UBTF-TDs (n = 12) identified in the relapse AML cohort. B, The results of validation of UBTF-TDs in the relapsed AML cohort by polymerase chain reaction (PCR) and Sanger sequencing. Blue bars denote duplicated sequences. C, Illustrative schema of UBTF protein and amino acid sequences within the HMG domain 4 of both UBTF-wild-type and UBTF-TDs. A part of UBTF-TDs encoded on exon 13 of UBTF genes is shown in comparison with UBTF-wild-type of human and other vertebrates. Amino acid sequences highlighted in red denote leucine-rich sequences duplicated in all UBTF-TDs. D, Comparisons of amino acid sequences of UBTF-wild-type and UBTF-TD at the likely insertion site in helix 2 of HMB box 4 for observed UBTF-TDs. E, Mutational landscape of UBTF-TD AML. F, Clonal dynamics of WT1 mutations in UBTF-TD AMLs. Comparison of variant allele frequency between diagnosis (x-axis) and relapse (y-axis) tumors for cases SJAML030286 and SJAML010730 (left). SNVs/Indels detected from SJAML030286 WGS were drawn as density clouds, and representative mutations for each subclone were marked by crosses. Relapse-specific mutations are shown to the left. The clonal evolution scheme for the patients imputed from bulk WGS data (SJAML030286) or RNA-seq and TCS (SJAML010730; right).
Figure 3. In vitro modeling of UBTF-TD. A, Experimental design of in vitro modeling of UBTF-TD in cord blood (CB) CD34+ cells. B, The effects of UBTF-wild-type and UBTF-TD overexpression in colony-forming potential of cord blood CD34+ cells. Boxplots of logged colony count from technical replicates (Empty vector: n = 7, UBTF-wild-type: n = 12, UBTF-TD: n = 12) from five independent experiments are shown. A box represents quartiles, and whiskers represents max and minimal values. Statistical significances were calculated by ANOVA test followed by pairwise comparisons and adjustment with Tukey method (left). Wright-Giemsa staining of cells derived from the second replating. Both images are at equal magnification (60×; right). C, The effects of UBTF-wild-type and UBTF-TD overexpression on cell growth of CD34+ cord blood in liquid culture. Experimental design and error bars are the same in Fig. 3B. Statistical significances were calculated at day 49 by Student t test followed by adjustment for multiple testing by the Benjamini-Hochberg method. D, Principal Component Analysis (PCA) of transcriptional profiles of transduced cord blood CD34+ cells at day 32 (Empty vector: n = 3, UBTF-wild-type: n = 6, UBTF-TD: n = 6). E, Expression of representative genes upregulated in UBTF-TD AMLs. Bars denote mean from biological triplicates from which data for all conditions were available. Statistical significances were calculated as in Fig. 3C. F, Gene Set Enrichment Analysis (GSEA) between nHA-UBTF-WT (n = 3) and nHA-UBTF-TD (n = 3) transduced conditions using gene sets identified in patient samples (Supplementary Table S21).
Figure 3.
In vitro modeling of UBTF-TD. A, Experimental design of in vitro modeling of UBTF-TD in cord blood (CB) CD34+ cells. B, The effects of UBTF-wild-type and UBTF-TD overexpression in colony-forming potential of cord blood CD34+ cells. Boxplots of logged colony count from technical replicates (Empty vector: n = 7, UBTF-wild-type: n = 12, UBTF-TD: n = 12) from five independent experiments are shown. A box represents quartiles, and whiskers represents max and minimal values. Statistical significances were calculated by ANOVA test followed by pairwise comparisons and adjustment with Tukey method (left). Wright-Giemsa staining of cells derived from the second replating. Both images are at equal magnification (60×; right). C, The effects of UBTF-wild-type and UBTF-TD overexpression on cell growth of CD34+ cord blood in liquid culture. Experimental design and error bars are the same in Fig. 3B. Statistical significances were calculated at day 49 by Student t test followed by adjustment for multiple testing by the Benjamini-Hochberg method. D, Principal Component Analysis (PCA) of transcriptional profiles of transduced cord blood CD34+ cells at day 32 (Empty vector: n = 3, UBTF-wild-type: n = 6, UBTF-TD: n = 6). E, Expression of representative genes upregulated in UBTF-TD AMLs. Bars denote mean from biological triplicates from which data for all conditions were available. Statistical significances were calculated as in Fig. 3C. F, Gene Set Enrichment Analysis (GSEA) between nHA-UBTF-WT (n = 3) and nHA-UBTF-TD (n = 3) transduced conditions using gene sets identified in patient samples (Supplementary Table S21).
Figure 4. Prevalence and clinical outcome of UBTF-TDs in de novo AML cohorts. A, Frequencies of UBTF-TDs in published de novo AML cohorts in Supplementary Table S25. Statistical significance was calculated between the total pediatric and adult cohorts by Fisher exact test. B, Cytogenetic and genetic background of UBTF-TD cases in the AAML1031 cohort. C, Clinical outcomes of UBTF-TD cases and AML with major molecular features in the AAML1031 cohort. D, Minimal residual disease (MRD) positivity of UBTF-TD case with cooperating mutations of FLT3-ITD or WT1. E, Clinical outcomes of UBTF-TD cases with cooperating mutations of FLT3-ITD or WT1. F, Subgroup analysis of outcomes of UBTF-TDs with or without WT1 mutations within FLT3+ AMLs. In C, E, and F, the statistical significance of variables was tested with the log-rank test. In D, the statistical significance was calculated by Pearson χ2 test.
Figure 4.
Prevalence and clinical outcome of UBTF-TDs in de novo AML cohorts. A, Frequencies of UBTF-TDs in published de novo AML cohorts in Supplementary Table S25. Statistical significance was calculated between the total pediatric and adult cohorts by Fisher exact test. B, Cytogenetic and genetic background of UBTF-TD cases in the AAML1031 cohort. C, Clinical outcomes of UBTF-TD cases and AML with major molecular features in the AAML1031 cohort. D, Minimal residual disease (MRD) positivity of UBTF-TD case with cooperating mutations of FLT3-ITD or WT1. E, Clinical outcomes of UBTF-TD cases with cooperating mutations of FLT3-ITD or WT1. F, Subgroup analysis of outcomes of UBTF-TDs with or without WT1 mutations within FLT3+ AMLs. In C, E, and F, the statistical significance of variables was tested with the log-rank test. In D, the statistical significance was calculated by Pearson χ2 test.

Comment in

Comment on

References

    1. Rubnitz JE. How I treat pediatric acute myeloid leukemia. Blood 2012;119:5980–8. - PMC - PubMed
    1. Cornelissen JJ, Gratwohl A, Schlenk RF, Sierra J, Bornhauser M, Juliusson Get al. . The European LeukemiaNet AML Working Party consensus statement on allogeneic HSCT for patients with AML in remission: an integrated-risk adapted approach. Nat Rev Clin Oncol 2012;9:579–90. - PubMed
    1. Kaspers GJ, Zimmermann M, Reinhardt D, Gibson BE, Tamminga RY, Aleinikova Oet al. . Improved outcome in pediatric relapsed acute myeloid leukemia: results of a randomized trial on liposomal daunorubicin by the International BFM Study Group. J Clin Oncol 2013;31:599–607. - PubMed
    1. Hollink IH, van den Heuvel-Eibrink MM, Arentsen-Peters ST, Pratcorona M, Abbas S, Kuipers JEet al. . NUP98/NSD1 characterizes a novel poor prognostic group in acute myeloid leukemia with a distinct HOX gene expression pattern. Blood 2011;118:3645–56. - PubMed
    1. de Rooij JD, Branstetter C, Ma J, Li Y, Walsh MP, Cheng Jet al. . Pediatric non-Down syndrome acute megakaryoblastic leukemia is characterized by distinct genomic subsets with varying outcomes. Nat Genet 2017;49:451–6. - PMC - PubMed