. 2022 Mar 3;185(5):831-846.e14.
doi: 10.1016/j.cell.2022.01.017. Epub 2022 Feb 16.

Mucosal fungi promote gut barrier function and social behavior via Type 17 immunity

Affiliations

Mucosal fungi promote gut barrier function and social behavior via Type 17 immunity

Irina Leonardi et al. Cell. .

Abstract

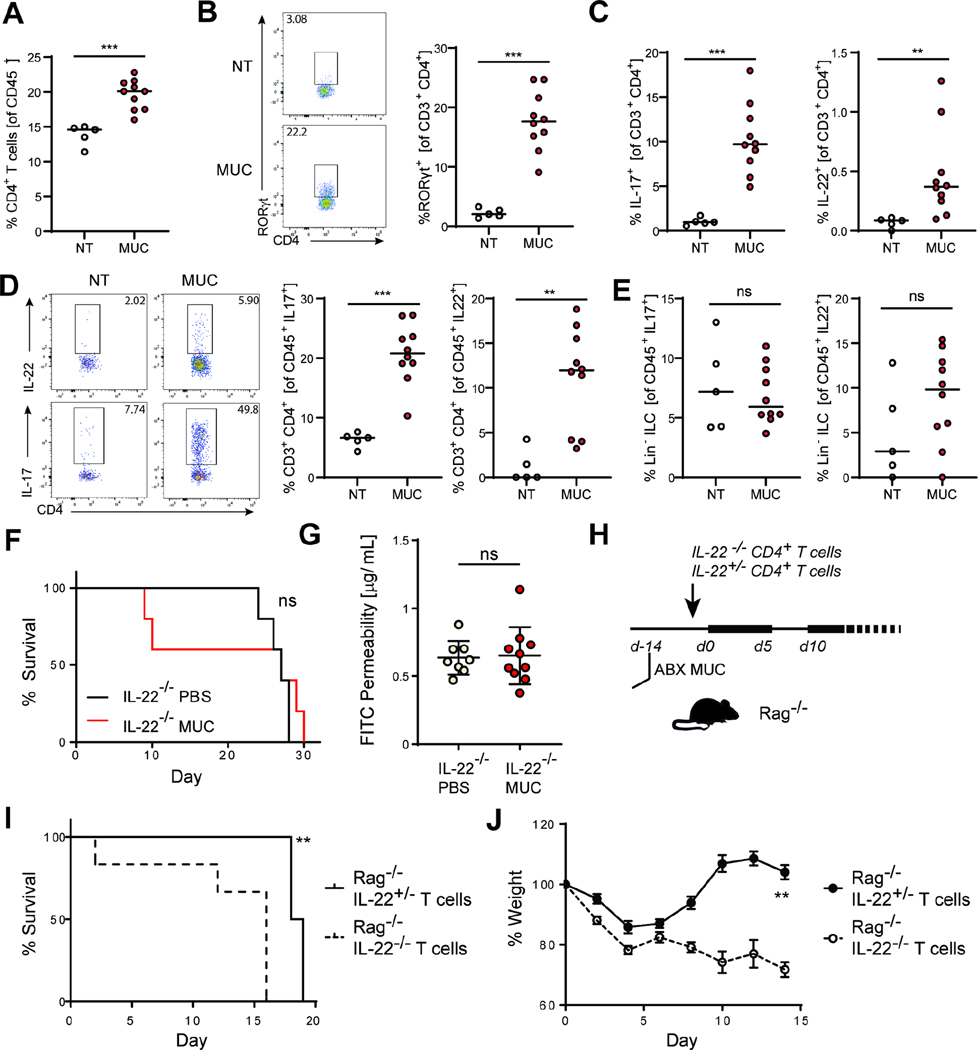
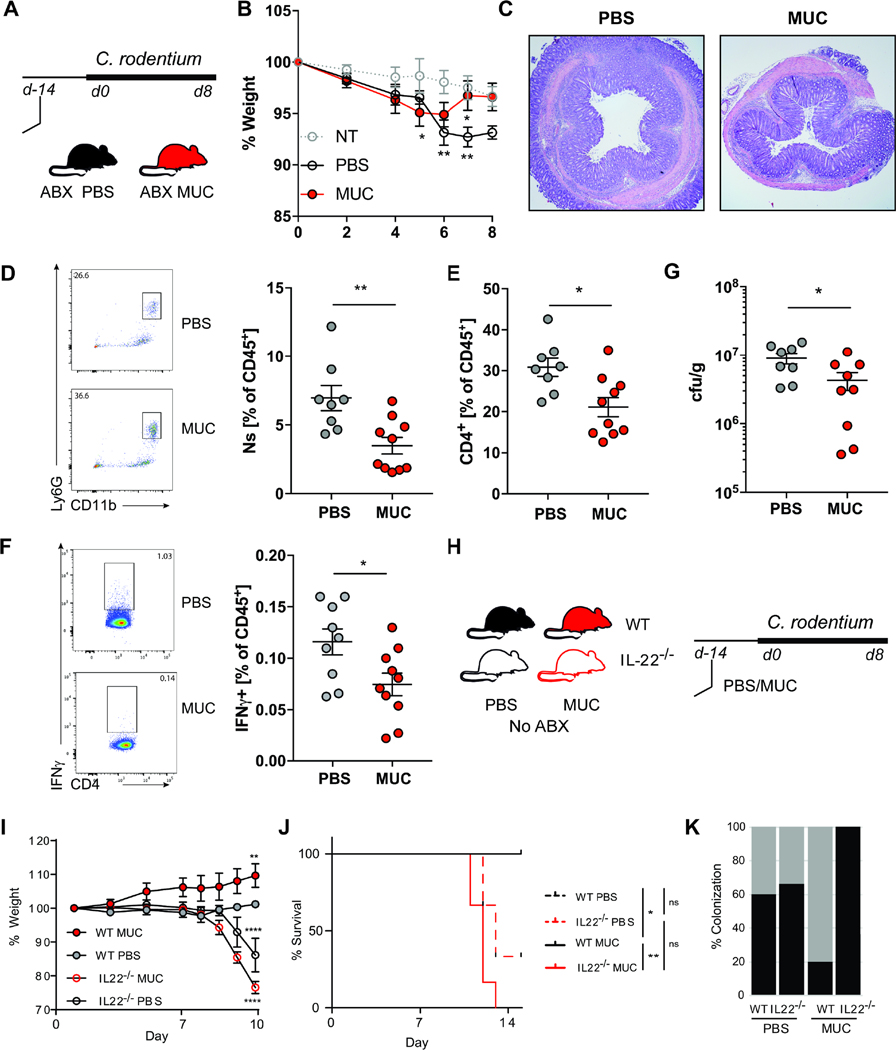
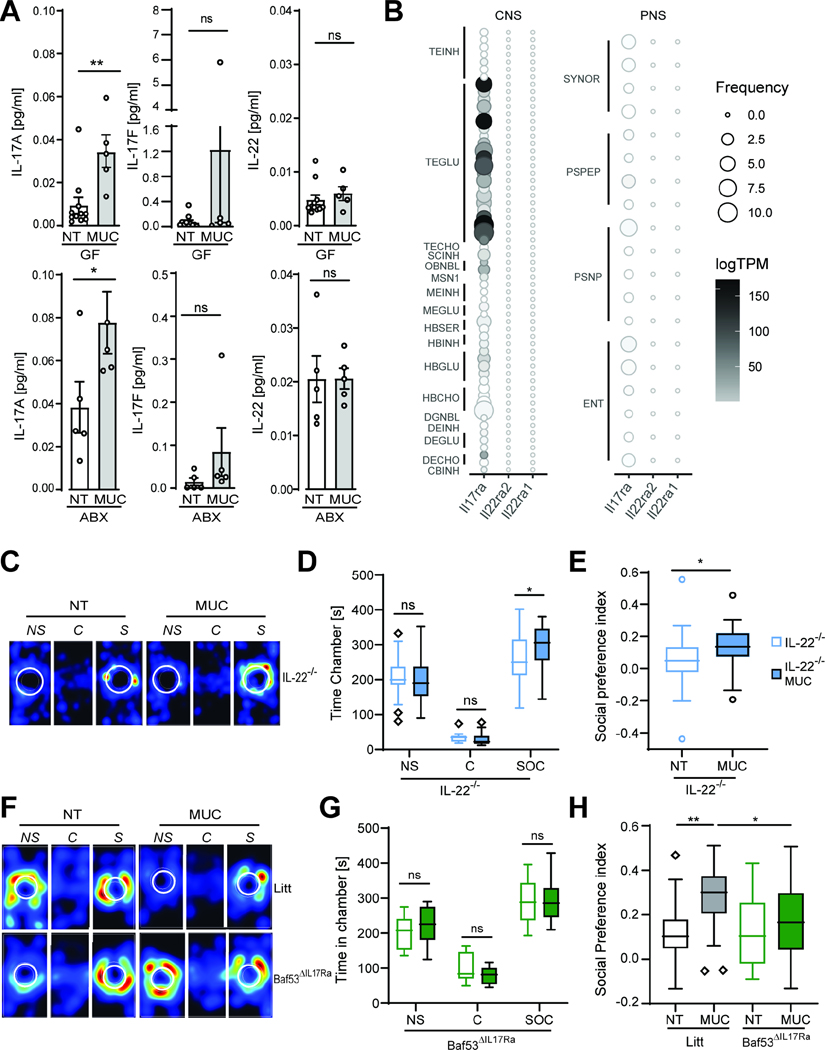
Fungal communities (the mycobiota) are an integral part of the gut microbiota, and the disruption of their integrity contributes to local and gut-distal pathologies. Yet, the mechanisms by which intestinal fungi promote homeostasis remain unclear. We characterized the mycobiota biogeography along the gastrointestinal tract and identified a subset of fungi associated with the intestinal mucosa of mice and humans. Mucosa-associated fungi (MAF) reinforced intestinal epithelial function and protected mice against intestinal injury and bacterial infection. Notably, intestinal colonization with a defined consortium of MAF promoted social behavior in mice. The gut-local effects on barrier function were dependent on IL-22 production by CD4+ T helper cells, whereas the effects on social behavior were mediated through IL-17R-dependent signaling in neurons. Thus, the spatial organization of the gut mycobiota is associated with host-protective immunity and epithelial barrier function and might be a driver of the neuroimmune modulation of mouse behavior through complementary Type 17 immune mechanisms.

Keywords: Th17; fungal consortia; gut-brain axis; intestinal barrier; microbiota biogeography; mycobiome; mycobiota; neuroimmune interactions; social behavior.


Conflict of interest statement

Declaration of interests The authors declare no competing interests.

Figures

Figure 1.
Figure 1.. A distinct fungal community is associated with the murine intestinal mucosa.
A. Luminal and mucosal samples were collected from the stomach, jejunum, ileum, cecum, and colon of 5 female C57Bl/6J mice for DNA isolation and ITS sequencing. Relative abundance at the genus level of the 14 most abundant genera in the mouse intestine. B. Non-metric multidimensional scaling (NMDS) plot of the fungal community structure from the sampled location. C. Shannon diversity index representing the alpha diversity of the fungal community at the OTU level in the sampled location; filled circles: luminal mycobiota (L); empty circles: mucosal associated mycobiota (M). Mean +/− SEM, dots represent individual samples. D. Differentially abundant OTUs between the luminal mycobiota and the mucosal associated mycobiota. Dots represents individual OTUs with a FDR < 0.01 and abundance > 1%. E-F. Characterization of the human mucosa-associated mycobiota, mean +/− SEM, dots represent individual subjects. E. Relative abundance of the major Phyla. F. Relative abundance of the major fungal genera in individual samples (left) and as boxplots (right) in the intestinal mucosa of 7 individuals. G. Mice were colonized with luminal fungi (LUM) or mucosal fungi (MUC) every other day for 10 days prior to DSS treatment. Control groups were orally gavaged with PBS at the same time points. Body weight and the presence of occult blood were assessed daily. Mice were administered sterile 3% dextran sodium sulphate (DSS) in an antibiotic cocktail (ABX: ampicillin 0.4g/l, vancomycin 0.4g/l, metronidazole 0.3g/l, cefoperazone 0.4g/l, 10% sucrose) for 5 days followed by a recovery period of 7 days with ABX and a second 5 days DSS+ABX and ABX cycle until achievement of end point. H. Survival following the first day of DSS administration in the PBS group and LUM colonized group (left). Survival following the first day of DSS administration in the PBS group and MUC colonized group (right). Log-rank (Mantel-Cox) test I. Intestinal permeability was measured by quantification of FITC-dextran serum levels following intragastric gavage of the LUM or MUC consortia in SPF mice. Dots represent individual mice, Mann-Whitney T Test.
Figure 2.
Figure 2.. A defined mucosal fungal consortium promotes barrier integrity and induces the production of IL-22 by CD4+ T cells
A-B: ASF mice were colonized with mucosal fungi (MUC) every other 4 days for 10 days. Single reads RNAseq was performed on colonic epithelial cells (n=4 mice per group, see also Figure S1A, Table S2). A. Volcano plot of RNA-seq on epithelial cells from MUC colonized ASF mice and untreated ASF controls. Red dots represent genes with FDR < 0.1 B. Gene set enrichment analysis (GSEA) of the MUC and ASF RNA-seq results. Bars show normalized enrichment scores (NESs) of the gene set enrichment analysis (GSEA) on the hallmark gene sets. C-I: male and female SPF C57Bl/6J mice were treated with antibiotics and colonized with luminal fungi (LUM) or mucosal fungi (MUC) for 10 days. C. Quantification of myeloid cell populations and in the colonic lamina propria (cLP). D-I. Representative graphs and characterization of the lymphoid populations in the cLP. D. Frequency of type 3 innate lymphoid cells (ILC3) in the cLP. E. Quantification of T helper cells (Th), cytotoxic T cells (Tc), and γδ T cells (γδT) among the CD45+ hematopoietic compartment in the cLP. F. Quantification and representative flow cytometry plots of Th cells subsets in the cLP. G. Quantification and representative flow cytometry plots of IL-17A and IL-17F production by T helper cells in the cLP. H. Quantification and representative flow cytometry plots of IL-22 production by T helper cells in the cLP. I. Quantification and representative flow cytometry plots of IFNγ production by T helper cells in the cLP. Gating strategy for C-H shown in Figure S1 B-C. Immunophenotyping of the mLN is shown in Figure S2. Experiments in C-I were repeated at least three times with n>4 per group. *P<0.05, **P<0.01, ***P<0.001 Mann-Whitney T-test. Data are shown as Tukey box and whiskers plots.
Figure 3.
Figure 3.. The protective effect of a defined mucosal fungal consortium is mediated by IL-22 producing CD4+ T cells.
Male and female SPF C57Bl/6J mice were treated with antibiotics and colonized with luminal fungi (LUM) or mucosal fungi (MUC) for 10 days. A. Frequency of CD3+ CD4+ T cells among CD45+ cells. B. Representative flow cytometry plot and quantification of RORγ+ expressing Th17 cells/. C. IL-17A+, and IL-22+ expression among CD3+ CD4+ T cells in the colonic lamina propria (cLP). D. Representative flow cytometry plot of IL-22 and IL-17 expression by CD4+ T cells and frequency of T cells among IL-17 and IL-22 expressing CD45+ cells E. Frequency of ILC3s among IL-17 and IL-22 expressing CD45+ cells. Gating strategy: CD4+ T cells: Lin+ CD3+CD4+; ILC3s: Lin- (lineage: CD11c, CD11b, NK1.1, Gr1, TCRβ, CD5, CD19), CD3-, CD90.2+, CD127+ RORγ+. See also Figure S3-4. F-J. Il22−/− mice were colonized with mucosal fungi (MUC) every 3 days for 10 days prior to DSS treatment. Control groups were orally gavaged with PBS at the same time points. Mice were administered with sterile 3% dextran sodium sulphate (DSS) in an antibiotic cocktail (ABX: ampicillin 0.4g/l, vancomycin 0.4g/l, metronidazole 0.3g/l, cefoperazone 0.4g/l, 10% Sucrose) for 5 days followed by a recovery period of 7 days with ABX and a second 5 days DSS+ABX and ABX cycle until achievement of end point. F. Survival following the first day of DSS administration in the PBS group and MUC colonized group. G. Intestinal permeability was measured by quantification of FITC-dextran serum levels following intragastric gavage. H. Rag1−/− mice were colonized with mucosal fungi (MUC) and gavaged PBS every 3 days for 10 days followed by adoptive transfer with 4.106 CD4+ T cells from either Il22−/− or Il22+/− mice one day prior to DSS+ABX administration. I. Percent survival. J. Percent change in weight in Rag−/− mice. Dots represent individual mice, mean +/− SEM. *P<0.05, **P<0.01, ***P<0.001. Log-rank (Mantel-Cox) test (C, F); Mann-Whitney T Test (B, D); Experiments were repeated twice with n=4–7 per group.
Figure 4.
Figure 4.. A defined mucosal fungal consortium is protective against C. rodentium induced colitis.
A. C57BL/6J mice were colonized with a fungal consortium (MUC) or administered PBS (PBS) every 3 days for 2 weeks. Mice were administered with an antibiotic cocktail (ampicillin 0.4g/l, vancomycin 0.4g/l, metronidazole 0.3g/l, cefoperazone 0.4g/l, 10% sucrose) or not treated (NT) for 3 days before the inoculation with 109 C. rodentium. Mice were sacrificed at day 8 post C. rodentium infection B. Weight change following C. rodentium infection. #: 2 PBS mice reached the humane end-point and had to be sacrificed on day 6. C. Representative histological H&E section of the colon at day 8. D. Representative flow cytometry plot and quantification of CD11b+ Gr-1+ neutrophils (shown as percent among CD45+ lymphocytes) infiltration in the colonic lamina propria (cLP). E. Quantification of CD4+ T cells infiltration in the cLP. F. Representative flow cytometry plot and quantification of IFNγ+ CD4+ T cells (shown as percent among CD45+ lymphocytes) in the mesenteric lymph nodes (mLN). G. C. rodentium colony forming units (cfu/g) in the feces of at day 7 post infection. Il22−/− or control littermates (WT) were colonized with a fungal consortium (MUC) or administered PBS (PBS) every 3 days for 2 weeks prior to the inoculation with 109 C. rodentium. H. WT and Il22−/− mice were colonized with MUC or administered PBS every 3 days for 2 weeks before the inoculation with 109 C. rodentium. I. weight loss and J. percent survival. K. Percent C. rodentium colonization following colonization with a fungal consortium (MUC) or in control mice fed with PBS. Dots represent individual mice, mean +/− SEM. Experiments were repeated twice with n=6–10 per group. *P<0.05, **P<0.01, ***P<0.001; Mann-Whitney T Test (D-G); two-way ANOVA (B, I); Log-rank (Mantel-Cox) test (J).
Figure 5.
Figure 5.. The mucosal consortium promotes mouse social behavior in the three-chamber social test.
A. 3 weeks old male C57Bl/6J mice were administered with an antibiotic cocktail (ABX: ampicillin 0.4g/l, vancomycin 0.4g/l, metronidazole 0.3g/l, cefoperazone 0.4g/l, 10% sucrose) and were colonized with a fungal consortium (MUC) or administered PBS (PBS) every 4 days until 8 weeks of age. Mice were tested using a three-chamber social task setting. Mice were allowed to explore the empty three-chamber arena for 10 minutes (Habituation Phase). Then, mice were allowed to approach age and sex-matched individuals confined in a cage (S) on one side of the arena or an empty cage (NS) on the other side of the arena (Social Phase). C. center chamber. B. Position heat maps for a single representative mouse of the PBS and MUC group for the habituation (left) and social phase (right). C. Cumulative time spent in the non-social (NS), center (C), and social (S) chamber during the habituation phase. D. Cumulative time spent in the non-social (NS), center (C), and social (S) chamber during the social phase. E. The social preference index for the social phase was calculated based on the time spent in the social (S) and non-social chamber (NS) as (S-NS)/(S+NS). F. Direct interaction index for the social phase. Data shown are mean values, dots represent individual mice, n=10 mice per group. See also Figure S5. G-J. Altered Schadler’s Flora (ASF) colonized mice (males and females) were colonized with a fungal consortium (ASF-MUC) or administered PBS (ASF-PBS) and subjected to the three-chamber social task as described above. Results are pooled from two separate experiments with n>10 per group. G. Position heat maps for a single representative mouse of the ASF-PBS and ASF-MUC group during the social phase. H. Cumulative time spent in the non-social (NS), center (C), and social (S) chamber during the habituation phase. I. Cumulative time spent in the non-social (NS), center (C). C, D, H, I: Data are shown as Tukey box and whiskers plot, Two way ANOVA. E,F,J: Data shown are mean+/−SEM, dots represent individual mice.; E, F: Mann-Whitney T Test. *P<0.05, **P<0.01, ***P<0.001.
Figure 6.
Figure 6.. IL-17Ra signaling on neurons mediates the MUC-induced increase in social behavior.
A. Mice treated with a cocktail of antibiotics (ABX, 0.3g/l Metronidazole, 0.4 g/l Cefoperazone, 0.4g/l Ampicillin, 0.4 g/l Vancomycin) or germ-free mice (GF) were colonized with the MUC consortium (MUC) or not treated (NT). Circulating levels of cytokines in the serum were measured using a bead-based immune assay. Data shown are mean+/− SEM, dots represent individual mice. See also Figure S6 B. B. Expression pattern of the IL-22 receptors genes Il22ra1 and Il22ra2, and the IL-17A receptor gene Il17ra in a previously published single-cell RNA-seq dataset (Zeisel et al., 2018) of the mouse adult central nervous system (CNS) and peripheral nervous system (PNS). TPM: Transcript per million. Neuron cluster names as assigned in Zeisel et al., 2018 are reported in Table S3. C-E. Male and female Il22−/− mice treated with antibiotics and colonized (MUC) or administered PBS (NT) with the mucosal fungi consortium and subjected to the three-chamber social task. C. Representative position heat maps for individual mice of each group during the social phase. D Cumulative time spent by NT or MUC in the non-social (NS), center (C), and social (S) chamber. E. Social preference index for the social phase. F-H. BAF53bCre/+ mice were crossed with Il17rafl/fl mice to selectively abrogate IL-17ra signaling on neurons (Baf53bΔIL17Ra) littermates were used as controls (Litt). Male and female mice were used in the experiment. Mice were treated with antibiotics and colonized with a fungal consortium (MUC) or not (NT). F. Representative position heat maps for individual mice of each group during the social phase. G. Total time spent in the respective chambers during the social phase. Data is representative of three independent experiments. H. Percent time spent in the chamber center or border of the open field test chamber. Data are pooled from three independent experiments. See also Figure S6 C-F. *P<0.05, **P<0.01, ***P<0.001; A, E: Mann-Whitney T Test. D-G: Two ways ANOVA. H: One-way ANOVA. Tukey box and whiskers plot.

Comment in

  • Fungi make fun guys.
    Gaffen SL, Biswas PS. Gaffen SL, et al. Cell Host Microbe. 2022 Mar 9;30(3):277-278. doi: 10.1016/j.chom.2022.02.009. Cell Host Microbe. 2022. PMID: 35271797 Free PMC article.
  • Fungus packs a punch in the gut.
    Cho DH, Choi GB. Cho DH, et al. Immunity. 2022 Apr 12;55(4):586-588. doi: 10.1016/j.immuni.2022.03.012. Immunity. 2022. PMID: 35417672

References

    1. Aggor FEY, Break TJ, Trevejo-Nuñez G, Whibley N, Coleman BM, Bailey RD, Kaplan DH, Naglik JR, Shan W, Shetty AC, McCracken C, Durum SK, Biswas PS, Bruno VM, Kolls JK, Lionakis MS, Gaffen SL, 2020. Oral epithelial IL-22/STAT3 signaling licenses IL-17–mediated immunity to oral mucosal candidiasis. Science Immunology 5, eaba0570. 10.1126/sciimmunol.aba0570 - DOI - PMC - PubMed
    1. Ahlfors H, Morrison PJ, Duarte JH, Li Y, Biro J, Tolaini M, Meglio PD, Potocnik AJ, Stockinger B, 2014. IL-22 Fate Reporter Reveals Origin and Control of IL-22 Production in Homeostasis and Infection. The Journal of Immunology 193, 4602–4613. 10.4049/jimmunol.1401244 - DOI - PMC - PubMed
    1. Albelda N, Joel D, 2012. Animal models of obsessive-compulsive disorder: Exploring pharmacology and neural substrates. Neuroscience & Biobehavioral Reviews 36, 47–63. 10.1016/j.neubiorev.2011.04.006 - DOI - PubMed
    1. Altschul SF, Gish W, Miller W, Myers EW, Lipman DJ, 1990. Basic local alignment search tool. Journal of Molecular Biology 215, 403–410. 10.1016/S0022-2836(05)80360-2 - DOI - PubMed
    1. Alves de Lima K, Rustenhoven J, Da Mesquita S, Wall M, Salvador AF, Smirnov I, Martelossi Cebinelli G, Mamuladze T, Baker W, Papadopoulos Z, Lopes MB, Cao WS, Xie XS, Herz J, Kipnis J, 2020. Meningeal γδ T cells regulate anxiety-like behavior via IL-17a signaling in neurons. Nat Immunol 21, 1421–1429. 10.1038/s41590-020-0776-4 - DOI - PMC - PubMed

Publication types

Substances

LinkOut - more resources