. 2022 Mar;298(3):101731.
doi: 10.1016/j.jbc.2022.101731. Epub 2022 Feb 15.

Zafirlukast inhibits the growth of lung adenocarcinoma via inhibiting TMEM16A channel activity

Affiliations

Zafirlukast inhibits the growth of lung adenocarcinoma via inhibiting TMEM16A channel activity

Sai Shi et al. J Biol Chem. 2022 Mar.

Abstract

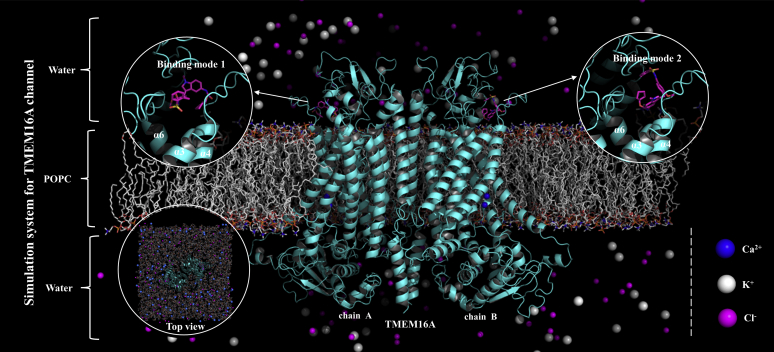
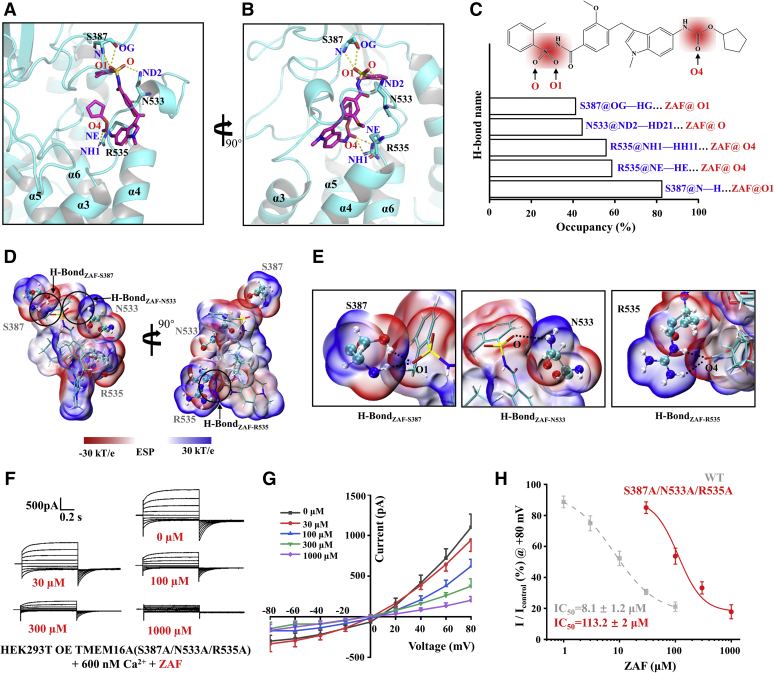
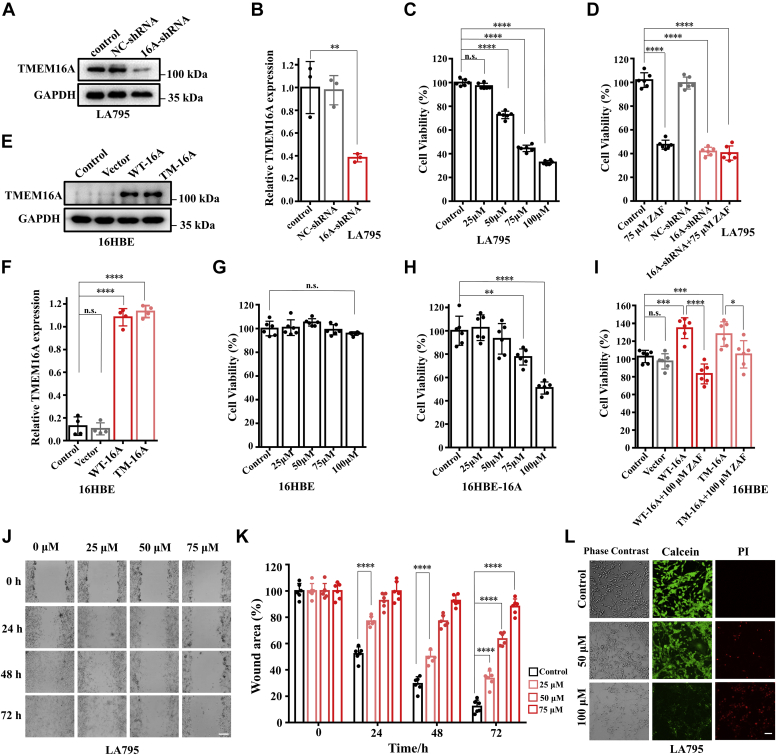
Lung cancer has the highest mortality among cancers worldwide due to its high incidence and lack of the effective cures. We have previously demonstrated that the membrane ion channel TMEM16A is a potential drug target for the treatment of lung adenocarcinoma and have identified a pocket of inhibitor binding that provides the basis for screening promising new inhibitors. However, conventional drug discovery strategies are lengthy and costly, and the unpredictable side effects lead to a high failure rate in drug development. Therefore, finding new therapeutic directions for already marketed drugs may be a feasible strategy to obtain safe and effective therapeutic drugs. Here, we screened a library of over 1400 Food and Drug Administration-approved drugs through virtual screening and activity testing. We identified a drug candidate, Zafirlukast (ZAF), clinically approved for the treatment of asthma, that could inhibit the TMEM16A channel in a concentration-dependent manner. Molecular dynamics simulations and site-directed mutagenesis experiments showed that ZAF can bind to S387/N533/R535 in the nonselective inhibitor binding pocket, thereby blocking the channel pore. Furthermore, we demonstrate ZAF can target TMEM16A channel to inhibit the proliferation and migration of lung adenocarcinoma LA795 cells. In vivo experiments showed that ZAF can significantly inhibit lung adenocarcinoma tumor growth in mice. Taken together, we identified ZAF as a novel TMEM16A channel inhibitor with excellent anticancer activity, and as such, it represents a promising candidate for future preclinical and clinical studies.

Keywords: TMEM16A; inhibitor; ion channel; zafirlukast.


Conflict of interest statement

Conflict of interest The authors declare no conflict of interests.

Figures

Figure 1
Figure 1
ZAF is a novel inhibitor of TMEM16A channel.A, virtual screening flowchart. B, TMEM16A channel inhibitor binding pocket. C, whole-cell currents of HEK293T cells overexpressing (OE) TMEM16A channels were activated by 600 nM Ca2+ in the pipette solution and inhibited by 10 μM of T16Ainh-A01. WT HEK293T as vehicle control. The stimulation protocol: a holding potential of 0 mV for 100 ms, the membrane voltage was clamped in steps of 20 mV from −80 to +80 mV for 750 ms, then back down to −80 mV for 500 ms. D, statistical results of the TMEM16A whole-cell current in (C). Data are means ± SD (n = 3; ∗∗∗∗p < 0.0001, OE TMEM16A + Ca2+versus control; ∗∗∗∗p < 0.0001, OE TMEM16A + Ca2+ + T16Ainh-A01 versus OE TMEM16A + Ca2+). E, the inhibition by Conivaptan, Entrectinib, Pimaricin, and Zafirlukast (100 μM) of TMEM16A current tested at +80 mV. Data are means ± SD (n = 5). F, representative current of TMEM16A inhibited by various concentrations of ZAF (0, 0.01, 0.1, 1, 10, and 100 μM). The stimulation protocol is consistent with (C). G, I-V curve of the TMEM16A currents inhibited with different concentrations of ZAF (n = 5). H, concentration response curves of ZAF inhibition of TMEM16A currents in HEK293T cells. The plot was fitted to the Hill equation (n = 5). HEK293T, human embryonic kidney 293T cells; I-V, current–voltage; ZAF, Zafirlukast.
Figure 2
Figure 2
Molecular dynamics simulation of the TMEM16A system. TMEM16A is shown in cartoon; POPC is shown in stick (gray). ZAF is shown as magenta sticks. Two binding poses of ZAF were placed in the A and B chains of TMEM16A protein respectively. Ca2+, K+, and Cl ions are shown as blue, white, and magenta spheres, respectively. POPC, 1-Palmitoyl-2-oleoyl-sn-glycero-3-phosphocholine; ZAF, Zafirlukast.
Figure 3
Figure 3
Binding mode of ZAF and TMEM16A.A, the RMSD of the protein. B and C, the RMSD of the ZAF heavy atoms. D, the final state of receptors and ligands of the system. E and F, the overlap of the final state (200 ns, three repetitions) and initial state (0 ns) structure of the two binding modes. G, free energy landscape of the ZAF binding mode. H, representations of the binding mode of the ZAF and TMEM16A in their lowest binding energy conformation. ZAF, Zafirlukast.
Figure 4
Figure 4
Identification of ZAF binding sites.A and B, binding mode of ZAF and TMEM16A protein. ZAF is shown as magenta sticks. Binding residues S387, N533, and R535 are shown as cyan sticks. C, H-bond occupancy between the ZAF and S387/N533/R535. The red regions in the molecular structure are the amide group and the sulfonamide group of ZAF. D, ESP-mapped molecular van der Waals surface of ZAF and S387/N533/R535. The stick represents ZAF. Sphere model represents residues. E, H-bond between ZAF and S387/N533/R535. F, representative current of TMEM16A mutant inhibited by various concentrations of ZAF (0, 30, 100, 300, 1000 μM). The stimulation protocol is consistent with Figure 1C. G, I-V curve of the TMEM16A mutant (S387A/N533A/R535A, HEK293T cells) currents inhibited with different concentrations of ZAF (n = 5). H, concentration response curves for ZAF inhibition of TMEM16A mutants, and for comparison, dashed lines are used to show the concentration response curves of ZAF for WT TMEM16A (data from Fig. 1G). The plot was fitted to the Hill equation (n = 5). ESP, electrostatic surface potential; I-V, current–voltage; ZAF, Zafirlukast.
Figure 5
Figure 5
ZAF inhibited proliferation and migration of LA795 cells.A, Western blot images of TMEM16A expression in LA795 cells. The image is from one gel. B, the expression of TMEM16A was normalized to the expression level of GAPDH (HEK293T cells). Data are means ± SD. One-way ANOVA followed by Tukey HSD test (n = 3; ∗∗p = 0.009, 16A-shRNA versus control). C, inhibitory effect of ZAF to the proliferation of LA795. Data are means ± SD. One-way ANOVA followed by Tukey HSD test (n = 6; n.s. p = 0.075, 25 μM ZAF versus control; ∗∗∗∗p < 0.0001, 50 μM ZAF versus control; ∗∗∗∗p < 0.0001, 75 μM ZAF versus control; ∗∗∗∗p < 0.0001, 100 μM ZAF versus control). D, statistics results of cell viability after transfection with shRNA-16A. Data are means ± SD. One-way ANOVA followed by Tukey HSD test (n = 6; ∗∗∗∗p < 0.0001, 75 μM ZAF versus control; ∗∗∗∗p < 0.0001, 16A-shRNA versus control; ∗∗∗∗p < 0.0001, 16A-shRNA+75 μM ZAF versus control). E, Western blot images of TMEM16A expression in 16HBE cells. The image is from one gel. F, the expression of TMEM16A was normalized to the expression level of GAPDH (16HBE cells). Data are means ± SD. One-way ANOVA followed by Tukey HSD test (n = 4; p = 0.642, vector versus control; p < 0.0001, WT-16A [16HBE cells over expression wild type-TMEM16A] versus control; p < 0.0001, TW-16A [16HBE cells over expression triple mutant-TMEM16A(S387A/N533A/R535A)] versus control). G, inhibitory effect of ZAF to the proliferation of 16HBE. Data are means ± SD. One-way ANOVA followed by Tukey HSD test (n = 6; n.s. p = 0.126, 100 μM ZAF versus control). H, inhibitory effect of ZAF to the proliferation of 16HBE transfected with TMEM16A. Data are means ± SD. One-way ANOVA followed by Tukey HSD test (n = 6; ∗∗p = 0.003, 75 μM ZAF versus control; ∗∗p < 0.0001, 100 μM ZAF versus control). I, the effect of TMEM16A expression on the proliferation of 16HBE cells. Data are means ± SD. One-way ANOVA followed by Tukey HSD test (n = 6; n.s. p = 0.251, vector versus control; ∗∗∗p = 0.0018, WT-16A versus control; ∗∗∗p = 0.0025, TM-16A versus control; ∗∗∗∗p < 0.0001, WT-16A versus WT-16A + 100 μM ZAF; ∗p = 0.022, TM-16A versus TM-16A + 100 μM ZAF). J, migration of LA795 cells in the presence of 0, 25, 50, and 75 μM ZAF was assessed by wound healing assay. Scale bar: 100 μm. K, statistical results of wound area in (F). Data are means ± SD. One-way ANOVA followed by Tukey HSD test (n = 6; ∗∗∗∗p < 0.0001, 25 μM ZAF 24 h versus control 24 h; ∗∗∗∗p < 0.0001, 50 μM ZAF 48 h versus control 48 h; ∗∗∗∗p < 0.0001, 75 μM ZAF 72 h versus control 72 h; ∗∗∗∗p < 0.0001, 75 μM ZAF 72 h versus 25 μM ZAF 72 h; ∗∗∗∗p < 0.0001, 75 μM ZAF 72 h versus 50 μM ZAF 72 h). L, live-dead staining images of LA795 cells. Scale bar: 500 μm (n = 6). 16HBE, human bronchial epithelial cells; HSD, honestly significant difference; ZAF, Zafirlukast.
Figure 6
Figure 6
ZAF inhibits the growth of tumors in vivo.A, schematic diagram of experimental design and treatment. B, tumor volume growth curve in different groups (n = 6). C, body weight growth curve in different groups (n = 6). D, stripped images of the tumor entity after 7 administrations (n = 6). E, statistical results of the stripped tumor weight in (D) (n = 6). Data are means ± SD. One-way ANOVA followed by Tukey HSD test (n = 6; ∗p = 0.022, Cisplatin 6.5 mg/kg versus control; ∗p = 0.047, ZAF 2.9 mg/kg versus control; ∗∗p = 0.0013, ZAF 5.8 mg/kg versus control). F, statistical results of the stripped tumor volume in (D). Data are means ± SD. One-way ANOVA followed by Tukey HSD test (n = 6; ∗p = 0.021, Cisplatin 6.5 mg/kg versus control; ∗p = 0.031, ZAF 2.9 mg/kg versus control; ∗∗p = 0.001, ZAF 5.8 mg/kg versus control). G, histological sections of an excised tumor of each group after treatment. 20×. Scale bar: 50 μm. HSD, honestly significant difference; ZAF, Zafirlukast.

References

    1. Stewart B., Wild C. International Agency for Research on Cancer; Lyon, France: 2014. World Cancer Report 2014.
    1. Ferlay J., Colombet M., Soerjomataram I., Parkin D.M., Bray F. Cancer statistics for the year 2020: An overview. Int. J. Cancer. 2021;149:778–789. - PubMed
    1. Barta J.A., Powell C.A., Wisnivesky J.P. Global epidemiology of lung cancer. Ann. Glob. Health. 2019;85:8. - PMC - PubMed
    1. Jia L., Liu W., Guan L., Lu M., Wang K.W. Inhibition of calcium-activated chloride channel ANO1/TMEM16A suppresses tumor growth and invasion in human lung cancer. PLoS One. 2015;10 - PMC - PubMed
    1. Xin H., Gollin S.M., Raja S., Godfrey T.E. High-resolution mapping of the 11q13 amplicon and identification of a gene, TAOS1, that is amplified and overexpressed in oral cancer cells. Proc. Natl. Acad. Sci. U. S. A. 2002;99:11369–11374. - PMC - PubMed

MeSH terms